Cities with the Largest Jordanian Community in New York
RELATED REPORTS & OPTIONS
Jordanian
New York
Compare Cities
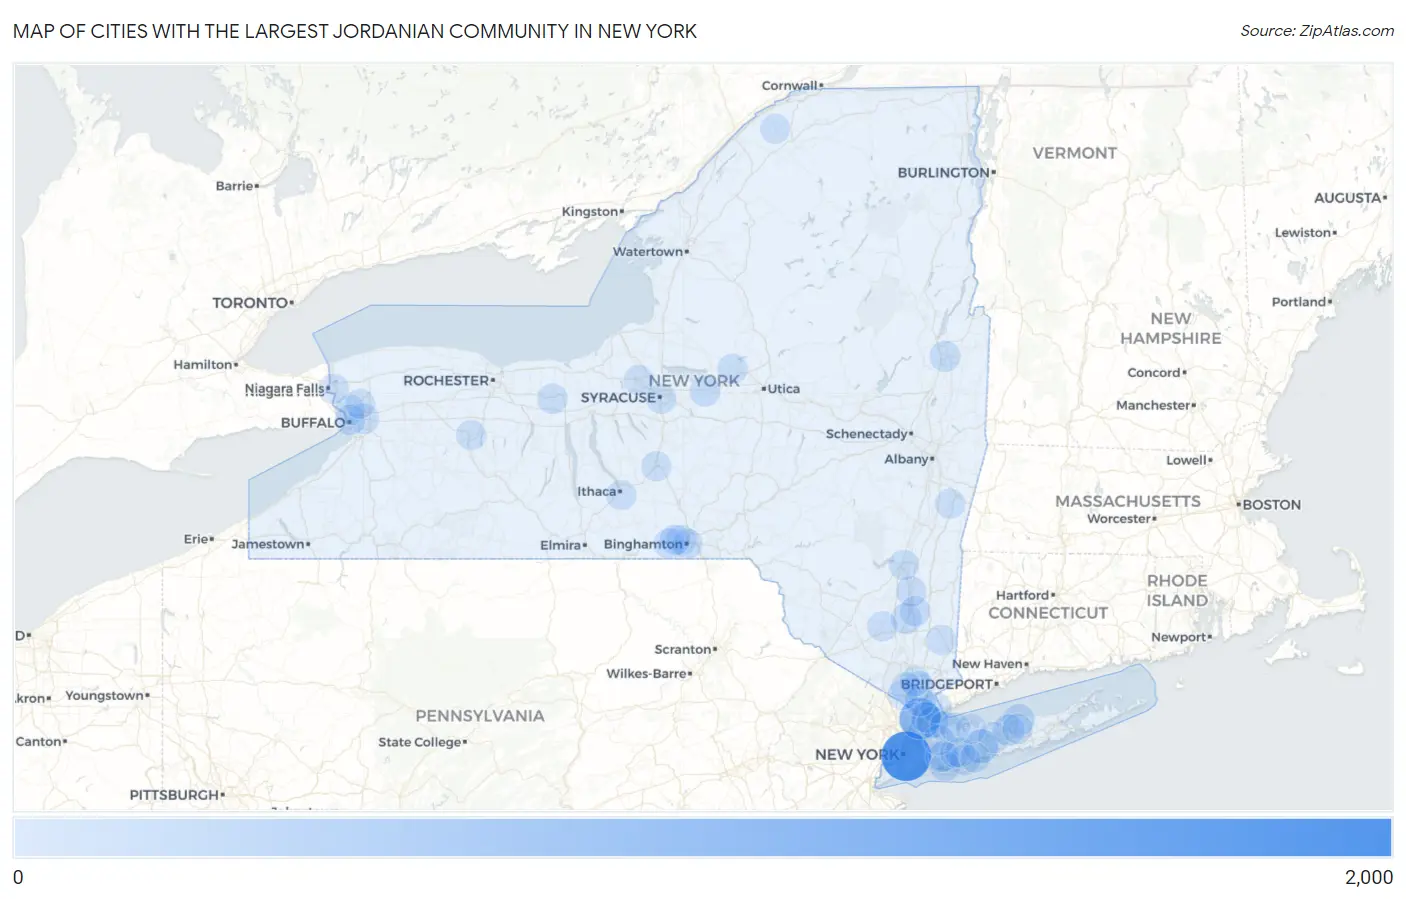
Map of Cities with the Largest Jordanian Community in New York
0
2,000
Cities with the Largest Jordanian Community in New York
| City | Jordanian | vs State | vs National | |
| 1. | New York | 1,887 | 6,042(31.23%)#1 | 93,877(2.01%)#3 |
| 2. | Yonkers | 1,066 | 6,042(17.64%)#2 | 93,877(1.14%)#6 |
| 3. | Deer Park | 359 | 6,042(5.94%)#3 | 93,877(0.38%)#43 |
| 4. | Miller Place | 160 | 6,042(2.65%)#4 | 93,877(0.17%)#125 |
| 5. | Centereach | 139 | 6,042(2.30%)#5 | 93,877(0.15%)#143 |
| 6. | Larchmont | 134 | 6,042(2.22%)#6 | 93,877(0.14%)#150 |
| 7. | Franklin Square | 123 | 6,042(2.04%)#7 | 93,877(0.13%)#162 |
| 8. | Hauppauge | 106 | 6,042(1.75%)#8 | 93,877(0.11%)#186 |
| 9. | Harrison | 88 | 6,042(1.46%)#9 | 93,877(0.09%)#221 |
| 10. | Glens Falls | 75 | 6,042(1.24%)#10 | 93,877(0.08%)#255 |
| 11. | Marlboro | 75 | 6,042(1.24%)#11 | 93,877(0.08%)#256 |
| 12. | Hurleyville | 68 | 6,042(1.13%)#12 | 93,877(0.07%)#279 |
| 13. | Canastota | 52 | 6,042(0.86%)#13 | 93,877(0.06%)#338 |
| 14. | Cheektowaga | 42 | 6,042(0.70%)#14 | 93,877(0.04%)#393 |
| 15. | Loudonville | 38 | 6,042(0.63%)#15 | 93,877(0.04%)#419 |
| 16. | Hyde Park | 34 | 6,042(0.56%)#16 | 93,877(0.04%)#447 |
| 17. | Ossining | 33 | 6,042(0.55%)#17 | 93,877(0.04%)#454 |
| 18. | West Hempstead | 33 | 6,042(0.55%)#18 | 93,877(0.04%)#455 |
| 19. | Endicott | 32 | 6,042(0.53%)#19 | 93,877(0.03%)#464 |
| 20. | Massapequa | 30 | 6,042(0.50%)#20 | 93,877(0.03%)#478 |
| 21. | Eastchester | 30 | 6,042(0.50%)#21 | 93,877(0.03%)#479 |
| 22. | New City | 28 | 6,042(0.46%)#22 | 93,877(0.03%)#506 |
| 23. | Buffalo | 25 | 6,042(0.41%)#23 | 93,877(0.03%)#539 |
| 24. | Johnson City | 25 | 6,042(0.41%)#24 | 93,877(0.03%)#550 |
| 25. | Spackenkill | 25 | 6,042(0.41%)#25 | 93,877(0.03%)#553 |
| 26. | Oceanside | 22 | 6,042(0.36%)#26 | 93,877(0.02%)#573 |
| 27. | Binghamton | 20 | 6,042(0.33%)#27 | 93,877(0.02%)#606 |
| 28. | Coram | 20 | 6,042(0.33%)#28 | 93,877(0.02%)#608 |
| 29. | Tarrytown | 19 | 6,042(0.31%)#29 | 93,877(0.02%)#626 |
| 30. | Lincoln Park | 19 | 6,042(0.31%)#30 | 93,877(0.02%)#629 |
| 31. | Endwell | 18 | 6,042(0.30%)#31 | 93,877(0.02%)#647 |
| 32. | Newark | 17 | 6,042(0.28%)#32 | 93,877(0.02%)#671 |
| 33. | Nanuet | 16 | 6,042(0.26%)#33 | 93,877(0.02%)#681 |
| 34. | Syracuse | 15 | 6,042(0.25%)#34 | 93,877(0.02%)#690 |
| 35. | Plandome | 14 | 6,042(0.23%)#35 | 93,877(0.01%)#733 |
| 36. | East Meadow | 13 | 6,042(0.22%)#36 | 93,877(0.01%)#743 |
| 37. | Walden | 13 | 6,042(0.22%)#37 | 93,877(0.01%)#750 |
| 38. | Glen Cove | 11 | 6,042(0.18%)#38 | 93,877(0.01%)#785 |
| 39. | Levittown | 10 | 6,042(0.17%)#39 | 93,877(0.01%)#810 |
| 40. | Lake Carmel | 10 | 6,042(0.17%)#40 | 93,877(0.01%)#814 |
| 41. | Baldwinsville | 10 | 6,042(0.17%)#41 | 93,877(0.01%)#815 |
| 42. | South Hill | 10 | 6,042(0.17%)#42 | 93,877(0.01%)#817 |
| 43. | Lindenhurst | 9 | 6,042(0.15%)#43 | 93,877(0.01%)#838 |
| 44. | Croton On Hudson | 8 | 6,042(0.13%)#44 | 93,877(0.01%)#871 |
| 45. | Chatham | 8 | 6,042(0.13%)#45 | 93,877(0.01%)#876 |
| 46. | Vassar College | 7 | 6,042(0.12%)#46 | 93,877(0.01%)#903 |
| 47. | Rome | 6 | 6,042(0.10%)#47 | 93,877(0.01%)#919 |
| 48. | Huntington | 5 | 6,042(0.08%)#48 | 93,877(0.01%)#941 |
| 49. | Cortland | 5 | 6,042(0.08%)#49 | 93,877(0.01%)#942 |
| 50. | Kenmore | 5 | 6,042(0.08%)#50 | 93,877(0.01%)#943 |
| 51. | Geneseo | 4 | 6,042(0.07%)#51 | 93,877(0.00%)#965 |
| 52. | Niagara Falls | 3 | 6,042(0.05%)#52 | 93,877(0.00%)#976 |
| 53. | Mill Neck | 3 | 6,042(0.05%)#53 | 93,877(0.00%)#981 |
| 54. | Madrid | 3 | 6,042(0.05%)#54 | 93,877(0.00%)#982 |
| 55. | University At Buffalo | 1 | 6,042(0.02%)#55 | 93,877(0.00%)#1,001 |
Common Questions
What are the Top 10 Cities with the Largest Jordanian Community in New York?
Top 10 Cities with the Largest Jordanian Community in New York are:
#1
1,887
#2
1,066
#3
359
#4
160
#5
139
#6
134
#7
123
#8
106
#9
88
#10
75
What city has the Largest Jordanian Community in New York?
New York has the Largest Jordanian Community in New York with 1,887.
What is the Total Jordanian Population in the State of New York?
Total Jordanian Population in New York is 6,042.
What is the Total Jordanian Population in the United States?
Total Jordanian Population in the United States is 93,877.