Cities with the Highest Percentage of Puerto Rican Population in New York
RELATED REPORTS & OPTIONS
Puerto Rican
New York
Compare Cities
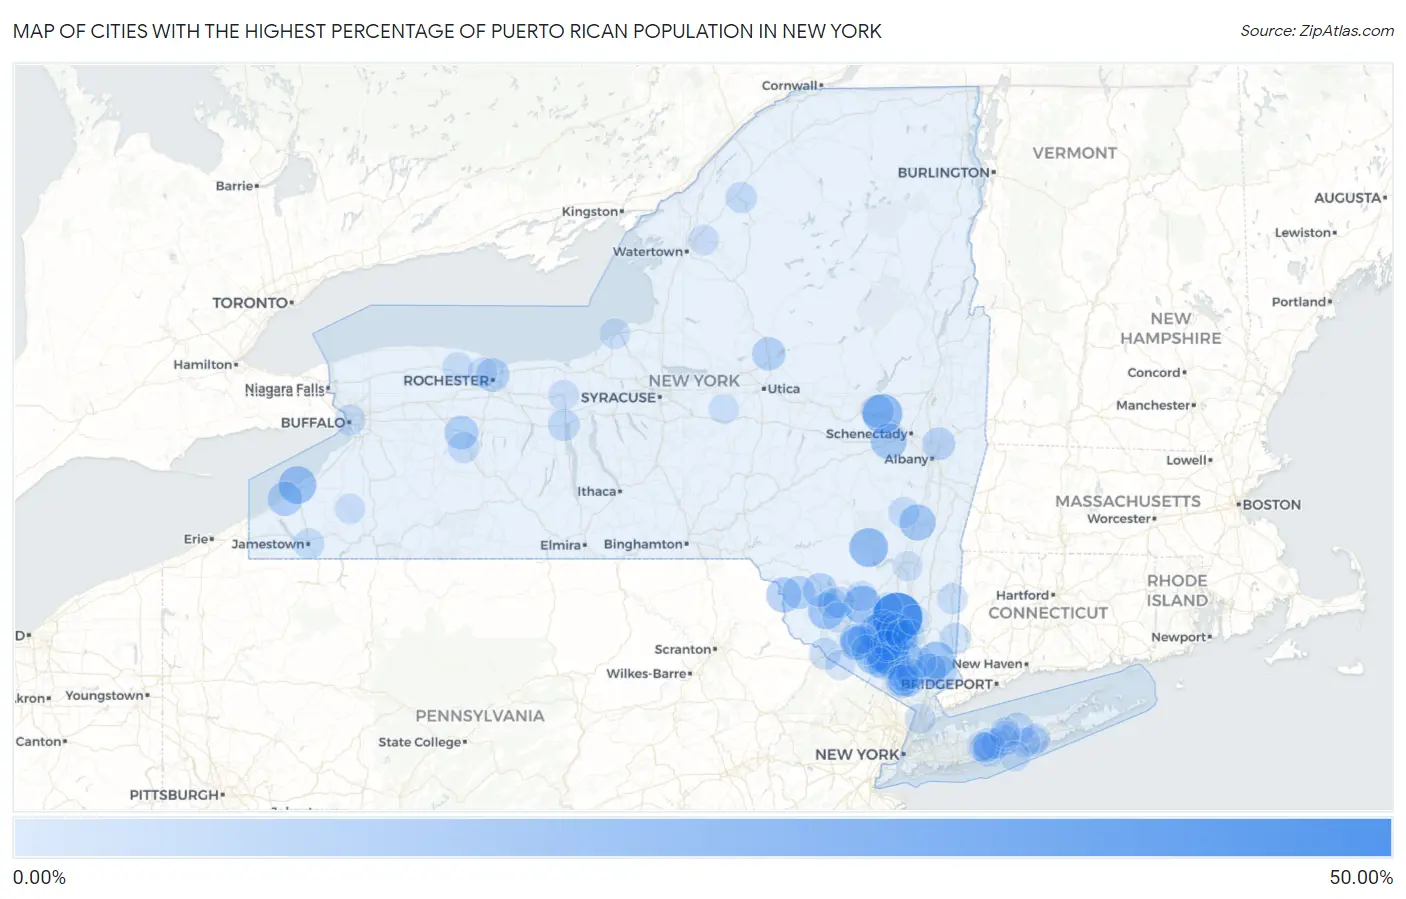
Map of Cities with the Highest Percentage of Puerto Rican Population in New York
0.00%
50.00%
Cities with the Highest Percentage of Puerto Rican Population in New York
| City | Puerto Rican | vs State | vs National | |
| 1. | Wassaic | 47.85% | 5.34%(+42.5)#1 | 1.78%(+46.1)#294 |
| 2. | Plattekill | 46.60% | 5.34%(+41.3)#2 | 1.78%(+44.8)#296 |
| 3. | Mountain Lodge Park | 32.31% | 5.34%(+27.0)#3 | 1.78%(+30.5)#315 |
| 4. | Amsterdam | 25.96% | 5.34%(+20.6)#4 | 1.78%(+24.2)#342 |
| 5. | Phoenicia | 24.44% | 5.34%(+19.1)#5 | 1.78%(+22.7)#351 |
| 6. | Ellenville | 23.26% | 5.34%(+17.9)#6 | 1.78%(+21.5)#359 |
| 7. | North Bay | 22.88% | 5.34%(+17.5)#7 | 1.78%(+21.1)#363 |
| 8. | Dunkirk | 22.34% | 5.34%(+17.0)#8 | 1.78%(+20.6)#368 |
| 9. | Montgomery | 21.36% | 5.34%(+16.0)#9 | 1.78%(+19.6)#375 |
| 10. | Lincolndale | 20.87% | 5.34%(+15.5)#10 | 1.78%(+19.1)#381 |
| 11. | Monticello | 19.55% | 5.34%(+14.2)#11 | 1.78%(+17.8)#395 |
| 12. | Jefferson Heights | 19.30% | 5.34%(+14.0)#12 | 1.78%(+17.5)#403 |
| 13. | Duanesburg | 19.02% | 5.34%(+13.7)#13 | 1.78%(+17.2)#410 |
| 14. | Woodbury | 17.47% | 5.34%(+12.1)#14 | 1.78%(+15.7)#429 |
| 15. | Callicoon | 17.33% | 5.34%(+12.0)#15 | 1.78%(+15.6)#430 |
| 16. | Chester | 17.00% | 5.34%(+11.7)#16 | 1.78%(+15.2)#432 |
| 17. | Fort Montgomery | 16.39% | 5.34%(+11.0)#17 | 1.78%(+14.6)#444 |
| 18. | Brocton | 16.02% | 5.34%(+10.7)#18 | 1.78%(+14.2)#453 |
| 19. | Maybrook | 15.57% | 5.34%(+10.2)#19 | 1.78%(+13.8)#462 |
| 20. | Grahamsville | 15.46% | 5.34%(+10.1)#20 | 1.78%(+13.7)#466 |
| 21. | West Haverstraw | 15.14% | 5.34%(+9.79)#21 | 1.78%(+13.4)#473 |
| 22. | New Windsor | 14.97% | 5.34%(+9.63)#22 | 1.78%(+13.2)#477 |
| 23. | Mechanicstown | 14.94% | 5.34%(+9.60)#23 | 1.78%(+13.2)#479 |
| 24. | Wadsworth | 14.86% | 5.34%(+9.52)#24 | 1.78%(+13.1)#480 |
| 25. | Liberty | 14.71% | 5.34%(+9.37)#25 | 1.78%(+12.9)#482 |
| 26. | Rochester | 14.65% | 5.34%(+9.31)#26 | 1.78%(+12.9)#483 |
| 27. | Monroe | 14.65% | 5.34%(+9.31)#27 | 1.78%(+12.9)#484 |
| 28. | Katonah | 14.47% | 5.34%(+9.13)#28 | 1.78%(+12.7)#489 |
| 29. | Middletown | 14.29% | 5.34%(+8.95)#29 | 1.78%(+12.5)#494 |
| 30. | Remsen | 14.15% | 5.34%(+8.80)#30 | 1.78%(+12.4)#499 |
| 31. | Beaver Dam Lake | 13.80% | 5.34%(+8.46)#31 | 1.78%(+12.0)#507 |
| 32. | Washington Heights | 13.61% | 5.34%(+8.27)#32 | 1.78%(+11.8)#514 |
| 33. | Yorktown Heights | 13.55% | 5.34%(+8.21)#33 | 1.78%(+11.8)#518 |
| 34. | Jeffersonville | 13.36% | 5.34%(+8.02)#34 | 1.78%(+11.6)#527 |
| 35. | Fort Johnson | 13.33% | 5.34%(+7.99)#35 | 1.78%(+11.6)#528 |
| 36. | New Baltimore | 13.30% | 5.34%(+7.96)#36 | 1.78%(+11.5)#530 |
| 37. | Mount Ivy | 13.26% | 5.34%(+7.92)#37 | 1.78%(+11.5)#532 |
| 38. | Green Island | 13.01% | 5.34%(+7.66)#38 | 1.78%(+11.2)#539 |
| 39. | Orange Lake | 12.83% | 5.34%(+7.49)#39 | 1.78%(+11.1)#546 |
| 40. | Walden | 11.69% | 5.34%(+6.35)#40 | 1.78%(+9.91)#596 |
| 41. | Coram | 11.62% | 5.34%(+6.28)#41 | 1.78%(+9.84)#602 |
| 42. | Gardnertown | 11.44% | 5.34%(+6.09)#42 | 1.78%(+9.66)#609 |
| 43. | Washingtonville | 11.18% | 5.34%(+5.84)#43 | 1.78%(+9.40)#619 |
| 44. | Geneva | 10.94% | 5.34%(+5.60)#44 | 1.78%(+9.16)#630 |
| 45. | Brentwood | 10.93% | 5.34%(+5.59)#45 | 1.78%(+9.15)#631 |
| 46. | Woodridge | 10.90% | 5.34%(+5.55)#46 | 1.78%(+9.11)#633 |
| 47. | Port Jervis | 10.87% | 5.34%(+5.52)#47 | 1.78%(+9.08)#635 |
| 48. | Bay Shore | 10.63% | 5.34%(+5.29)#48 | 1.78%(+8.85)#652 |
| 49. | Putnam Lake | 10.61% | 5.34%(+5.27)#49 | 1.78%(+8.83)#653 |
| 50. | Newburgh | 10.39% | 5.34%(+5.05)#50 | 1.78%(+8.61)#670 |
| 51. | Thiells | 10.24% | 5.34%(+4.90)#51 | 1.78%(+8.46)#679 |
| 52. | Barryville | 10.19% | 5.34%(+4.85)#52 | 1.78%(+8.41)#682 |
| 53. | Mount Morris | 10.13% | 5.34%(+4.79)#53 | 1.78%(+8.35)#684 |
| 54. | Lake Delta | 10.11% | 5.34%(+4.76)#54 | 1.78%(+8.32)#686 |
| 55. | Hailesboro | 10.05% | 5.34%(+4.70)#55 | 1.78%(+8.27)#690 |
| 56. | Brewster Heights | 9.98% | 5.34%(+4.64)#56 | 1.78%(+8.20)#695 |
| 57. | Cairo | 9.76% | 5.34%(+4.41)#57 | 1.78%(+7.97)#709 |
| 58. | Beacon | 9.74% | 5.34%(+4.40)#58 | 1.78%(+7.96)#711 |
| 59. | Kiamesha Lake | 9.66% | 5.34%(+4.31)#59 | 1.78%(+7.87)#717 |
| 60. | Jamestown | 9.54% | 5.34%(+4.19)#60 | 1.78%(+7.75)#733 |
| 61. | Clarkson | 9.28% | 5.34%(+3.94)#61 | 1.78%(+7.50)#756 |
| 62. | Haverstraw | 9.27% | 5.34%(+3.93)#62 | 1.78%(+7.49)#757 |
| 63. | Stony Point | 9.24% | 5.34%(+3.90)#63 | 1.78%(+7.46)#760 |
| 64. | South Fallsburg | 9.24% | 5.34%(+3.89)#64 | 1.78%(+7.45)#761 |
| 65. | Tuxedo | 9.21% | 5.34%(+3.87)#65 | 1.78%(+7.43)#763 |
| 66. | Dover Plains | 9.19% | 5.34%(+3.84)#66 | 1.78%(+7.40)#764 |
| 67. | Ronkonkoma | 9.12% | 5.34%(+3.78)#67 | 1.78%(+7.34)#770 |
| 68. | Montrose | 8.99% | 5.34%(+3.64)#68 | 1.78%(+7.20)#785 |
| 69. | Buffalo | 8.98% | 5.34%(+3.64)#69 | 1.78%(+7.20)#786 |
| 70. | Shirley | 8.79% | 5.34%(+3.45)#70 | 1.78%(+7.01)#802 |
| 71. | North Bay Shore | 8.79% | 5.34%(+3.45)#71 | 1.78%(+7.01)#803 |
| 72. | Napanoch | 8.78% | 5.34%(+3.44)#72 | 1.78%(+7.00)#805 |
| 73. | Central Islip | 8.64% | 5.34%(+3.30)#73 | 1.78%(+6.86)#811 |
| 74. | Mastic | 8.58% | 5.34%(+3.24)#74 | 1.78%(+6.80)#816 |
| 75. | Suny Oswego | 8.57% | 5.34%(+3.22)#75 | 1.78%(+6.79)#818 |
| 76. | Yonkers | 8.56% | 5.34%(+3.22)#76 | 1.78%(+6.78)#820 |
| 77. | North Bellport | 8.55% | 5.34%(+3.20)#77 | 1.78%(+6.76)#822 |
| 78. | Fort Drum | 8.53% | 5.34%(+3.19)#78 | 1.78%(+6.75)#824 |
| 79. | Walton Park | 8.53% | 5.34%(+3.19)#79 | 1.78%(+6.75)#825 |
| 80. | Greece | 8.51% | 5.34%(+3.17)#80 | 1.78%(+6.73)#828 |
| 81. | Wappingers Falls | 8.50% | 5.34%(+3.16)#81 | 1.78%(+6.72)#830 |
| 82. | Lake Ronkonkoma | 8.44% | 5.34%(+3.10)#82 | 1.78%(+6.66)#835 |
| 83. | Lake Grove | 8.41% | 5.34%(+3.07)#83 | 1.78%(+6.63)#837 |
| 84. | Lyons | 8.40% | 5.34%(+3.06)#84 | 1.78%(+6.62)#841 |
| 85. | Deer Park | 8.35% | 5.34%(+3.01)#85 | 1.78%(+6.57)#848 |
| 86. | Baywood | 8.20% | 5.34%(+2.85)#86 | 1.78%(+6.41)#870 |
| 87. | Fallsburg | 8.17% | 5.34%(+2.82)#87 | 1.78%(+6.38)#871 |
| 88. | Unionville | 8.06% | 5.34%(+2.72)#88 | 1.78%(+6.28)#882 |
| 89. | Fire Island | 8.05% | 5.34%(+2.71)#89 | 1.78%(+6.27)#884 |
| 90. | Unadilla Forks | 8.04% | 5.34%(+2.70)#90 | 1.78%(+6.26)#885 |
| 91. | Cattaraugus | 8.01% | 5.34%(+2.67)#91 | 1.78%(+6.23)#887 |
| 92. | East Kingston | 7.98% | 5.34%(+2.63)#92 | 1.78%(+6.19)#892 |
| 93. | Rock Hill | 7.93% | 5.34%(+2.58)#93 | 1.78%(+6.15)#900 |
| 94. | Scotchtown | 7.85% | 5.34%(+2.51)#94 | 1.78%(+6.07)#911 |
| 95. | Lake Mohegan | 7.85% | 5.34%(+2.50)#95 | 1.78%(+6.07)#912 |
| 96. | New Hackensack | 7.83% | 5.34%(+2.48)#96 | 1.78%(+6.04)#916 |
| 97. | Munnsville | 7.71% | 5.34%(+2.37)#97 | 1.78%(+5.93)#926 |
| 98. | Gardiner | 7.69% | 5.34%(+2.35)#98 | 1.78%(+5.91)#928 |
| 99. | East Worcester | 7.66% | 5.34%(+2.31)#99 | 1.78%(+5.87)#930 |
| 100. | Goshen | 7.65% | 5.34%(+2.31)#100 | 1.78%(+5.87)#931 |
Common Questions
What are the Top 10 Cities with the Highest Percentage of Puerto Rican Population in New York?
Top 10 Cities with the Highest Percentage of Puerto Rican Population in New York are:
#1
46.60%
#2
32.31%
#3
25.96%
#4
24.44%
#5
23.26%
#6
22.34%
#7
21.36%
#8
20.87%
#9
19.55%
#10
19.30%
What city has the Highest Percentage of Puerto Rican Population in New York?
Plattekill has the Highest Percentage of Puerto Rican Population in New York with 46.60%.
What is the Percentage of Puerto Rican Population in the State of New York?
Percentage of Puerto Rican Population in New York is 5.34%.
What is the Percentage of Puerto Rican Population in the United States?
Percentage of Puerto Rican Population in the United States is 1.78%.