Cities with the Largest Panamanian Community in New York
RELATED REPORTS & OPTIONS
Panamanian
New York
Compare Cities
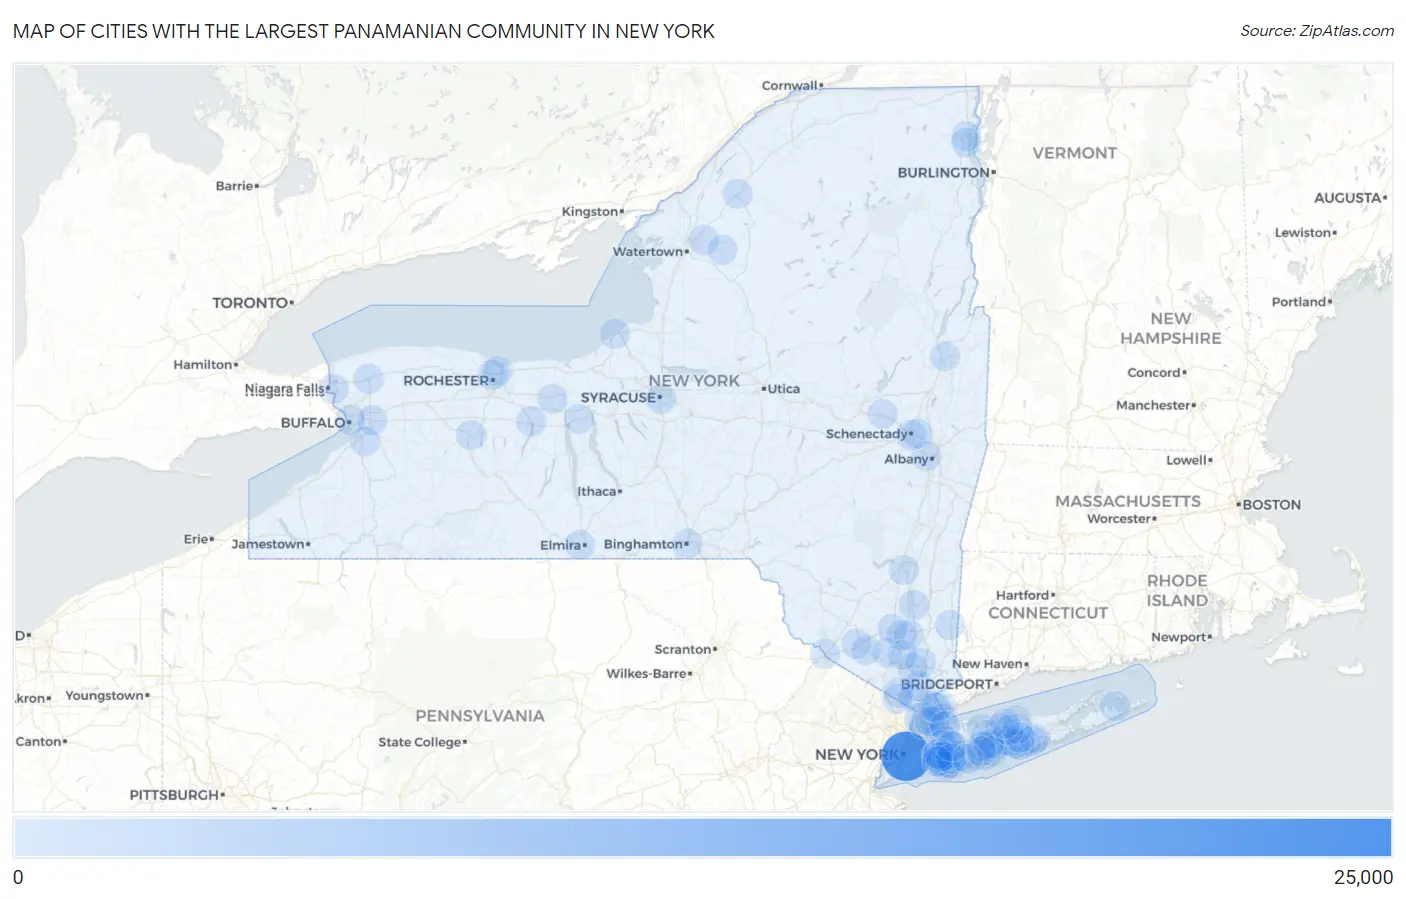
Map of Cities with the Largest Panamanian Community in New York
0
25,000
Cities with the Largest Panamanian Community in New York
| City | Panamanian | vs State | vs National | |
| 1. | New York | 22,558 | 32,328(69.78%)#1 | 224,385(10.05%)#1 |
| 2. | Yonkers | 925 | 32,328(2.86%)#2 | 224,385(0.41%)#16 |
| 3. | West Islip | 388 | 32,328(1.20%)#3 | 224,385(0.17%)#66 |
| 4. | Mount Vernon | 334 | 32,328(1.03%)#4 | 224,385(0.15%)#84 |
| 5. | Freeport | 320 | 32,328(0.99%)#5 | 224,385(0.14%)#92 |
| 6. | Poughkeepsie | 261 | 32,328(0.81%)#6 | 224,385(0.12%)#121 |
| 7. | Syracuse | 260 | 32,328(0.80%)#7 | 224,385(0.12%)#124 |
| 8. | Rochester | 241 | 32,328(0.75%)#8 | 224,385(0.11%)#135 |
| 9. | Nyack | 235 | 32,328(0.73%)#9 | 224,385(0.10%)#140 |
| 10. | Rye | 211 | 32,328(0.65%)#10 | 224,385(0.09%)#164 |
| 11. | Lynbrook | 204 | 32,328(0.63%)#11 | 224,385(0.09%)#174 |
| 12. | Elmont | 187 | 32,328(0.58%)#12 | 224,385(0.08%)#195 |
| 13. | North Bellport | 186 | 32,328(0.58%)#13 | 224,385(0.08%)#196 |
| 14. | Hempstead | 178 | 32,328(0.55%)#14 | 224,385(0.08%)#204 |
| 15. | Port Washington | 143 | 32,328(0.44%)#15 | 224,385(0.06%)#267 |
| 16. | Fort Drum | 140 | 32,328(0.43%)#16 | 224,385(0.06%)#282 |
| 17. | Rye Brook | 139 | 32,328(0.43%)#17 | 224,385(0.06%)#286 |
| 18. | Baldwin | 132 | 32,328(0.41%)#18 | 224,385(0.06%)#303 |
| 19. | Mamaroneck | 123 | 32,328(0.38%)#19 | 224,385(0.05%)#326 |
| 20. | Ossining | 119 | 32,328(0.37%)#20 | 224,385(0.05%)#335 |
| 21. | Lockport | 118 | 32,328(0.37%)#21 | 224,385(0.05%)#339 |
| 22. | White Plains | 109 | 32,328(0.34%)#22 | 224,385(0.05%)#371 |
| 23. | North Wantagh | 104 | 32,328(0.32%)#23 | 224,385(0.05%)#386 |
| 24. | Albany | 87 | 32,328(0.27%)#24 | 224,385(0.04%)#459 |
| 25. | Amsterdam | 82 | 32,328(0.25%)#25 | 224,385(0.04%)#483 |
| 26. | Waterloo | 82 | 32,328(0.25%)#26 | 224,385(0.04%)#485 |
| 27. | Central Islip | 80 | 32,328(0.25%)#27 | 224,385(0.04%)#491 |
| 28. | Newburgh | 78 | 32,328(0.24%)#28 | 224,385(0.03%)#503 |
| 29. | East Northport | 78 | 32,328(0.24%)#29 | 224,385(0.03%)#505 |
| 30. | Irondequoit | 77 | 32,328(0.24%)#30 | 224,385(0.03%)#517 |
| 31. | Peekskill | 74 | 32,328(0.23%)#31 | 224,385(0.03%)#539 |
| 32. | Schenectady | 72 | 32,328(0.22%)#32 | 224,385(0.03%)#554 |
| 33. | West Babylon | 72 | 32,328(0.22%)#33 | 224,385(0.03%)#556 |
| 34. | Uniondale | 72 | 32,328(0.22%)#34 | 224,385(0.03%)#558 |
| 35. | Port Jervis | 68 | 32,328(0.21%)#35 | 224,385(0.03%)#587 |
| 36. | Canandaigua | 61 | 32,328(0.19%)#36 | 224,385(0.03%)#650 |
| 37. | St James | 60 | 32,328(0.19%)#37 | 224,385(0.03%)#658 |
| 38. | Commack | 59 | 32,328(0.18%)#38 | 224,385(0.03%)#665 |
| 39. | New Cassel | 59 | 32,328(0.18%)#39 | 224,385(0.03%)#668 |
| 40. | Lake Mohegan | 55 | 32,328(0.17%)#40 | 224,385(0.02%)#706 |
| 41. | North Bay Shore | 54 | 32,328(0.17%)#41 | 224,385(0.02%)#713 |
| 42. | Mountain Lodge Park | 54 | 32,328(0.17%)#42 | 224,385(0.02%)#717 |
| 43. | Shirley | 49 | 32,328(0.15%)#43 | 224,385(0.02%)#787 |
| 44. | Lancaster | 45 | 32,328(0.14%)#44 | 224,385(0.02%)#838 |
| 45. | Binghamton | 42 | 32,328(0.13%)#45 | 224,385(0.02%)#873 |
| 46. | Holbrook | 41 | 32,328(0.13%)#46 | 224,385(0.02%)#891 |
| 47. | Buffalo | 40 | 32,328(0.12%)#47 | 224,385(0.02%)#898 |
| 48. | Milton Cdp Saratoga County | 40 | 32,328(0.12%)#48 | 224,385(0.02%)#909 |
| 49. | Hankins | 40 | 32,328(0.12%)#49 | 224,385(0.02%)#910 |
| 50. | Malverne | 38 | 32,328(0.12%)#50 | 224,385(0.02%)#939 |
| 51. | Oceanside | 37 | 32,328(0.11%)#51 | 224,385(0.02%)#958 |
| 52. | Ronkonkoma | 37 | 32,328(0.11%)#52 | 224,385(0.02%)#960 |
| 53. | Newark | 37 | 32,328(0.11%)#53 | 224,385(0.02%)#967 |
| 54. | New Rochelle | 36 | 32,328(0.11%)#54 | 224,385(0.02%)#973 |
| 55. | East Patchogue | 36 | 32,328(0.11%)#55 | 224,385(0.02%)#980 |
| 56. | East Hills | 36 | 32,328(0.11%)#56 | 224,385(0.02%)#988 |
| 57. | Carthage | 34 | 32,328(0.11%)#57 | 224,385(0.02%)#1,030 |
| 58. | Niagara Falls | 33 | 32,328(0.10%)#58 | 224,385(0.01%)#1,038 |
| 59. | Harrison | 33 | 32,328(0.10%)#59 | 224,385(0.01%)#1,042 |
| 60. | Plattsburgh | 33 | 32,328(0.10%)#60 | 224,385(0.01%)#1,045 |
| 61. | Beacon | 31 | 32,328(0.10%)#61 | 224,385(0.01%)#1,086 |
| 62. | Middletown | 29 | 32,328(0.09%)#62 | 224,385(0.01%)#1,130 |
| 63. | Orange Lake | 29 | 32,328(0.09%)#63 | 224,385(0.01%)#1,139 |
| 64. | Goshen | 29 | 32,328(0.09%)#64 | 224,385(0.01%)#1,145 |
| 65. | Springs | 27 | 32,328(0.08%)#65 | 224,385(0.01%)#1,193 |
| 66. | Mastic | 26 | 32,328(0.08%)#66 | 224,385(0.01%)#1,216 |
| 67. | North Patchogue | 25 | 32,328(0.08%)#67 | 224,385(0.01%)#1,250 |
| 68. | Pawling | 25 | 32,328(0.08%)#68 | 224,385(0.01%)#1,254 |
| 69. | Spring Valley | 24 | 32,328(0.07%)#69 | 224,385(0.01%)#1,267 |
| 70. | Searingtown | 24 | 32,328(0.07%)#70 | 224,385(0.01%)#1,281 |
| 71. | North Valley Stream | 23 | 32,328(0.07%)#71 | 224,385(0.01%)#1,305 |
| 72. | Gouverneur | 23 | 32,328(0.07%)#72 | 224,385(0.01%)#1,314 |
| 73. | West Hempstead | 22 | 32,328(0.07%)#73 | 224,385(0.01%)#1,326 |
| 74. | Islip | 22 | 32,328(0.07%)#74 | 224,385(0.01%)#1,328 |
| 75. | Franklin Square | 21 | 32,328(0.06%)#75 | 224,385(0.01%)#1,347 |
| 76. | West Point | 21 | 32,328(0.06%)#76 | 224,385(0.01%)#1,360 |
| 77. | Glen Cove | 20 | 32,328(0.06%)#77 | 224,385(0.01%)#1,376 |
| 78. | Geneseo | 20 | 32,328(0.06%)#78 | 224,385(0.01%)#1,389 |
| 79. | Mount Sinai | 19 | 32,328(0.06%)#79 | 224,385(0.01%)#1,405 |
| 80. | Coram | 18 | 32,328(0.06%)#80 | 224,385(0.01%)#1,430 |
| 81. | Deer Park | 18 | 32,328(0.06%)#81 | 224,385(0.01%)#1,440 |
| 82. | Orchard Park | 18 | 32,328(0.06%)#82 | 224,385(0.01%)#1,462 |
| 83. | Medford | 17 | 32,328(0.05%)#83 | 224,385(0.01%)#1,480 |
| 84. | Niskayuna | 17 | 32,328(0.05%)#84 | 224,385(0.01%)#1,482 |
| 85. | Roessleville | 17 | 32,328(0.05%)#85 | 224,385(0.01%)#1,492 |
| 86. | Brentwood | 16 | 32,328(0.05%)#86 | 224,385(0.01%)#1,514 |
| 87. | South Floral Park | 16 | 32,328(0.05%)#87 | 224,385(0.01%)#1,539 |
| 88. | Centereach | 15 | 32,328(0.05%)#88 | 224,385(0.01%)#1,551 |
| 89. | Kingston | 15 | 32,328(0.05%)#89 | 224,385(0.01%)#1,554 |
| 90. | Suny Oswego | 15 | 32,328(0.05%)#90 | 224,385(0.01%)#1,578 |
| 91. | Roosevelt | 14 | 32,328(0.04%)#91 | 224,385(0.01%)#1,609 |
| 92. | Westbury | 14 | 32,328(0.04%)#92 | 224,385(0.01%)#1,611 |
| 93. | East Massapequa | 13 | 32,328(0.04%)#93 | 224,385(0.01%)#1,637 |
| 94. | West Elmira | 13 | 32,328(0.04%)#94 | 224,385(0.01%)#1,657 |
| 95. | Valley Stream | 12 | 32,328(0.04%)#95 | 224,385(0.01%)#1,680 |
| 96. | Glens Falls | 11 | 32,328(0.03%)#96 | 224,385(0.00%)#1,749 |
| 97. | Chestnut Ridge | 10 | 32,328(0.03%)#97 | 224,385(0.00%)#1,816 |
| 98. | Stony Brook University | 10 | 32,328(0.03%)#98 | 224,385(0.00%)#1,817 |
| 99. | North Babylon | 9 | 32,328(0.03%)#99 | 224,385(0.00%)#1,855 |
| 100. | Parc | 9 | 32,328(0.03%)#100 | 224,385(0.00%)#1,893 |
Common Questions
What are the Top 10 Cities with the Largest Panamanian Community in New York?
Top 10 Cities with the Largest Panamanian Community in New York are:
#1
22,558
#2
925
#3
388
#4
334
#5
320
#6
261
#7
260
#8
241
#9
235
#10
211
What city has the Largest Panamanian Community in New York?
New York has the Largest Panamanian Community in New York with 22,558.
What is the Total Panamanian Population in the State of New York?
Total Panamanian Population in New York is 32,328.
What is the Total Panamanian Population in the United States?
Total Panamanian Population in the United States is 224,385.