Zip Codes with the Highest Percentage of Population Employed in Food Preparation & Serving in Rochester, NY
RELATED REPORTS & OPTIONS
Food Preparation & Serving
Rochester
Compare Zip Codes
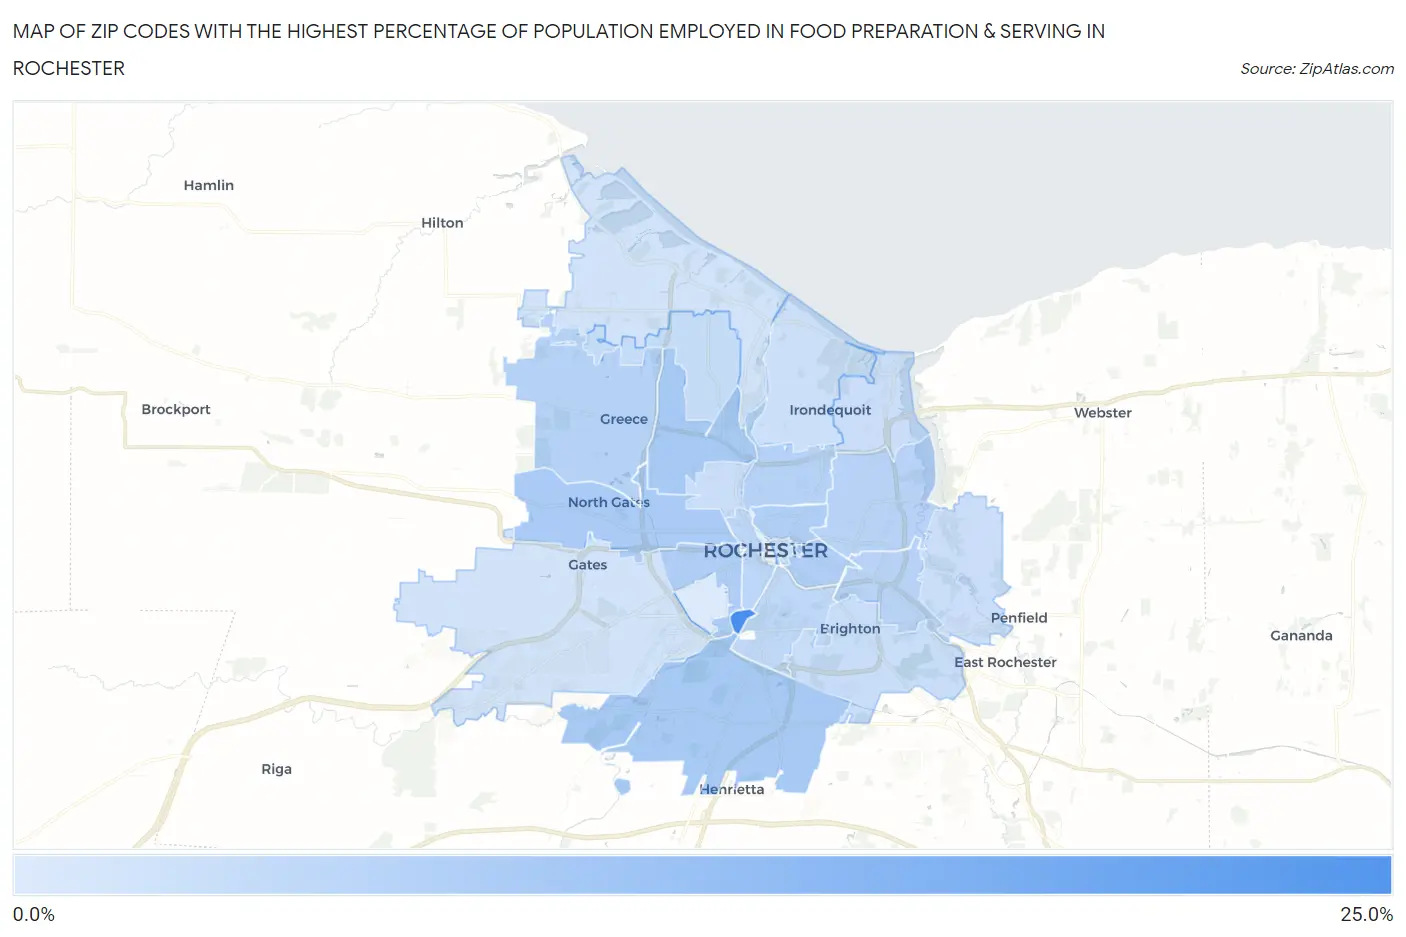
Map of Zip Codes with the Highest Percentage of Population Employed in Food Preparation & Serving in Rochester
2.1%
20.4%
Zip Codes with the Highest Percentage of Population Employed in Food Preparation & Serving in Rochester, NY
| Zip Code | % Employed | vs State | vs National | |
| 1. | 14627 | 20.4% | 4.8%(+15.6)#25 | 5.3%(+15.1)#482 |
| 2. | 14623 | 8.3% | 4.8%(+3.46)#221 | 5.3%(+2.99)#4,339 |
| 3. | 14615 | 8.1% | 4.8%(+3.31)#228 | 5.3%(+2.84)#4,547 |
| 4. | 14606 | 7.8% | 4.8%(+2.97)#249 | 5.3%(+2.50)#5,077 |
| 5. | 14611 | 7.4% | 4.8%(+2.61)#284 | 5.3%(+2.14)#5,693 |
| 6. | 14607 | 7.4% | 4.8%(+2.59)#288 | 5.3%(+2.12)#5,728 |
| 7. | 14605 | 7.2% | 4.8%(+2.35)#312 | 5.3%(+1.88)#6,196 |
| 8. | 14626 | 6.7% | 4.8%(+1.86)#363 | 5.3%(+1.39)#7,393 |
| 9. | 14621 | 6.6% | 4.8%(+1.83)#365 | 5.3%(+1.36)#7,486 |
| 10. | 14610 | 6.3% | 4.8%(+1.49)#417 | 5.3%(+1.02)#8,426 |
| 11. | 14609 | 6.3% | 4.8%(+1.45)#423 | 5.3%(+0.984)#8,511 |
| 12. | 14608 | 5.8% | 4.8%(+0.958)#493 | 5.3%(+0.487)#10,109 |
| 13. | 14620 | 5.6% | 4.8%(+0.770)#525 | 5.3%(+0.299)#10,759 |
| 14. | 14616 | 4.6% | 4.8%(-0.204)#703 | 5.3%(-0.674)#14,543 |
| 15. | 14618 | 4.5% | 4.8%(-0.363)#748 | 5.3%(-0.833)#15,193 |
| 16. | 14613 | 4.2% | 4.8%(-0.585)#808 | 5.3%(-1.05)#16,185 |
| 17. | 14604 | 4.1% | 4.8%(-0.726)#836 | 5.3%(-1.20)#16,752 |
| 18. | 14625 | 4.0% | 4.8%(-0.775)#848 | 5.3%(-1.25)#16,967 |
| 19. | 14622 | 4.0% | 4.8%(-0.787)#853 | 5.3%(-1.26)#17,011 |
| 20. | 14617 | 3.8% | 4.8%(-0.970)#890 | 5.3%(-1.44)#17,762 |
| 21. | 14624 | 3.3% | 4.8%(-1.47)#1,013 | 5.3%(-1.94)#19,871 |
| 22. | 14612 | 3.3% | 4.8%(-1.54)#1,028 | 5.3%(-2.01)#20,189 |
| 23. | 14619 | 2.1% | 4.8%(-2.76)#1,309 | 5.3%(-3.23)#24,535 |
1
Common Questions
What are the Top 10 Zip Codes with the Highest Percentage of Population Employed in Food Preparation & Serving in Rochester, NY?
Top 10 Zip Codes with the Highest Percentage of Population Employed in Food Preparation & Serving in Rochester, NY are:
What zip code has the Highest Percentage of Population Employed in Food Preparation & Serving in Rochester, NY?
14627 has the Highest Percentage of Population Employed in Food Preparation & Serving in Rochester, NY with 20.4%.
What is the Percentage of Population Employed in Food Preparation & Serving in Rochester, NY?
Percentage of Population Employed in Food Preparation & Serving in Rochester is 6.3%.
What is the Percentage of Population Employed in Food Preparation & Serving in New York?
Percentage of Population Employed in Food Preparation & Serving in New York is 4.8%.
What is the Percentage of Population Employed in Food Preparation & Serving in the United States?
Percentage of Population Employed in Food Preparation & Serving in the United States is 5.3%.