Zip Codes with the Highest Percentage of Population Employed in Food Preparation & Serving in Poughkeepsie, NY
RELATED REPORTS & OPTIONS
Food Preparation & Serving
Poughkeepsie
Compare Zip Codes
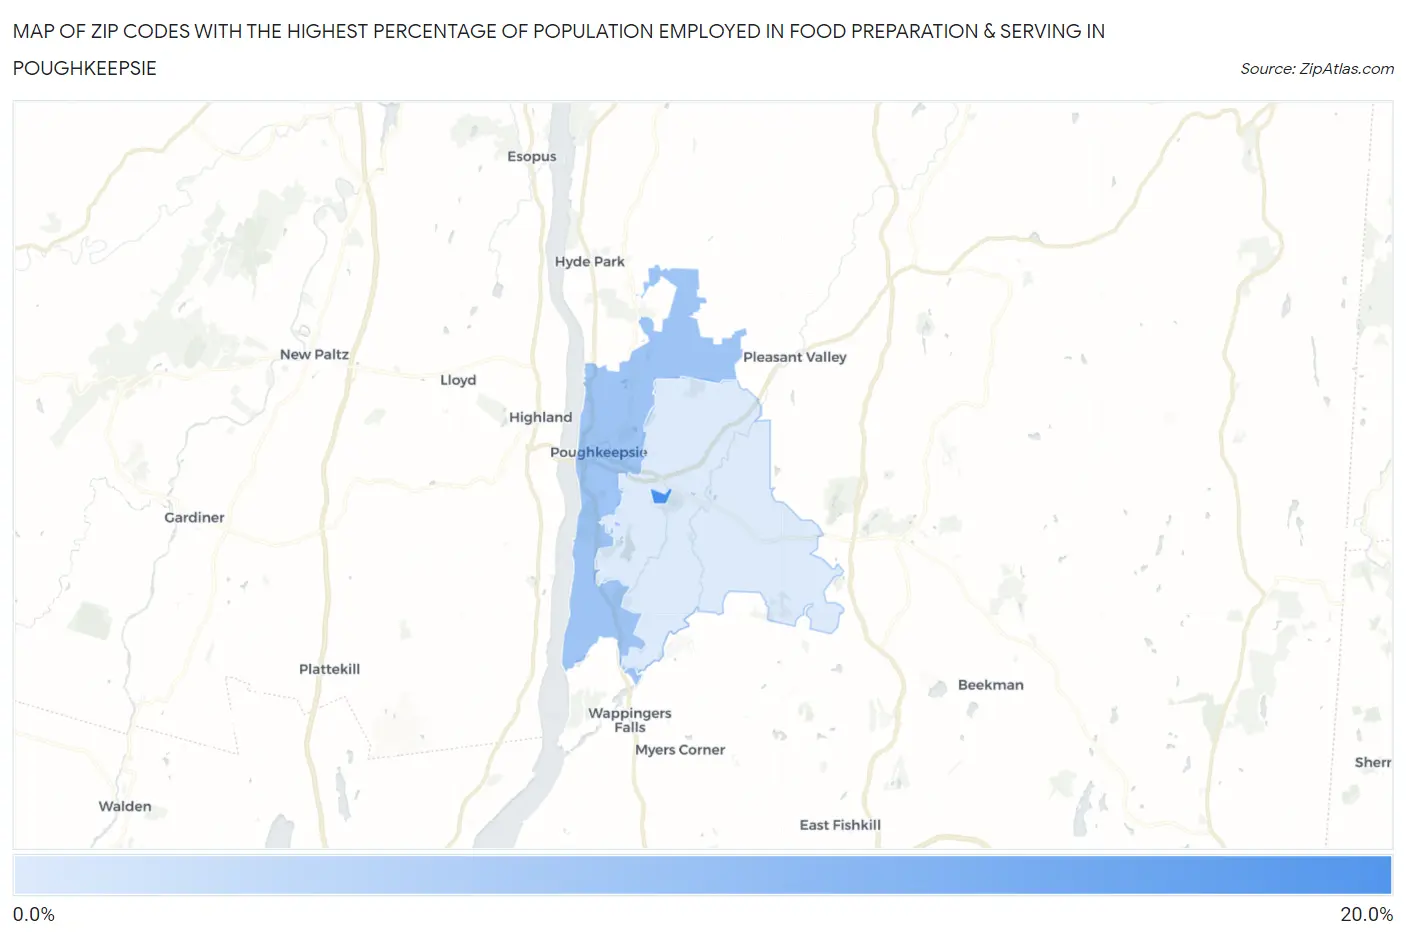
Map of Zip Codes with the Highest Percentage of Population Employed in Food Preparation & Serving in Poughkeepsie
4.2%
15.5%
Zip Codes with the Highest Percentage of Population Employed in Food Preparation & Serving in Poughkeepsie, NY
| Zip Code | % Employed | vs State | vs National | |
| 1. | 12604 | 15.5% | 4.8%(+10.7)#45 | 5.3%(+10.2)#913 |
| 2. | 12601 | 8.7% | 4.8%(+3.92)#189 | 5.3%(+3.45)#3,796 |
| 3. | 12603 | 4.2% | 4.8%(-0.654)#819 | 5.3%(-1.12)#16,461 |
1
Common Questions
What are the Top Zip Codes with the Highest Percentage of Population Employed in Food Preparation & Serving in Poughkeepsie, NY?
Top Zip Codes with the Highest Percentage of Population Employed in Food Preparation & Serving in Poughkeepsie, NY are:
What zip code has the Highest Percentage of Population Employed in Food Preparation & Serving in Poughkeepsie, NY?
12604 has the Highest Percentage of Population Employed in Food Preparation & Serving in Poughkeepsie, NY with 15.5%.
What is the Percentage of Population Employed in Food Preparation & Serving in Poughkeepsie, NY?
Percentage of Population Employed in Food Preparation & Serving in Poughkeepsie is 9.2%.
What is the Percentage of Population Employed in Food Preparation & Serving in New York?
Percentage of Population Employed in Food Preparation & Serving in New York is 4.8%.
What is the Percentage of Population Employed in Food Preparation & Serving in the United States?
Percentage of Population Employed in Food Preparation & Serving in the United States is 5.3%.