Cities with the Highest Percentage of Argentinean Population in New York
RELATED REPORTS & OPTIONS
Argentinean
New York
Compare Cities
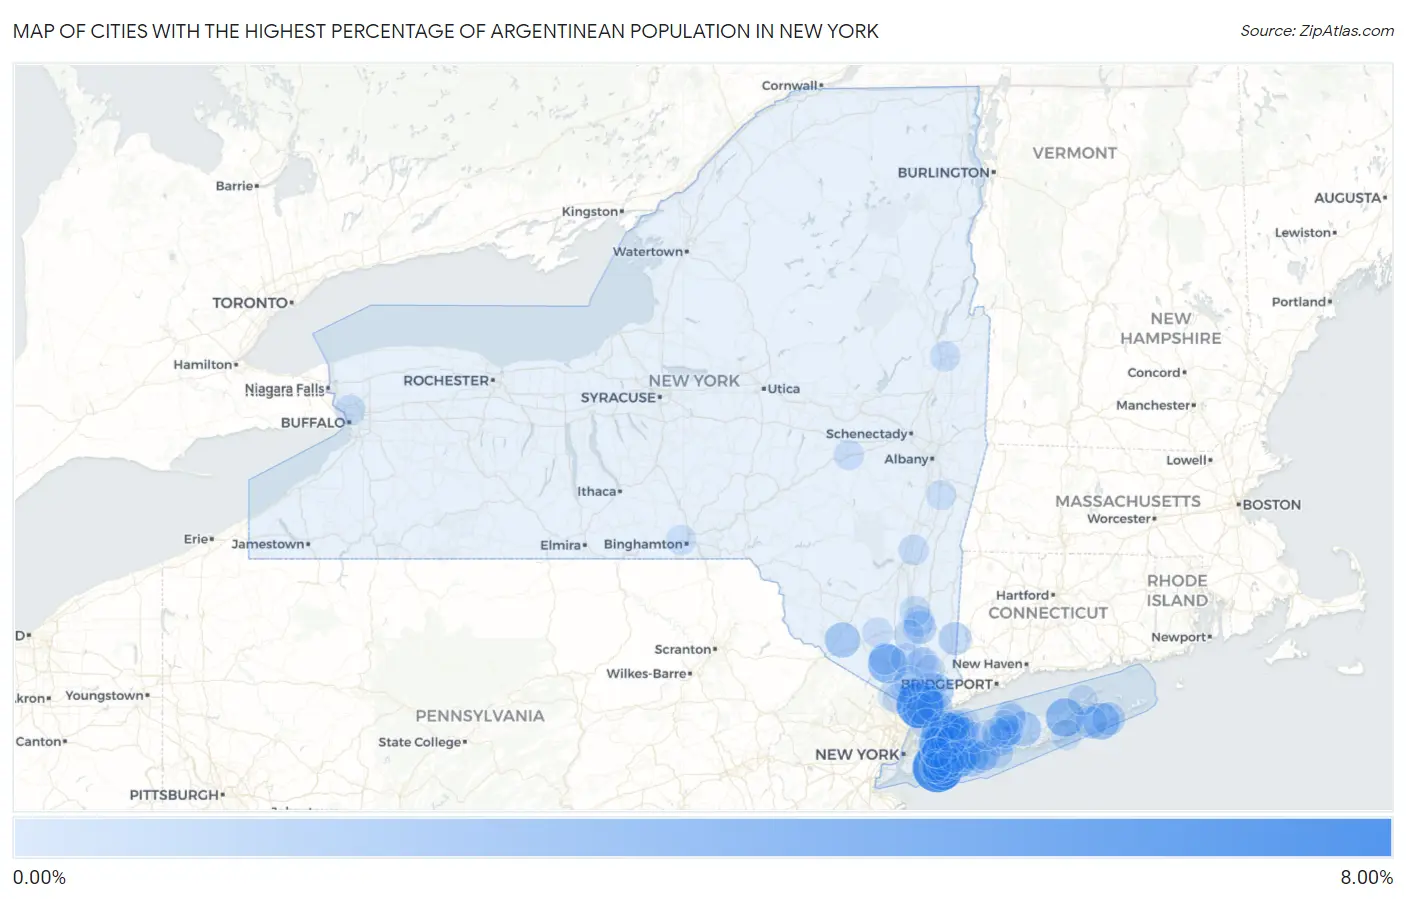
Map of Cities with the Highest Percentage of Argentinean Population in New York
0.00%
8.00%
Cities with the Highest Percentage of Argentinean Population in New York
| City | Argentinean | vs State | vs National | |
| 1. | Woodsburgh | 7.33% | 0.16%(+7.17)#1 | 0.092%(+7.24)#6 |
| 2. | Irvington | 6.18% | 0.16%(+6.02)#2 | 0.092%(+6.08)#13 |
| 3. | Glen Head | 4.52% | 0.16%(+4.36)#3 | 0.092%(+4.43)#23 |
| 4. | Harbor Isle | 4.04% | 0.16%(+3.89)#4 | 0.092%(+3.95)#35 |
| 5. | Harriman | 3.45% | 0.16%(+3.29)#5 | 0.092%(+3.36)#44 |
| 6. | Jamesport | 3.18% | 0.16%(+3.02)#6 | 0.092%(+3.09)#51 |
| 7. | Sagaponack | 2.62% | 0.16%(+2.46)#7 | 0.092%(+2.52)#64 |
| 8. | East Norwich | 2.33% | 0.16%(+2.18)#8 | 0.092%(+2.24)#79 |
| 9. | Port Washington North | 2.21% | 0.16%(+2.05)#9 | 0.092%(+2.12)#86 |
| 10. | New Hyde Park | 2.20% | 0.16%(+2.04)#10 | 0.092%(+2.11)#88 |
| 11. | North Hills | 2.18% | 0.16%(+2.02)#11 | 0.092%(+2.08)#90 |
| 12. | Bellerose Terrace | 2.11% | 0.16%(+1.95)#12 | 0.092%(+2.02)#96 |
| 13. | Otisville | 2.10% | 0.16%(+1.94)#13 | 0.092%(+2.00)#98 |
| 14. | Armonk | 2.06% | 0.16%(+1.90)#14 | 0.092%(+1.96)#102 |
| 15. | Malverne Park Oaks | 2.05% | 0.16%(+1.89)#15 | 0.092%(+1.96)#103 |
| 16. | Middle Island | 1.90% | 0.16%(+1.74)#16 | 0.092%(+1.81)#113 |
| 17. | Amityville | 1.46% | 0.16%(+1.30)#17 | 0.092%(+1.37)#146 |
| 18. | Putnam Lake | 1.33% | 0.16%(+1.18)#18 | 0.092%(+1.24)#169 |
| 19. | East Hampton | 1.26% | 0.16%(+1.10)#19 | 0.092%(+1.17)#181 |
| 20. | Brinckerhoff | 1.23% | 0.16%(+1.07)#20 | 0.092%(+1.14)#189 |
| 21. | Harrison | 1.17% | 0.16%(+1.01)#21 | 0.092%(+1.08)#206 |
| 22. | Upper Nyack | 1.17% | 0.16%(+1.01)#22 | 0.092%(+1.08)#208 |
| 23. | Matinecock | 1.12% | 0.16%(+0.959)#23 | 0.092%(+1.02)#214 |
| 24. | Island Park | 1.11% | 0.16%(+0.954)#24 | 0.092%(+1.02)#216 |
| 25. | Islandia | 1.09% | 0.16%(+0.935)#25 | 0.092%(+1.00)#222 |
| 26. | Lake Ronkonkoma | 1.07% | 0.16%(+0.916)#26 | 0.092%(+0.982)#228 |
| 27. | Dobbs Ferry | 1.07% | 0.16%(+0.909)#27 | 0.092%(+0.975)#231 |
| 28. | Plainedge | 1.06% | 0.16%(+0.902)#28 | 0.092%(+0.968)#234 |
| 29. | Water Mill | 1.04% | 0.16%(+0.882)#29 | 0.092%(+0.948)#241 |
| 30. | Bellmore | 1.02% | 0.16%(+0.859)#30 | 0.092%(+0.924)#249 |
| 31. | Kiryas Joel | 1.00% | 0.16%(+0.840)#31 | 0.092%(+0.906)#255 |
| 32. | Roslyn Heights | 1.00% | 0.16%(+0.840)#32 | 0.092%(+0.906)#256 |
| 33. | Tioga Terrace | 0.98% | 0.16%(+0.822)#33 | 0.092%(+0.888)#266 |
| 34. | Franklin Square | 0.94% | 0.16%(+0.787)#34 | 0.092%(+0.853)#273 |
| 35. | North Wantagh | 0.94% | 0.16%(+0.786)#35 | 0.092%(+0.852)#275 |
| 36. | Hewlett Neck | 0.94% | 0.16%(+0.778)#36 | 0.092%(+0.844)#278 |
| 37. | Hastings On Hudson | 0.88% | 0.16%(+0.717)#37 | 0.092%(+0.783)#296 |
| 38. | Ardsley | 0.84% | 0.16%(+0.680)#38 | 0.092%(+0.746)#300 |
| 39. | South Farmingdale | 0.82% | 0.16%(+0.661)#39 | 0.092%(+0.726)#306 |
| 40. | Fairview Cdp Dutchess County | 0.81% | 0.16%(+0.648)#40 | 0.092%(+0.714)#310 |
| 41. | Locust Valley | 0.80% | 0.16%(+0.645)#41 | 0.092%(+0.711)#311 |
| 42. | Malverne | 0.80% | 0.16%(+0.640)#42 | 0.092%(+0.706)#315 |
| 43. | Munsey Park | 0.75% | 0.16%(+0.594)#43 | 0.092%(+0.660)#344 |
| 44. | East Islip | 0.74% | 0.16%(+0.586)#44 | 0.092%(+0.652)#350 |
| 45. | North Massapequa | 0.74% | 0.16%(+0.584)#45 | 0.092%(+0.650)#351 |
| 46. | Sands Point | 0.74% | 0.16%(+0.582)#46 | 0.092%(+0.648)#355 |
| 47. | North Lindenhurst | 0.71% | 0.16%(+0.550)#47 | 0.092%(+0.616)#376 |
| 48. | Myers Corner | 0.70% | 0.16%(+0.546)#48 | 0.092%(+0.612)#379 |
| 49. | Lake Grove | 0.66% | 0.16%(+0.502)#49 | 0.092%(+0.568)#406 |
| 50. | Babylon | 0.65% | 0.16%(+0.491)#50 | 0.092%(+0.556)#415 |
| 51. | Russell Gardens | 0.64% | 0.16%(+0.479)#51 | 0.092%(+0.544)#424 |
| 52. | Floral Park | 0.62% | 0.16%(+0.465)#52 | 0.092%(+0.531)#434 |
| 53. | Seaford | 0.62% | 0.16%(+0.460)#53 | 0.092%(+0.526)#436 |
| 54. | Belle Terre | 0.62% | 0.16%(+0.459)#54 | 0.092%(+0.525)#437 |
| 55. | East Hills | 0.61% | 0.16%(+0.450)#55 | 0.092%(+0.516)#445 |
| 56. | Spackenkill | 0.60% | 0.16%(+0.442)#56 | 0.092%(+0.508)#449 |
| 57. | White Plains | 0.57% | 0.16%(+0.416)#57 | 0.092%(+0.482)#468 |
| 58. | Fort Montgomery | 0.57% | 0.16%(+0.413)#58 | 0.092%(+0.479)#470 |
| 59. | Lloyd Harbor | 0.56% | 0.16%(+0.402)#59 | 0.092%(+0.468)#480 |
| 60. | Centre Island | 0.55% | 0.16%(+0.395)#60 | 0.092%(+0.460)#490 |
| 61. | Garden City South | 0.53% | 0.16%(+0.377)#61 | 0.092%(+0.443)#501 |
| 62. | East Quogue | 0.53% | 0.16%(+0.376)#62 | 0.092%(+0.442)#504 |
| 63. | Beacon | 0.53% | 0.16%(+0.375)#63 | 0.092%(+0.441)#506 |
| 64. | New City | 0.52% | 0.16%(+0.362)#64 | 0.092%(+0.428)#521 |
| 65. | West Islip | 0.50% | 0.16%(+0.342)#65 | 0.092%(+0.408)#543 |
| 66. | Shrub Oak | 0.50% | 0.16%(+0.342)#66 | 0.092%(+0.408)#544 |
| 67. | Tivoli | 0.50% | 0.16%(+0.341)#67 | 0.092%(+0.407)#547 |
| 68. | Port Washington | 0.48% | 0.16%(+0.324)#68 | 0.092%(+0.390)#569 |
| 69. | Kenmore | 0.48% | 0.16%(+0.317)#69 | 0.092%(+0.383)#575 |
| 70. | South Huntington | 0.46% | 0.16%(+0.298)#70 | 0.092%(+0.364)#597 |
| 71. | Glens Falls | 0.45% | 0.16%(+0.297)#71 | 0.092%(+0.362)#600 |
| 72. | Montgomery | 0.45% | 0.16%(+0.290)#72 | 0.092%(+0.356)#607 |
| 73. | Glen Cove | 0.44% | 0.16%(+0.287)#73 | 0.092%(+0.352)#609 |
| 74. | Great Neck Estates | 0.44% | 0.16%(+0.285)#74 | 0.092%(+0.351)#611 |
| 75. | Woodmere | 0.44% | 0.16%(+0.285)#75 | 0.092%(+0.350)#614 |
| 76. | Laurel Hollow | 0.44% | 0.16%(+0.281)#76 | 0.092%(+0.347)#618 |
| 77. | Port Jefferson | 0.44% | 0.16%(+0.280)#77 | 0.092%(+0.346)#624 |
| 78. | Cobleskill | 0.43% | 0.16%(+0.276)#78 | 0.092%(+0.342)#631 |
| 79. | Old Westbury | 0.43% | 0.16%(+0.273)#79 | 0.092%(+0.339)#640 |
| 80. | Centereach | 0.43% | 0.16%(+0.272)#80 | 0.092%(+0.338)#644 |
| 81. | Lake Mohegan | 0.40% | 0.16%(+0.246)#81 | 0.092%(+0.312)#680 |
| 82. | Pelham | 0.39% | 0.16%(+0.228)#82 | 0.092%(+0.294)#712 |
| 83. | Southold | 0.38% | 0.16%(+0.218)#83 | 0.092%(+0.284)#727 |
| 84. | Yorktown Heights | 0.37% | 0.16%(+0.215)#84 | 0.092%(+0.281)#730 |
| 85. | Commack | 0.37% | 0.16%(+0.214)#85 | 0.092%(+0.280)#732 |
| 86. | Brookville | 0.37% | 0.16%(+0.210)#86 | 0.092%(+0.276)#736 |
| 87. | Oceanside | 0.36% | 0.16%(+0.201)#87 | 0.092%(+0.267)#745 |
| 88. | Chappaqua | 0.36% | 0.16%(+0.198)#88 | 0.092%(+0.264)#752 |
| 89. | Baldwin | 0.34% | 0.16%(+0.186)#89 | 0.092%(+0.251)#768 |
| 90. | Cedarhurst | 0.34% | 0.16%(+0.184)#90 | 0.092%(+0.250)#771 |
| 91. | Johnson City | 0.34% | 0.16%(+0.184)#91 | 0.092%(+0.249)#773 |
| 92. | Airmont | 0.34% | 0.16%(+0.182)#92 | 0.092%(+0.247)#783 |
| 93. | Haverstraw | 0.33% | 0.16%(+0.176)#93 | 0.092%(+0.242)#796 |
| 94. | Stony Brook | 0.32% | 0.16%(+0.162)#94 | 0.092%(+0.228)#823 |
| 95. | North Merrick | 0.31% | 0.16%(+0.154)#95 | 0.092%(+0.220)#843 |
| 96. | Chestnut Ridge | 0.31% | 0.16%(+0.152)#96 | 0.092%(+0.217)#850 |
| 97. | Bellerose | 0.30% | 0.16%(+0.143)#97 | 0.092%(+0.208)#870 |
| 98. | Valatie | 0.30% | 0.16%(+0.142)#98 | 0.092%(+0.208)#871 |
| 99. | Bayville | 0.30% | 0.16%(+0.138)#99 | 0.092%(+0.204)#877 |
| 100. | Village Of The Branch | 0.29% | 0.16%(+0.128)#100 | 0.092%(+0.194)#898 |
Common Questions
What are the Top 10 Cities with the Highest Percentage of Argentinean Population in New York?
Top 10 Cities with the Highest Percentage of Argentinean Population in New York are:
#1
7.33%
#2
6.18%
#3
4.52%
#4
4.04%
#5
3.45%
#6
3.18%
#7
2.62%
#8
2.33%
#9
2.21%
#10
2.20%
What city has the Highest Percentage of Argentinean Population in New York?
Woodsburgh has the Highest Percentage of Argentinean Population in New York with 7.33%.
What is the Percentage of Argentinean Population in the State of New York?
Percentage of Argentinean Population in New York is 0.16%.
What is the Percentage of Argentinean Population in the United States?
Percentage of Argentinean Population in the United States is 0.092%.