Zip Codes with the Highest Percentage of Population Employed in Food Preparation & Serving in Binghamton, NY
RELATED REPORTS & OPTIONS
Food Preparation & Serving
Binghamton
Compare Zip Codes
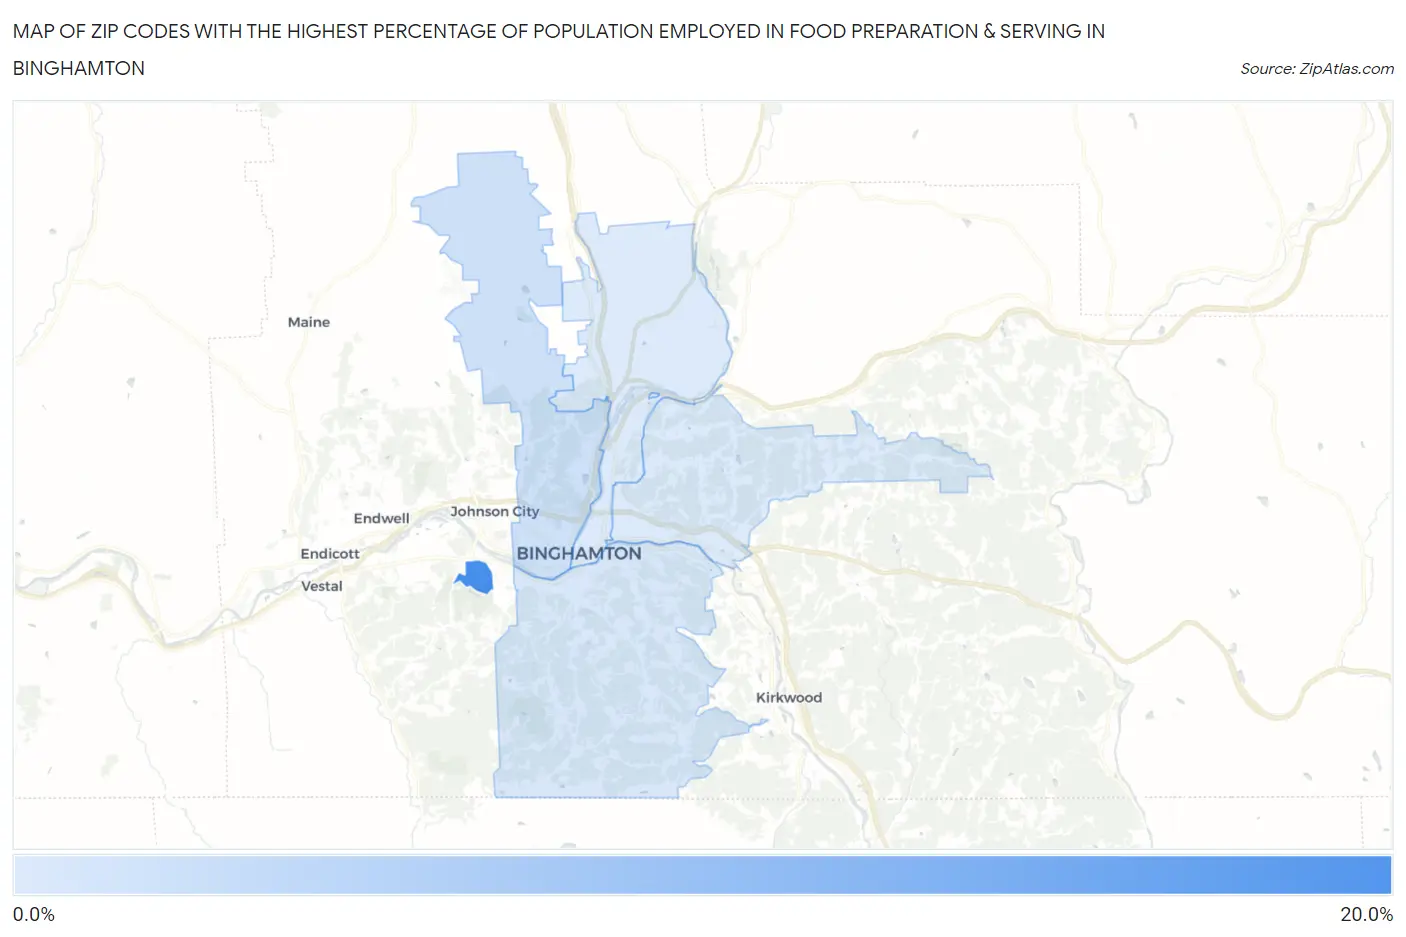
Map of Zip Codes with the Highest Percentage of Population Employed in Food Preparation & Serving in Binghamton
6.9%
16.8%
Zip Codes with the Highest Percentage of Population Employed in Food Preparation & Serving in Binghamton, NY
| Zip Code | % Employed | vs State | vs National | |
| 1. | 13902 | 16.8% | 4.8%(+12.0)#39 | 5.3%(+11.5)#765 |
| 2. | 13905 | 7.8% | 4.8%(+2.96)#252 | 5.3%(+2.49)#5,099 |
| 3. | 13903 | 7.1% | 4.8%(+2.33)#315 | 5.3%(+1.86)#6,233 |
| 4. | 13904 | 6.9% | 4.8%(+2.08)#338 | 5.3%(+1.61)#6,846 |
| 5. | 13901 | 6.9% | 4.8%(+2.04)#344 | 5.3%(+1.57)#6,924 |
1
Common Questions
What are the Top 3 Zip Codes with the Highest Percentage of Population Employed in Food Preparation & Serving in Binghamton, NY?
Top 3 Zip Codes with the Highest Percentage of Population Employed in Food Preparation & Serving in Binghamton, NY are:
What zip code has the Highest Percentage of Population Employed in Food Preparation & Serving in Binghamton, NY?
13902 has the Highest Percentage of Population Employed in Food Preparation & Serving in Binghamton, NY with 16.8%.
What is the Percentage of Population Employed in Food Preparation & Serving in Binghamton, NY?
Percentage of Population Employed in Food Preparation & Serving in Binghamton is 9.1%.
What is the Percentage of Population Employed in Food Preparation & Serving in New York?
Percentage of Population Employed in Food Preparation & Serving in New York is 4.8%.
What is the Percentage of Population Employed in Food Preparation & Serving in the United States?
Percentage of Population Employed in Food Preparation & Serving in the United States is 5.3%.