Cities with the Largest Haitian Community in New York
RELATED REPORTS & OPTIONS
Haitian
New York
Compare Cities
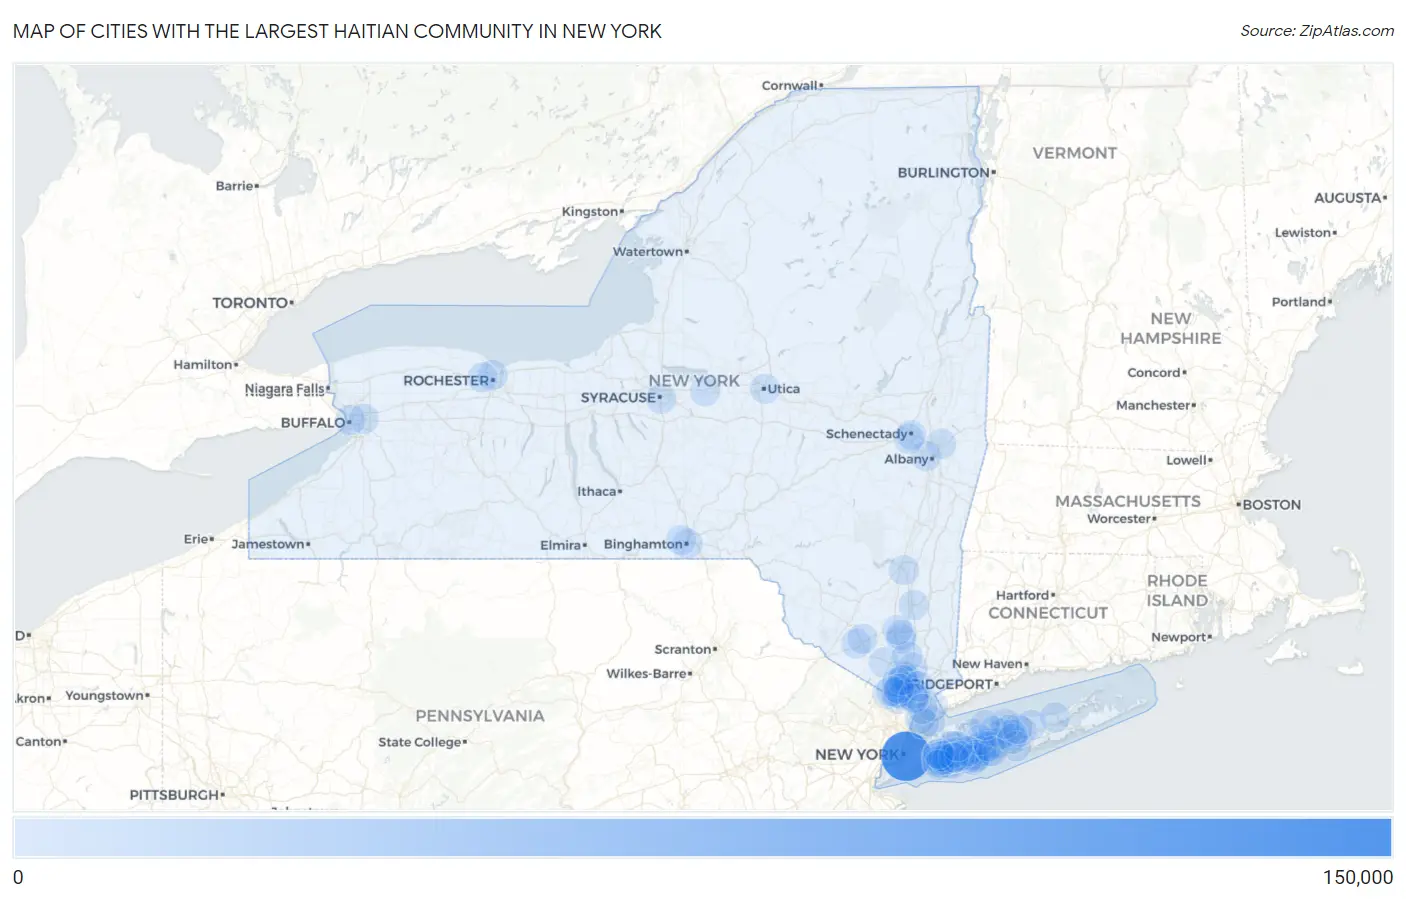
Map of Cities with the Largest Haitian Community in New York
0
150,000
Cities with the Largest Haitian Community in New York
| City | Haitian | vs State | vs National | |
| 1. | New York | 118,674 | 184,438(64.34%)#1 | 1,060,713(11.19%)#1 |
| 2. | Spring Valley | 5,914 | 184,438(3.21%)#2 | 1,060,713(0.56%)#30 |
| 3. | Elmont | 4,902 | 184,438(2.66%)#3 | 1,060,713(0.46%)#33 |
| 4. | Hempstead | 2,576 | 184,438(1.40%)#4 | 1,060,713(0.24%)#59 |
| 5. | Baldwin | 2,534 | 184,438(1.37%)#5 | 1,060,713(0.24%)#62 |
| 6. | North Valley Stream | 2,234 | 184,438(1.21%)#6 | 1,060,713(0.21%)#66 |
| 7. | Freeport | 1,777 | 184,438(0.96%)#7 | 1,060,713(0.17%)#76 |
| 8. | Brentwood | 1,321 | 184,438(0.72%)#8 | 1,060,713(0.12%)#99 |
| 9. | Valley Stream | 1,277 | 184,438(0.69%)#9 | 1,060,713(0.12%)#101 |
| 10. | New Cassel | 1,232 | 184,438(0.67%)#10 | 1,060,713(0.12%)#105 |
| 11. | Rochester | 1,099 | 184,438(0.60%)#11 | 1,060,713(0.10%)#113 |
| 12. | New Rochelle | 1,082 | 184,438(0.59%)#12 | 1,060,713(0.10%)#117 |
| 13. | Uniondale | 1,075 | 184,438(0.58%)#13 | 1,060,713(0.10%)#118 |
| 14. | Binghamton | 1,009 | 184,438(0.55%)#14 | 1,060,713(0.10%)#127 |
| 15. | Deer Park | 984 | 184,438(0.53%)#15 | 1,060,713(0.09%)#129 |
| 16. | Yonkers | 966 | 184,438(0.52%)#16 | 1,060,713(0.09%)#131 |
| 17. | North Amityville | 921 | 184,438(0.50%)#17 | 1,060,713(0.09%)#135 |
| 18. | Central Islip | 918 | 184,438(0.50%)#18 | 1,060,713(0.09%)#137 |
| 19. | White Plains | 902 | 184,438(0.49%)#19 | 1,060,713(0.09%)#139 |
| 20. | Wyandanch | 826 | 184,438(0.45%)#20 | 1,060,713(0.08%)#151 |
| 21. | Mount Vernon | 741 | 184,438(0.40%)#21 | 1,060,713(0.07%)#165 |
| 22. | North Babylon | 729 | 184,438(0.40%)#22 | 1,060,713(0.07%)#168 |
| 23. | Huntington Station | 690 | 184,438(0.37%)#23 | 1,060,713(0.07%)#178 |
| 24. | Suffern | 684 | 184,438(0.37%)#24 | 1,060,713(0.06%)#180 |
| 25. | New City | 661 | 184,438(0.36%)#25 | 1,060,713(0.06%)#183 |
| 26. | West Babylon | 622 | 184,438(0.34%)#26 | 1,060,713(0.06%)#189 |
| 27. | Roosevelt | 614 | 184,438(0.33%)#27 | 1,060,713(0.06%)#192 |
| 28. | Hillcrest | 558 | 184,438(0.30%)#28 | 1,060,713(0.05%)#218 |
| 29. | Bay Shore | 557 | 184,438(0.30%)#29 | 1,060,713(0.05%)#219 |
| 30. | Chestnut Ridge | 547 | 184,438(0.30%)#30 | 1,060,713(0.05%)#225 |
| 31. | West Haverstraw | 543 | 184,438(0.29%)#31 | 1,060,713(0.05%)#228 |
| 32. | Gordon Heights | 512 | 184,438(0.28%)#32 | 1,060,713(0.05%)#242 |
| 33. | West Hempstead | 491 | 184,438(0.27%)#33 | 1,060,713(0.05%)#254 |
| 34. | Buffalo | 451 | 184,438(0.24%)#34 | 1,060,713(0.04%)#271 |
| 35. | Lynbrook | 442 | 184,438(0.24%)#35 | 1,060,713(0.04%)#272 |
| 36. | East Massapequa | 440 | 184,438(0.24%)#36 | 1,060,713(0.04%)#273 |
| 37. | Middletown | 411 | 184,438(0.22%)#37 | 1,060,713(0.04%)#282 |
| 38. | Haverstraw | 403 | 184,438(0.22%)#38 | 1,060,713(0.04%)#285 |
| 39. | Monsey | 397 | 184,438(0.22%)#39 | 1,060,713(0.04%)#291 |
| 40. | Syracuse | 371 | 184,438(0.20%)#40 | 1,060,713(0.03%)#302 |
| 41. | Westbury | 367 | 184,438(0.20%)#41 | 1,060,713(0.03%)#304 |
| 42. | Scotchtown | 360 | 184,438(0.20%)#42 | 1,060,713(0.03%)#307 |
| 43. | Newburgh | 336 | 184,438(0.18%)#43 | 1,060,713(0.03%)#320 |
| 44. | Nanuet | 335 | 184,438(0.18%)#44 | 1,060,713(0.03%)#323 |
| 45. | Albany | 328 | 184,438(0.18%)#45 | 1,060,713(0.03%)#329 |
| 46. | Ridge | 320 | 184,438(0.17%)#46 | 1,060,713(0.03%)#334 |
| 47. | Centereach | 297 | 184,438(0.16%)#47 | 1,060,713(0.03%)#351 |
| 48. | Troy | 287 | 184,438(0.16%)#48 | 1,060,713(0.03%)#363 |
| 49. | North Bellmore | 272 | 184,438(0.15%)#49 | 1,060,713(0.03%)#375 |
| 50. | Malverne | 267 | 184,438(0.14%)#50 | 1,060,713(0.03%)#384 |
| 51. | Stony Point | 256 | 184,438(0.14%)#51 | 1,060,713(0.02%)#400 |
| 52. | Peekskill | 249 | 184,438(0.14%)#52 | 1,060,713(0.02%)#413 |
| 53. | Johnson City | 247 | 184,438(0.13%)#53 | 1,060,713(0.02%)#417 |
| 54. | Rotterdam | 241 | 184,438(0.13%)#54 | 1,060,713(0.02%)#426 |
| 55. | Upper Nyack | 225 | 184,438(0.12%)#55 | 1,060,713(0.02%)#454 |
| 56. | Copiague | 223 | 184,438(0.12%)#56 | 1,060,713(0.02%)#456 |
| 57. | Farmingville | 215 | 184,438(0.12%)#57 | 1,060,713(0.02%)#462 |
| 58. | Riverhead | 207 | 184,438(0.11%)#58 | 1,060,713(0.02%)#474 |
| 59. | Lakeview | 202 | 184,438(0.11%)#59 | 1,060,713(0.02%)#485 |
| 60. | New Windsor | 197 | 184,438(0.11%)#60 | 1,060,713(0.02%)#496 |
| 61. | Highland Falls | 196 | 184,438(0.11%)#61 | 1,060,713(0.02%)#498 |
| 62. | Fairview Cdp Westchester County | 194 | 184,438(0.11%)#62 | 1,060,713(0.02%)#503 |
| 63. | Dix Hills | 190 | 184,438(0.10%)#63 | 1,060,713(0.02%)#511 |
| 64. | Farmingdale | 182 | 184,438(0.10%)#64 | 1,060,713(0.02%)#530 |
| 65. | Rockville Centre | 181 | 184,438(0.10%)#65 | 1,060,713(0.02%)#532 |
| 66. | Kingston | 181 | 184,438(0.10%)#66 | 1,060,713(0.02%)#533 |
| 67. | East Meadow | 179 | 184,438(0.10%)#67 | 1,060,713(0.02%)#536 |
| 68. | Poughkeepsie | 175 | 184,438(0.09%)#68 | 1,060,713(0.02%)#543 |
| 69. | Lindenhurst | 175 | 184,438(0.09%)#69 | 1,060,713(0.02%)#544 |
| 70. | Smithtown | 172 | 184,438(0.09%)#70 | 1,060,713(0.02%)#550 |
| 71. | North Bay Shore | 168 | 184,438(0.09%)#71 | 1,060,713(0.02%)#562 |
| 72. | Nesconset | 167 | 184,438(0.09%)#72 | 1,060,713(0.02%)#565 |
| 73. | South Nyack | 160 | 184,438(0.09%)#73 | 1,060,713(0.02%)#587 |
| 74. | Monroe | 155 | 184,438(0.08%)#74 | 1,060,713(0.01%)#595 |
| 75. | South Hempstead | 154 | 184,438(0.08%)#75 | 1,060,713(0.01%)#598 |
| 76. | Franklin Square | 151 | 184,438(0.08%)#76 | 1,060,713(0.01%)#609 |
| 77. | Patchogue | 148 | 184,438(0.08%)#77 | 1,060,713(0.01%)#617 |
| 78. | Hewlett | 147 | 184,438(0.08%)#78 | 1,060,713(0.01%)#619 |
| 79. | Pomona | 147 | 184,438(0.08%)#79 | 1,060,713(0.01%)#620 |
| 80. | Gardnertown | 144 | 184,438(0.08%)#80 | 1,060,713(0.01%)#627 |
| 81. | North Wantagh | 142 | 184,438(0.08%)#81 | 1,060,713(0.01%)#636 |
| 82. | Nyack | 140 | 184,438(0.08%)#82 | 1,060,713(0.01%)#643 |
| 83. | Thiells | 140 | 184,438(0.08%)#83 | 1,060,713(0.01%)#644 |
| 84. | Hicksville | 136 | 184,438(0.07%)#84 | 1,060,713(0.01%)#656 |
| 85. | Canastota | 134 | 184,438(0.07%)#85 | 1,060,713(0.01%)#662 |
| 86. | North Merrick | 131 | 184,438(0.07%)#86 | 1,060,713(0.01%)#670 |
| 87. | Utica | 127 | 184,438(0.07%)#87 | 1,060,713(0.01%)#680 |
| 88. | Schenectady | 126 | 184,438(0.07%)#88 | 1,060,713(0.01%)#681 |
| 89. | Montebello | 125 | 184,438(0.07%)#89 | 1,060,713(0.01%)#687 |
| 90. | South Floral Park | 124 | 184,438(0.07%)#90 | 1,060,713(0.01%)#694 |
| 91. | New Hempstead | 123 | 184,438(0.07%)#91 | 1,060,713(0.01%)#697 |
| 92. | Islip | 116 | 184,438(0.06%)#92 | 1,060,713(0.01%)#730 |
| 93. | Ossining | 115 | 184,438(0.06%)#93 | 1,060,713(0.01%)#734 |
| 94. | Holtsville | 115 | 184,438(0.06%)#94 | 1,060,713(0.01%)#736 |
| 95. | Cheektowaga | 107 | 184,438(0.06%)#95 | 1,060,713(0.01%)#769 |
| 96. | Stony Brook University | 106 | 184,438(0.06%)#96 | 1,060,713(0.01%)#779 |
| 97. | Coram | 105 | 184,438(0.06%)#97 | 1,060,713(0.01%)#780 |
| 98. | Ardsley | 102 | 184,438(0.06%)#98 | 1,060,713(0.01%)#794 |
| 99. | North Gates | 100 | 184,438(0.05%)#99 | 1,060,713(0.01%)#801 |
| 100. | Fort Salonga | 99 | 184,438(0.05%)#100 | 1,060,713(0.01%)#808 |
Common Questions
What are the Top 10 Cities with the Largest Haitian Community in New York?
Top 10 Cities with the Largest Haitian Community in New York are:
#1
118,674
#2
5,914
#3
4,902
#4
2,576
#5
2,534
#6
2,234
#7
1,777
#8
1,321
#9
1,277
#10
1,232
What city has the Largest Haitian Community in New York?
New York has the Largest Haitian Community in New York with 118,674.
What is the Total Haitian Population in the State of New York?
Total Haitian Population in New York is 184,438.
What is the Total Haitian Population in the United States?
Total Haitian Population in the United States is 1,060,713.