Zip Codes with the Highest Percentage of Population Employed in Food Preparation & Serving in Ozone Park, NY
RELATED REPORTS & OPTIONS
Food Preparation & Serving
Ozone Park
Compare Zip Codes
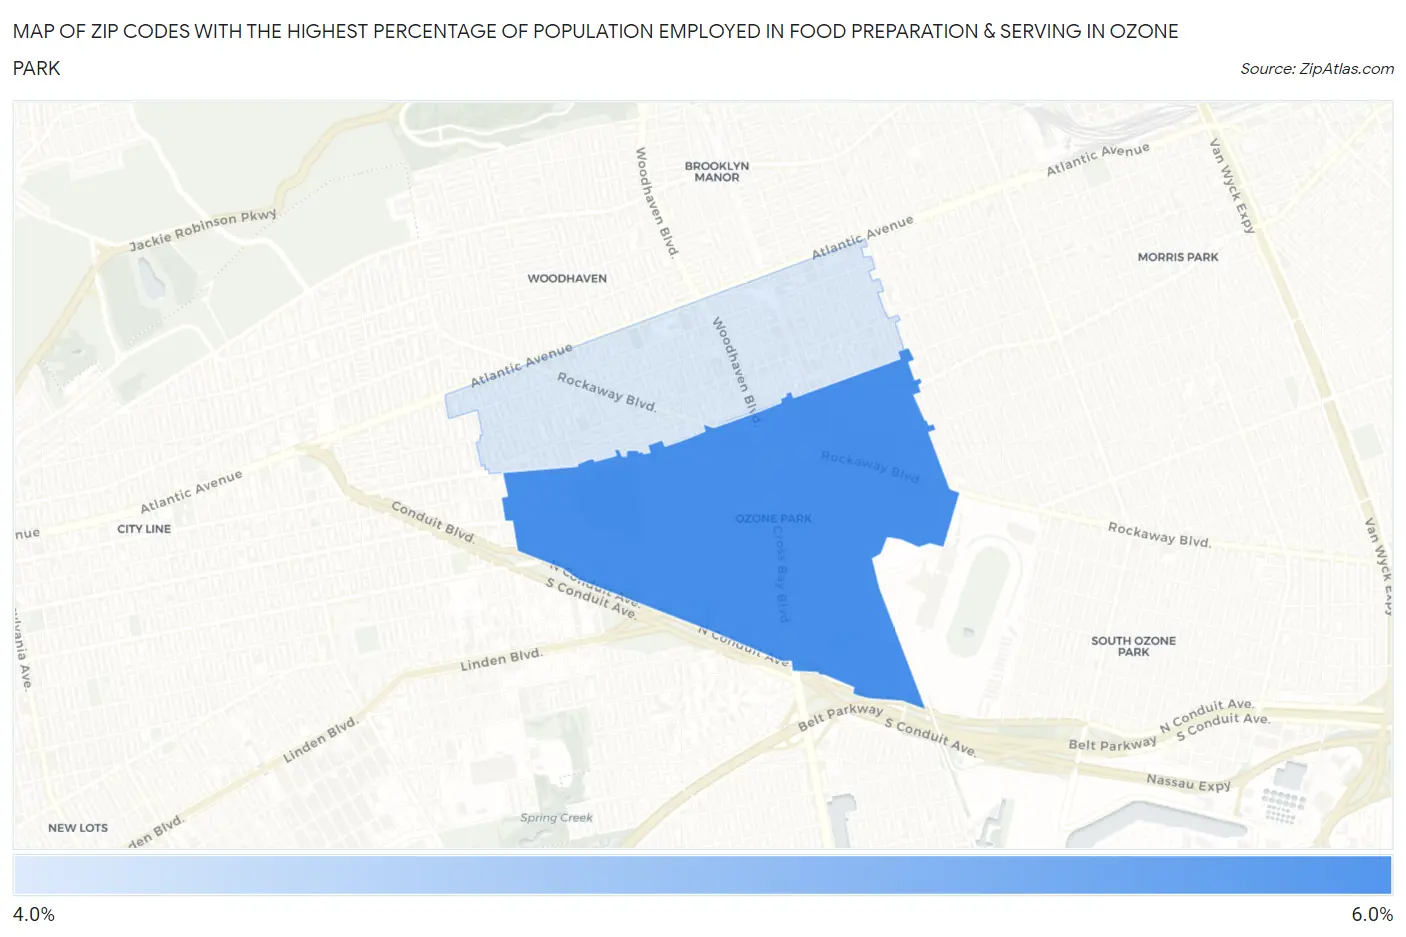
Map of Zip Codes with the Highest Percentage of Population Employed in Food Preparation & Serving in Ozone Park
4.6%
5.7%
Zip Codes with the Highest Percentage of Population Employed in Food Preparation & Serving in Ozone Park, NY
| Zip Code | % Employed | vs State | vs National | |
| 1. | 11417 | 5.7% | 4.8%(+0.916)#506 | 5.3%(+0.445)#10,241 |
| 2. | 11416 | 4.6% | 4.8%(-0.212)#705 | 5.3%(-0.682)#14,574 |
1
Common Questions
What are the Top Zip Codes with the Highest Percentage of Population Employed in Food Preparation & Serving in Ozone Park, NY?
Top Zip Codes with the Highest Percentage of Population Employed in Food Preparation & Serving in Ozone Park, NY are:
What zip code has the Highest Percentage of Population Employed in Food Preparation & Serving in Ozone Park, NY?
11417 has the Highest Percentage of Population Employed in Food Preparation & Serving in Ozone Park, NY with 5.7%.
What is the Percentage of Population Employed in Food Preparation & Serving in New York?
Percentage of Population Employed in Food Preparation & Serving in New York is 4.8%.
What is the Percentage of Population Employed in Food Preparation & Serving in the United States?
Percentage of Population Employed in Food Preparation & Serving in the United States is 5.3%.