Lake George, NY Map & Demographics
Lake George Map
Lake George Overview
$36,936
PER CAPITA INCOME
$57,917
AVG FAMILY INCOME
$52,196
AVG HOUSEHOLD INCOME
21.9%
WAGE / INCOME GAP [ % ]
78.1¢/ $1
WAGE / INCOME GAP [ $ ]
0.37
INEQUALITY / GINI INDEX
943
TOTAL POPULATION
459
MALE POPULATION
484
FEMALE POPULATION
94.83
MALES / 100 FEMALES
105.45
FEMALES / 100 MALES
52.2
MEDIAN AGE
2.5
AVG FAMILY SIZE
1.8
AVG HOUSEHOLD SIZE
499
LABOR FORCE [ PEOPLE ]
56.9%
PERCENT IN LABOR FORCE
1.2%
UNEMPLOYMENT RATE
Lake George Zip Codes
Lake George Area Codes
Income in Lake George
Income Overview in Lake George
Per Capita Income in Lake George is $36,936, while median incomes of families and households are $57,917 and $52,196 respectively.
| Characteristic | Number | Measure |
| Per Capita Income | 943 | $36,936 |
| Median Family Income | 234 | $57,917 |
| Mean Family Income | 234 | $81,279 |
| Median Household Income | 515 | $52,196 |
| Mean Household Income | 515 | $67,674 |
| Income Deficit | 234 | $0 |
| Wage / Income Gap (%) | 943 | 21.87% |
| Wage / Income Gap ($) | 943 | 78.13¢ per $1 |
| Gini / Inequality Index | 943 | 0.37 |
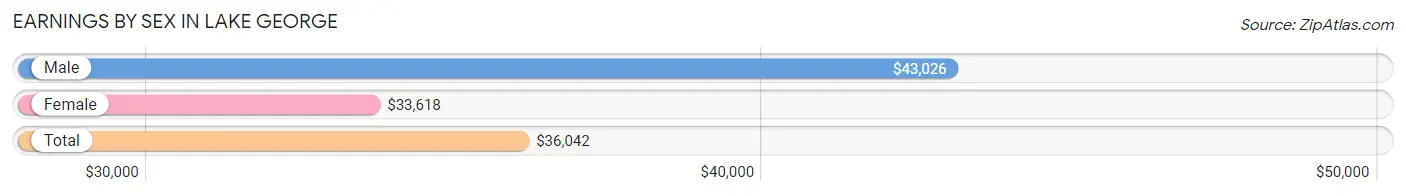
Earnings by Sex in Lake George
Average Earnings in Lake George are $36,042, $43,026 for men and $33,618 for women, a difference of 21.9%.
| Sex | Number | Average Earnings |
| Male | 300 (48.5%) | $43,026 |
| Female | 319 (51.5%) | $33,618 |
| Total | 619 (100.0%) | $36,042 |
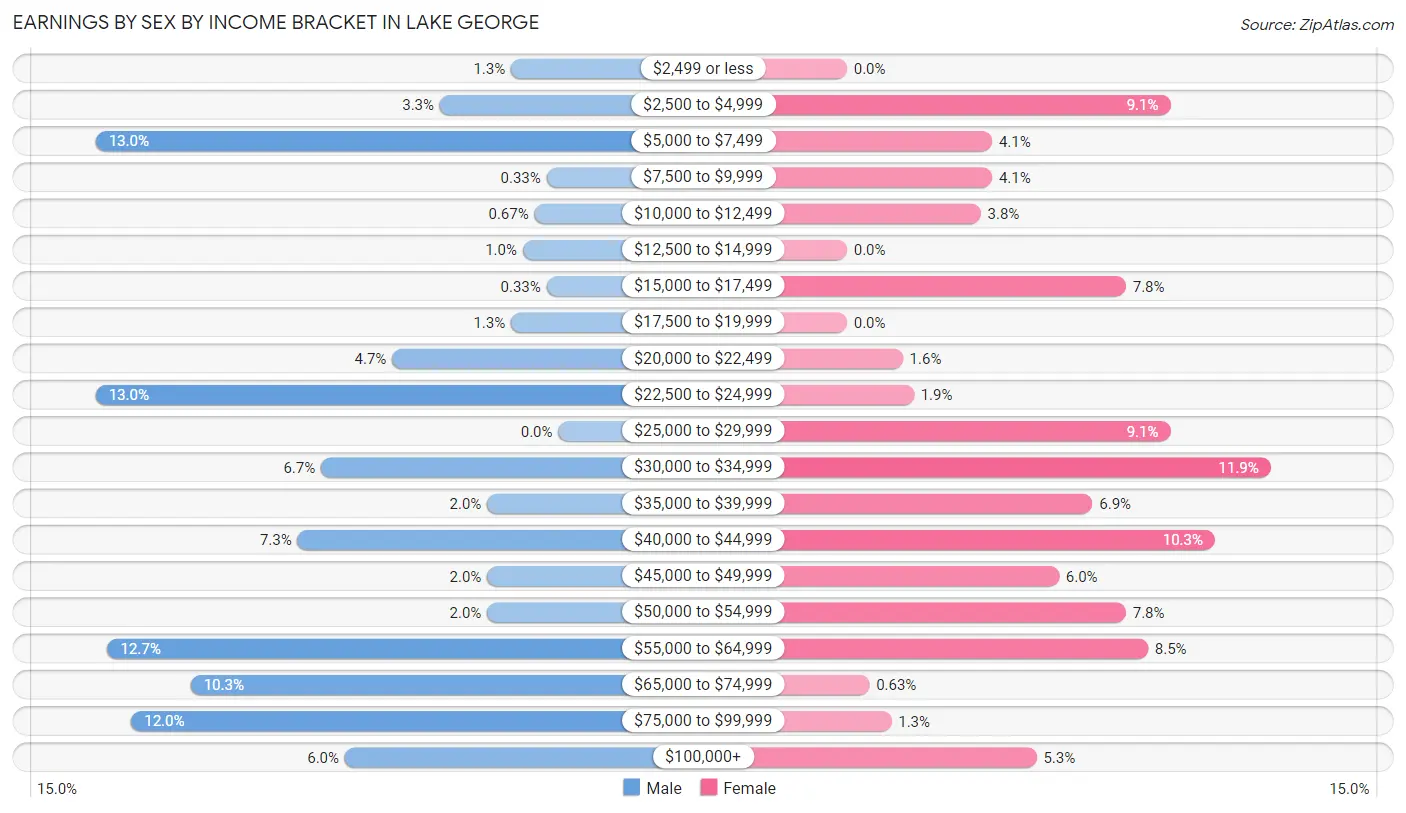
Earnings by Sex by Income Bracket in Lake George
The most common earnings brackets in Lake George are $5,000 to $7,499 for men (39 | 13.0%) and $30,000 to $34,999 for women (38 | 11.9%).
| Income | Male | Female |
| $2,499 or less | 4 (1.3%) | 0 (0.0%) |
| $2,500 to $4,999 | 10 (3.3%) | 29 (9.1%) |
| $5,000 to $7,499 | 39 (13.0%) | 13 (4.1%) |
| $7,500 to $9,999 | 1 (0.3%) | 13 (4.1%) |
| $10,000 to $12,499 | 2 (0.7%) | 12 (3.8%) |
| $12,500 to $14,999 | 3 (1.0%) | 0 (0.0%) |
| $15,000 to $17,499 | 1 (0.3%) | 25 (7.8%) |
| $17,500 to $19,999 | 4 (1.3%) | 0 (0.0%) |
| $20,000 to $22,499 | 14 (4.7%) | 5 (1.6%) |
| $22,500 to $24,999 | 39 (13.0%) | 6 (1.9%) |
| $25,000 to $29,999 | 0 (0.0%) | 29 (9.1%) |
| $30,000 to $34,999 | 20 (6.7%) | 38 (11.9%) |
| $35,000 to $39,999 | 6 (2.0%) | 22 (6.9%) |
| $40,000 to $44,999 | 22 (7.3%) | 33 (10.3%) |
| $45,000 to $49,999 | 6 (2.0%) | 19 (6.0%) |
| $50,000 to $54,999 | 6 (2.0%) | 25 (7.8%) |
| $55,000 to $64,999 | 38 (12.7%) | 27 (8.5%) |
| $65,000 to $74,999 | 31 (10.3%) | 2 (0.6%) |
| $75,000 to $99,999 | 36 (12.0%) | 4 (1.3%) |
| $100,000+ | 18 (6.0%) | 17 (5.3%) |
| Total | 300 (100.0%) | 319 (100.0%) |
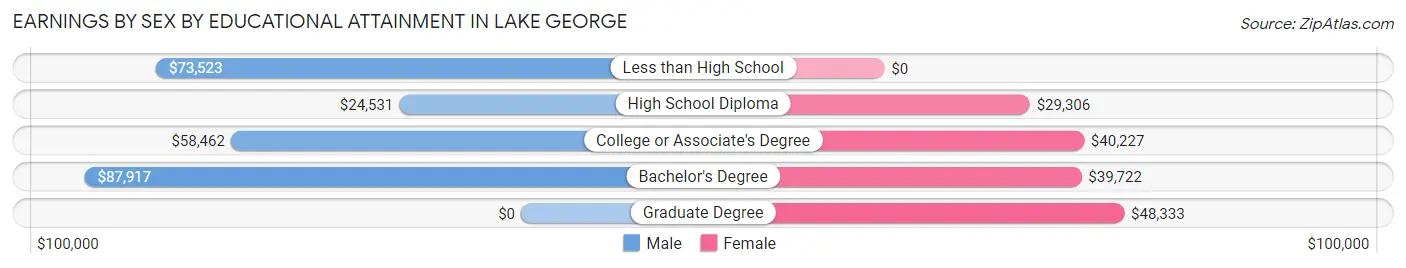
Earnings by Sex by Educational Attainment in Lake George
Average earnings in Lake George are $55,294 for men and $35,625 for women, a difference of 35.6%. Men with an educational attainment of bachelor's degree enjoy the highest average annual earnings of $87,917, while those with high school diploma education earn the least with $24,531. Women with an educational attainment of graduate degree earn the most with the average annual earnings of $48,333, while those with high school diploma education have the smallest earnings of $29,306.
| Educational Attainment | Male Income | Female Income |
| Less than High School | $73,523 | $0 |
| High School Diploma | $24,531 | $29,306 |
| College or Associate's Degree | $58,462 | $40,227 |
| Bachelor's Degree | $87,917 | $39,722 |
| Graduate Degree | - | - |
| Total | $55,294 | $35,625 |
Family Income in Lake George
Family Income Brackets in Lake George
According to the Lake George family income data, there are 76 families falling into the $50,000 to $74,999 income range, which is the most common income bracket and makes up 32.5% of all families.
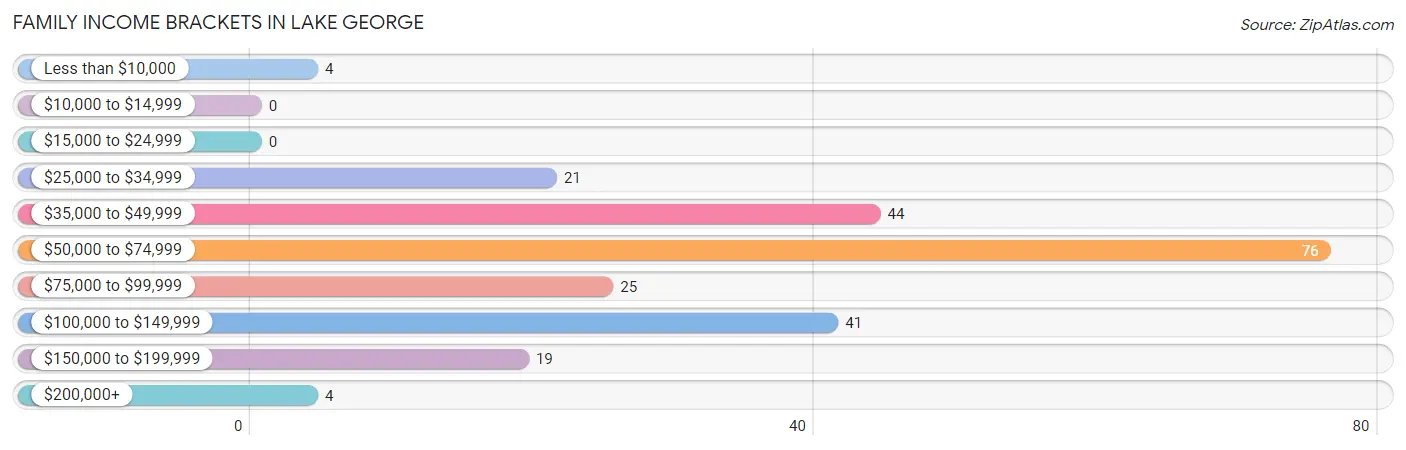
| Income Bracket | # Families | % Families |
| Less than $10,000 | 4 | 1.7% |
| $10,000 to $14,999 | 0 | 0.0% |
| $15,000 to $24,999 | 0 | 0.0% |
| $25,000 to $34,999 | 21 | 9.0% |
| $35,000 to $49,999 | 44 | 18.8% |
| $50,000 to $74,999 | 76 | 32.5% |
| $75,000 to $99,999 | 25 | 10.7% |
| $100,000 to $149,999 | 41 | 17.5% |
| $150,000 to $199,999 | 19 | 8.1% |
| $200,000+ | 4 | 1.7% |
Family Income by Famaliy Size in Lake George
2-person families (138 | 59.0%) account for the highest median family income in Lake George with $73,833 per family, while 2-person families (138 | 59.0%) have the highest median income of $36,916 per family member.
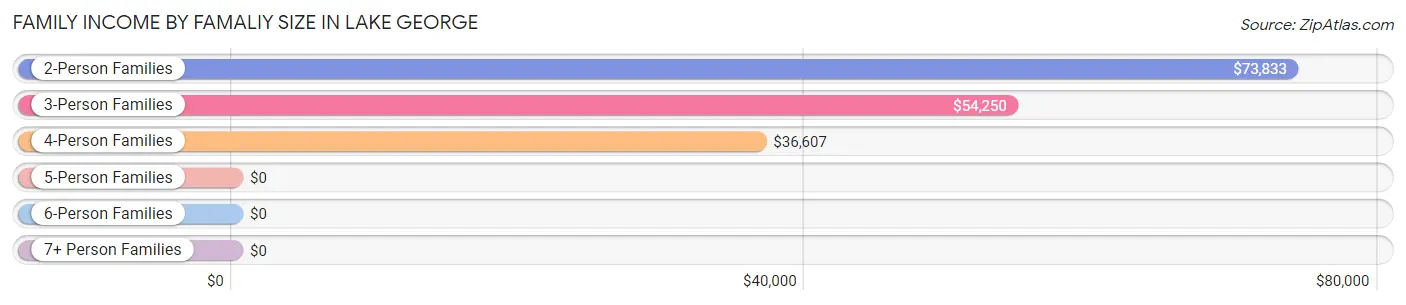
| Income Bracket | # Families | Median Income |
| 2-Person Families | 138 (59.0%) | $73,833 |
| 3-Person Families | 47 (20.1%) | $54,250 |
| 4-Person Families | 45 (19.2%) | $36,607 |
| 5-Person Families | 0 (0.0%) | $0 |
| 6-Person Families | 2 (0.9%) | $0 |
| 7+ Person Families | 2 (0.9%) | $0 |
| Total | 234 (100.0%) | $57,917 |
Family Income by Number of Earners in Lake George
The median family income in Lake George is $57,917, with families comprising 3+ earners (15) having the highest median family income of $191,125, while families with 2 earners (147) have the lowest median family income of $52,026, accounting for 6.4% and 62.8% of families, respectively.
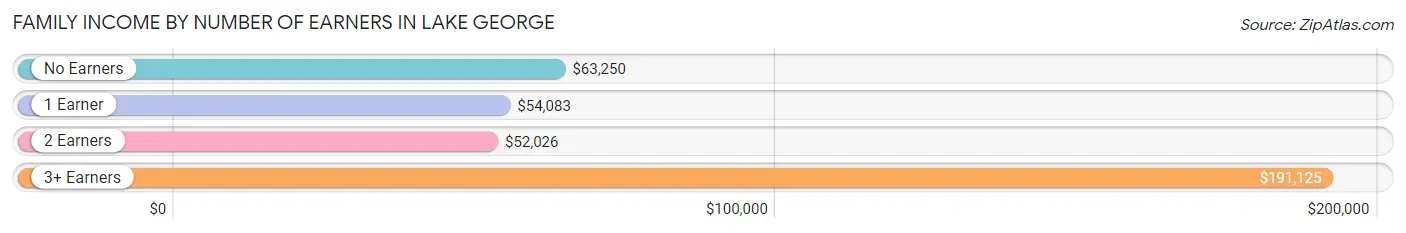
| Number of Earners | # Families | Median Income |
| No Earners | 21 (9.0%) | $63,250 |
| 1 Earner | 51 (21.8%) | $54,083 |
| 2 Earners | 147 (62.8%) | $52,026 |
| 3+ Earners | 15 (6.4%) | $191,125 |
| Total | 234 (100.0%) | $57,917 |
Household Income in Lake George
Household Income Brackets in Lake George
With 153 households falling in the category, the $50,000 to $74,999 income range is the most frequent in Lake George, accounting for 29.7% of all households. In contrast, only 4 households (0.8%) fall into the $10,000 to $14,999 income bracket, making it the least populous group.
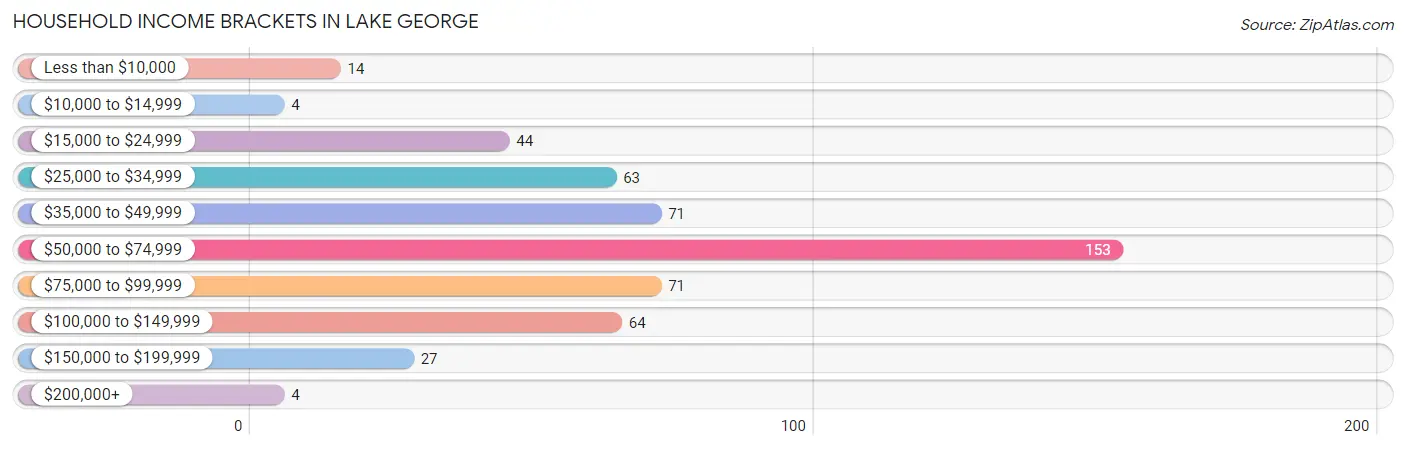
| Income Bracket | # Households | % Households |
| Less than $10,000 | 14 | 2.7% |
| $10,000 to $14,999 | 4 | 0.8% |
| $15,000 to $24,999 | 44 | 8.5% |
| $25,000 to $34,999 | 63 | 12.2% |
| $35,000 to $49,999 | 71 | 13.8% |
| $50,000 to $74,999 | 153 | 29.7% |
| $75,000 to $99,999 | 71 | 13.8% |
| $100,000 to $149,999 | 64 | 12.4% |
| $150,000 to $199,999 | 27 | 5.2% |
| $200,000+ | 4 | 0.8% |
Household Income by Householder Age in Lake George
The median household income in Lake George is $52,196, with the highest median household income of $81,250 found in the 15 to 24 years age bracket for the primary householder. A total of 21 households (4.1%) fall into this category. Meanwhile, the 65+ years age bracket for the primary householder has the lowest median household income of $0, with 159 households (30.9%) in this group.
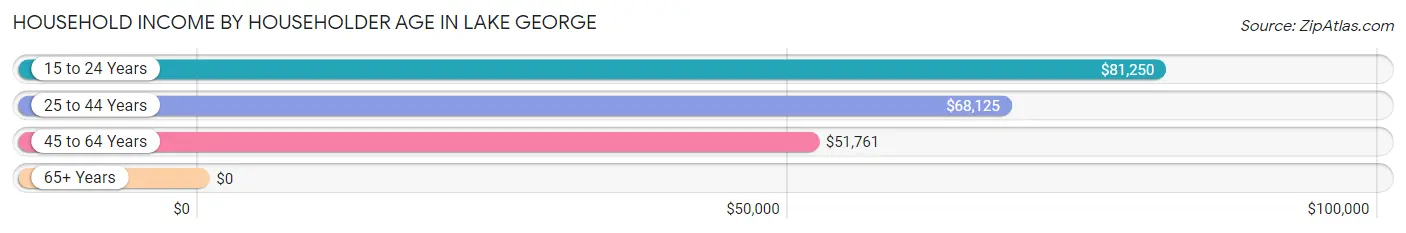
| Income Bracket | # Households | Median Income |
| 15 to 24 Years | 21 (4.1%) | $81,250 |
| 25 to 44 Years | 100 (19.4%) | $68,125 |
| 45 to 64 Years | 235 (45.6%) | $51,761 |
| 65+ Years | 159 (30.9%) | $0 |
| Total | 515 (100.0%) | $52,196 |
Poverty in Lake George
Income Below Poverty by Sex and Age in Lake George
With 2.0% poverty level for males and 4.6% for females among the residents of Lake George, 35 to 44 year old males and 6 to 11 year old females are the most vulnerable to poverty, with 6 males (18.8%) and 4 females (66.7%) in their respective age groups living below the poverty level.
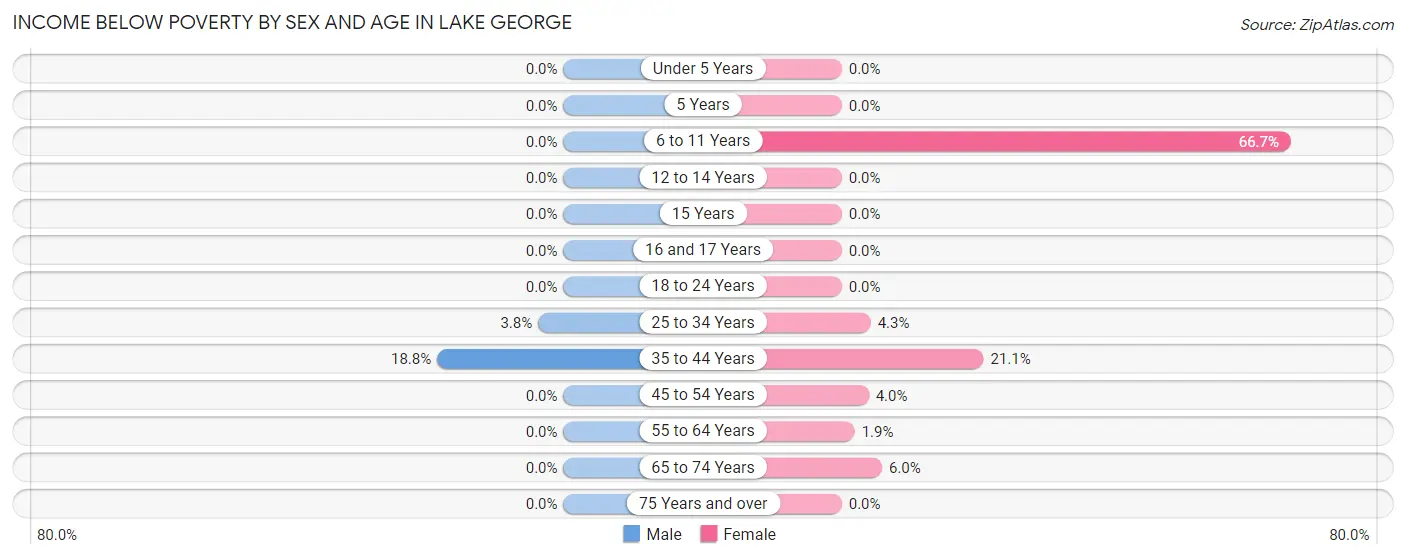
| Age Bracket | Male | Female |
| Under 5 Years | 0 (0.0%) | 0 (0.0%) |
| 5 Years | 0 (0.0%) | 0 (0.0%) |
| 6 to 11 Years | 0 (0.0%) | 4 (66.7%) |
| 12 to 14 Years | 0 (0.0%) | 0 (0.0%) |
| 15 Years | 0 (0.0%) | 0 (0.0%) |
| 16 and 17 Years | 0 (0.0%) | 0 (0.0%) |
| 18 to 24 Years | 0 (0.0%) | 0 (0.0%) |
| 25 to 34 Years | 3 (3.7%) | 4 (4.3%) |
| 35 to 44 Years | 6 (18.8%) | 4 (21.0%) |
| 45 to 54 Years | 0 (0.0%) | 4 (4.0%) |
| 55 to 64 Years | 0 (0.0%) | 2 (1.9%) |
| 65 to 74 Years | 0 (0.0%) | 4 (6.0%) |
| 75 Years and over | 0 (0.0%) | 0 (0.0%) |
| Total | 9 (2.0%) | 22 (4.6%) |
Income Above Poverty by Sex and Age in Lake George
According to the poverty statistics in Lake George, males aged under 5 years and females aged under 5 years are the age groups that are most secure financially, with 100.0% of males and 100.0% of females in these age groups living above the poverty line.
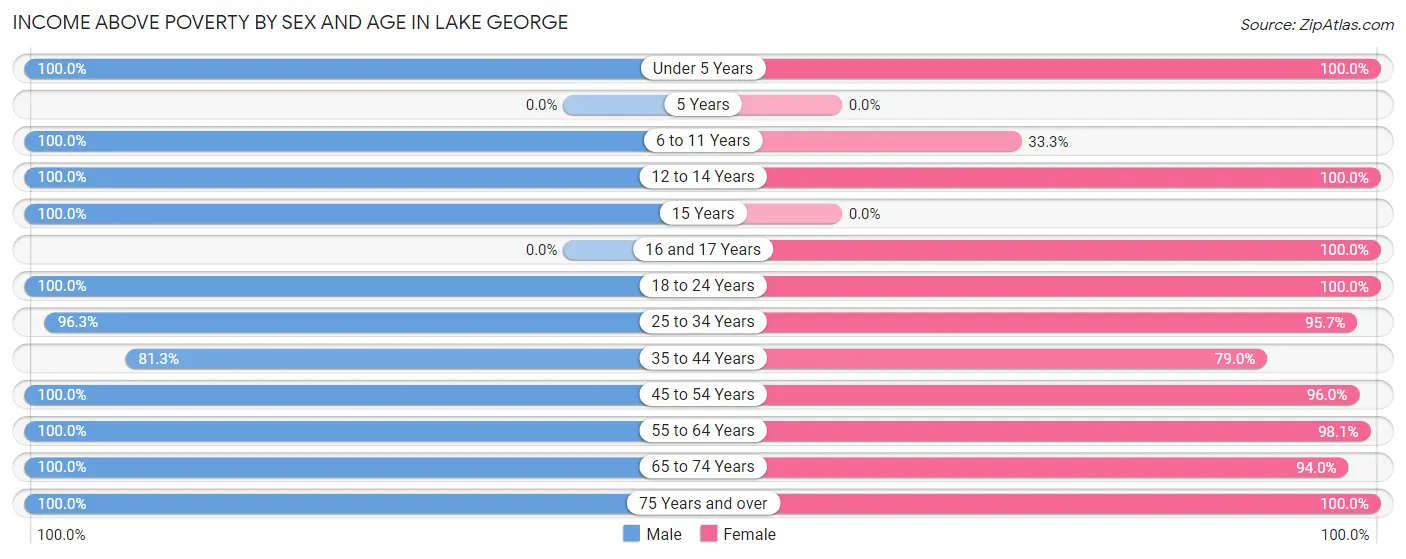
| Age Bracket | Male | Female |
| Under 5 Years | 7 (100.0%) | 9 (100.0%) |
| 5 Years | 0 (0.0%) | 0 (0.0%) |
| 6 to 11 Years | 13 (100.0%) | 2 (33.3%) |
| 12 to 14 Years | 20 (100.0%) | 6 (100.0%) |
| 15 Years | 2 (100.0%) | 0 (0.0%) |
| 16 and 17 Years | 0 (0.0%) | 1 (100.0%) |
| 18 to 24 Years | 69 (100.0%) | 51 (100.0%) |
| 25 to 34 Years | 77 (96.3%) | 89 (95.7%) |
| 35 to 44 Years | 26 (81.2%) | 15 (78.9%) |
| 45 to 54 Years | 51 (100.0%) | 96 (96.0%) |
| 55 to 64 Years | 70 (100.0%) | 102 (98.1%) |
| 65 to 74 Years | 77 (100.0%) | 63 (94.0%) |
| 75 Years and over | 38 (100.0%) | 25 (100.0%) |
| Total | 450 (98.0%) | 459 (95.4%) |
Income Below Poverty Among Married-Couple Families in Lake George
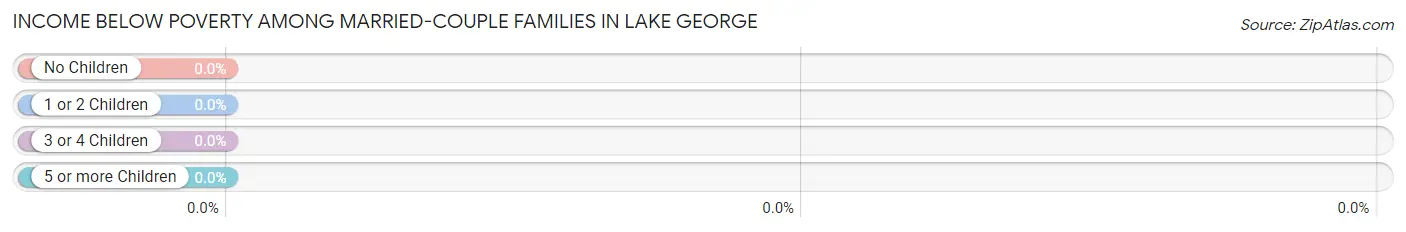
| Children | Above Poverty | Below Poverty |
| No Children | 102 (100.0%) | 0 (0.0%) |
| 1 or 2 Children | 10 (100.0%) | 0 (0.0%) |
| 3 or 4 Children | 4 (100.0%) | 0 (0.0%) |
| 5 or more Children | 0 (0.0%) | 0 (0.0%) |
| Total | 116 (100.0%) | 0 (0.0%) |
Income Below Poverty Among Single-Parent Households in Lake George
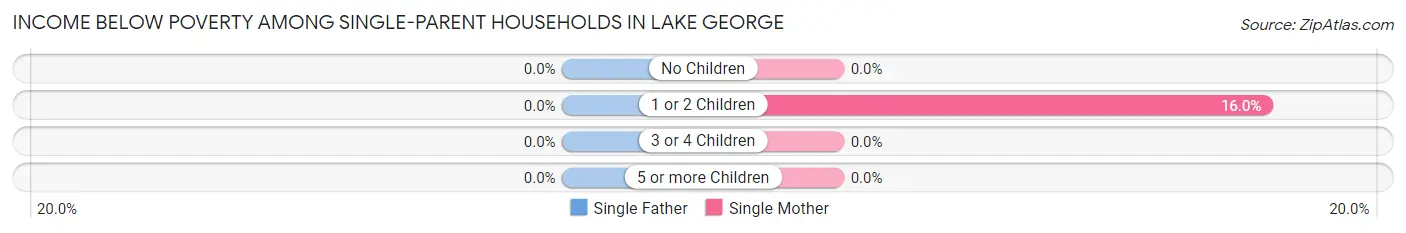
| Children | Single Father | Single Mother |
| No Children | 0 (0.0%) | 0 (0.0%) |
| 1 or 2 Children | 0 (0.0%) | 4 (16.0%) |
| 3 or 4 Children | 0 (0.0%) | 0 (0.0%) |
| 5 or more Children | 0 (0.0%) | 0 (0.0%) |
| Total | 0 (0.0%) | 4 (4.0%) |
Income Below Poverty Among Married-Couple vs Single-Parent Households in Lake George
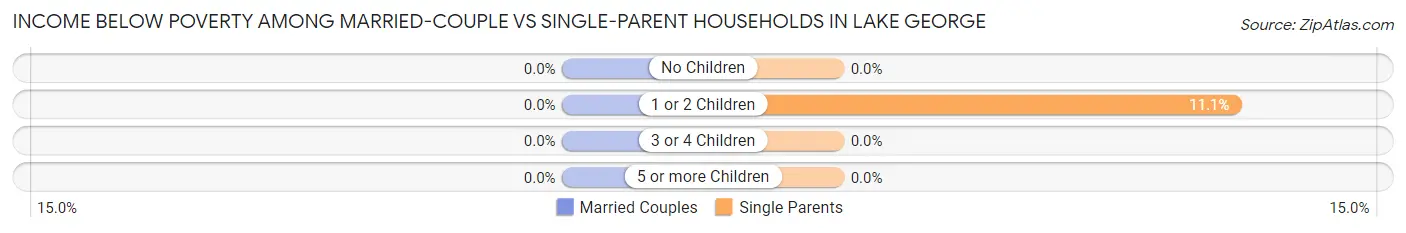
| Children | Married-Couple Families | Single-Parent Households |
| No Children | 0 (0.0%) | 0 (0.0%) |
| 1 or 2 Children | 0 (0.0%) | 4 (11.1%) |
| 3 or 4 Children | 0 (0.0%) | 0 (0.0%) |
| 5 or more Children | 0 (0.0%) | 0 (0.0%) |
| Total | 0 (0.0%) | 4 (3.4%) |
Race in Lake George
The most populous races in Lake George are White / Caucasian (822 | 87.2%), Hispanic or Latino (152 | 16.1%), and Two or more Races (77 | 8.2%).
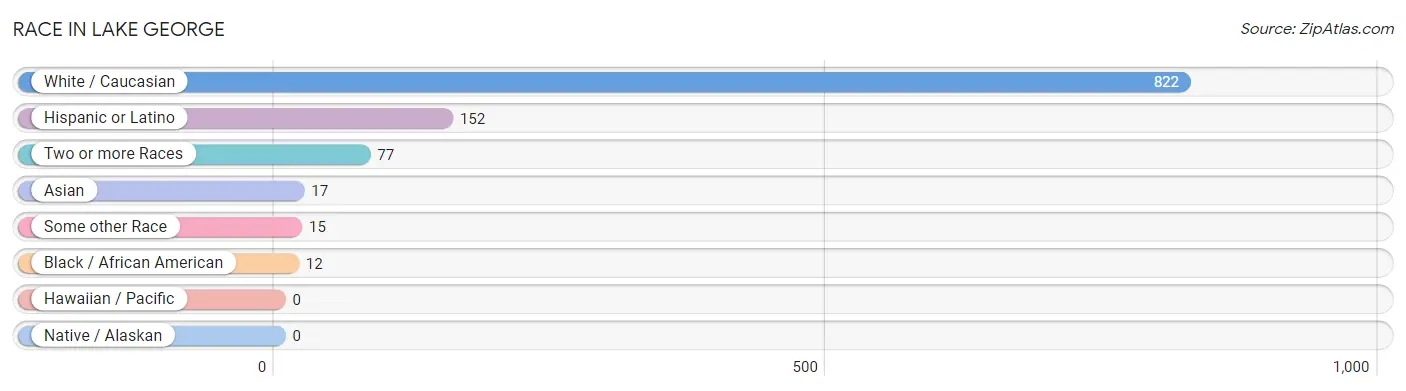
| Race | # Population | % Population |
| Asian | 17 | 1.8% |
| Black / African American | 12 | 1.3% |
| Hawaiian / Pacific | 0 | 0.0% |
| Hispanic or Latino | 152 | 16.1% |
| Native / Alaskan | 0 | 0.0% |
| White / Caucasian | 822 | 87.2% |
| Two or more Races | 77 | 8.2% |
| Some other Race | 15 | 1.6% |
| Total | 943 | 100.0% |
Ancestry in Lake George
The most populous ancestries reported in Lake George are Irish (212 | 22.5%), Italian (150 | 15.9%), German (119 | 12.6%), Central American (103 | 10.9%), and Salvadoran (101 | 10.7%), together accounting for 72.6% of all Lake George residents.
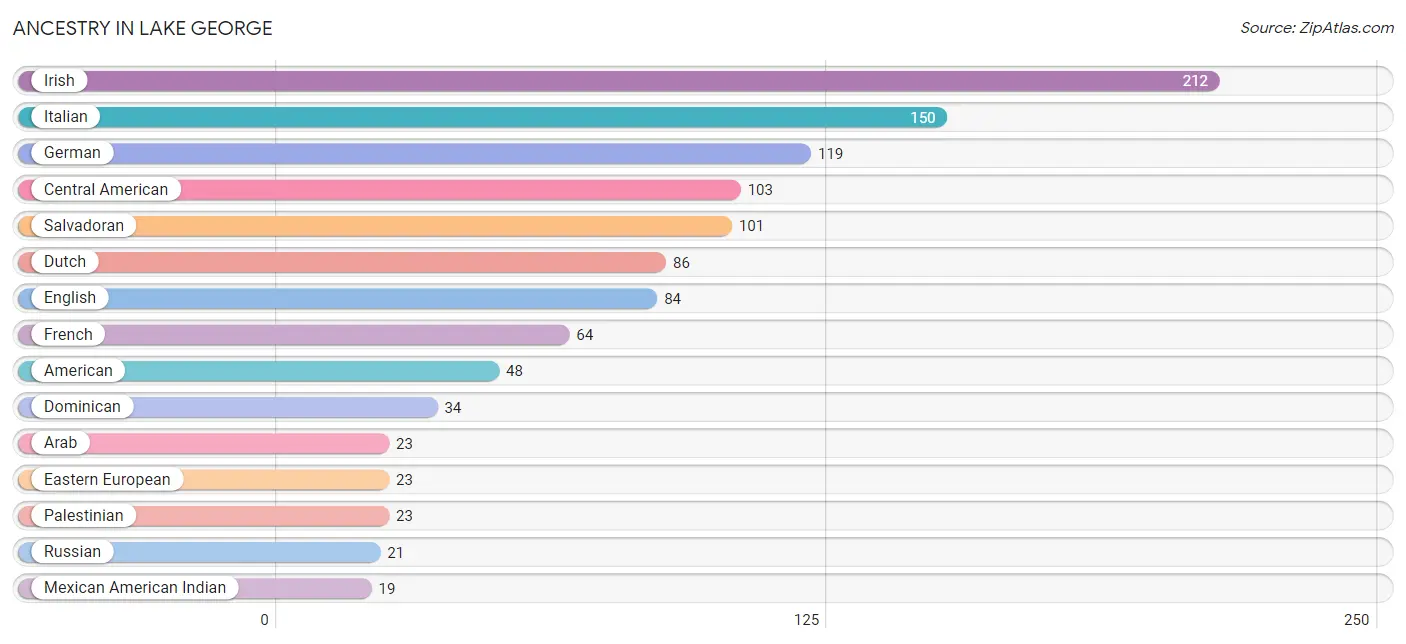
| Ancestry | # Population | % Population |
| American | 48 | 5.1% |
| Arab | 23 | 2.4% |
| Barbadian | 4 | 0.4% |
| Burmese | 1 | 0.1% |
| Central American | 103 | 10.9% |
| Cherokee | 5 | 0.5% |
| Colombian | 12 | 1.3% |
| Danish | 7 | 0.7% |
| Dominican | 34 | 3.6% |
| Dutch | 86 | 9.1% |
| Eastern European | 23 | 2.4% |
| English | 84 | 8.9% |
| European | 13 | 1.4% |
| French | 64 | 6.8% |
| French Canadian | 6 | 0.6% |
| German | 119 | 12.6% |
| Honduran | 2 | 0.2% |
| Hungarian | 6 | 0.6% |
| Irish | 212 | 22.5% |
| Italian | 150 | 15.9% |
| Jamaican | 4 | 0.4% |
| Korean | 10 | 1.1% |
| Mexican American Indian | 19 | 2.0% |
| Norwegian | 13 | 1.4% |
| Palestinian | 23 | 2.4% |
| Polish | 16 | 1.7% |
| Romanian | 7 | 0.7% |
| Russian | 21 | 2.2% |
| Salvadoran | 101 | 10.7% |
| Scottish | 10 | 1.1% |
| South American | 12 | 1.3% |
| Swedish | 7 | 0.7% |
| Swiss | 5 | 0.5% |
| Thai | 16 | 1.7% |
| Ukrainian | 6 | 0.6% |
| Welsh | 5 | 0.5% | View All 36 Rows |
Immigrants in Lake George
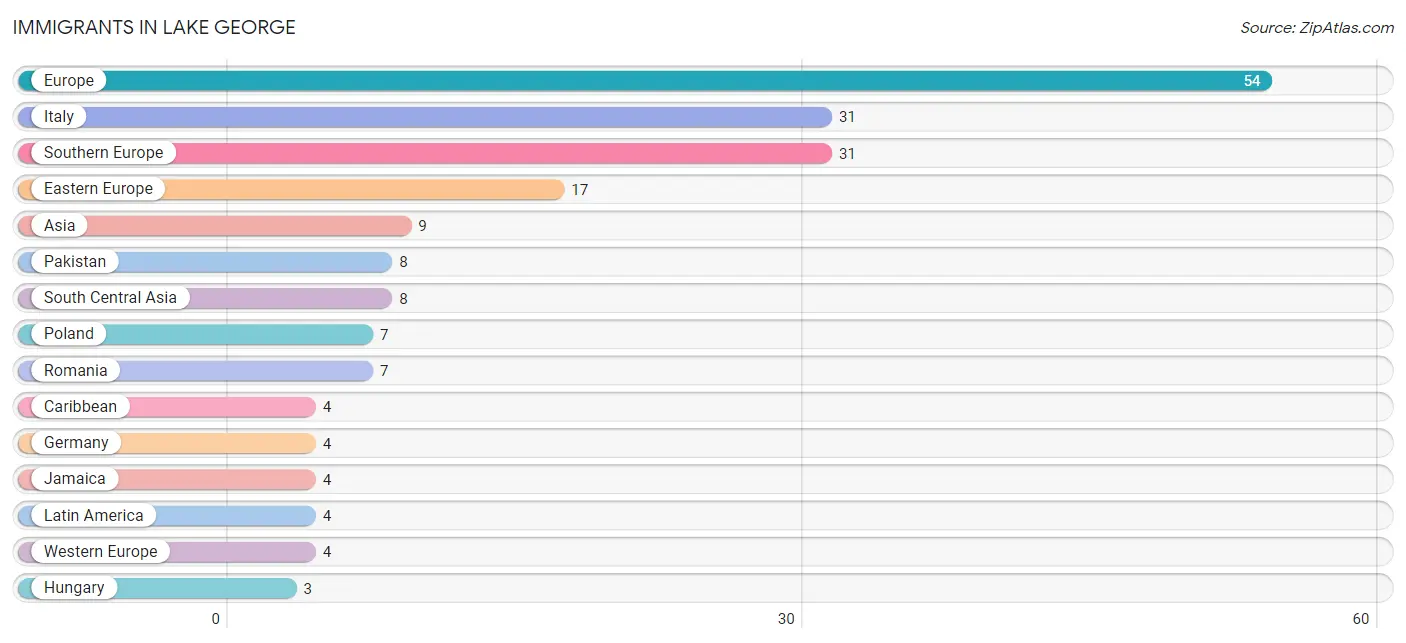
The most numerous immigrant groups reported in Lake George came from Europe (54 | 5.7%), Italy (31 | 3.3%), Southern Europe (31 | 3.3%), Eastern Europe (17 | 1.8%), and Asia (9 | 0.9%), together accounting for 15.1% of all Lake George residents.
| Immigration Origin | # Population | % Population |
| Asia | 9 | 0.9% |
| Caribbean | 4 | 0.4% |
| Eastern Asia | 1 | 0.1% |
| Eastern Europe | 17 | 1.8% |
| England | 2 | 0.2% |
| Europe | 54 | 5.7% |
| Germany | 4 | 0.4% |
| Hungary | 3 | 0.3% |
| Italy | 31 | 3.3% |
| Jamaica | 4 | 0.4% |
| Korea | 1 | 0.1% |
| Latin America | 4 | 0.4% |
| Northern Europe | 2 | 0.2% |
| Pakistan | 8 | 0.9% |
| Poland | 7 | 0.7% |
| Romania | 7 | 0.7% |
| South Central Asia | 8 | 0.9% |
| Southern Europe | 31 | 3.3% |
| Western Europe | 4 | 0.4% | View All 19 Rows |
Sex and Age in Lake George
Sex and Age in Lake George
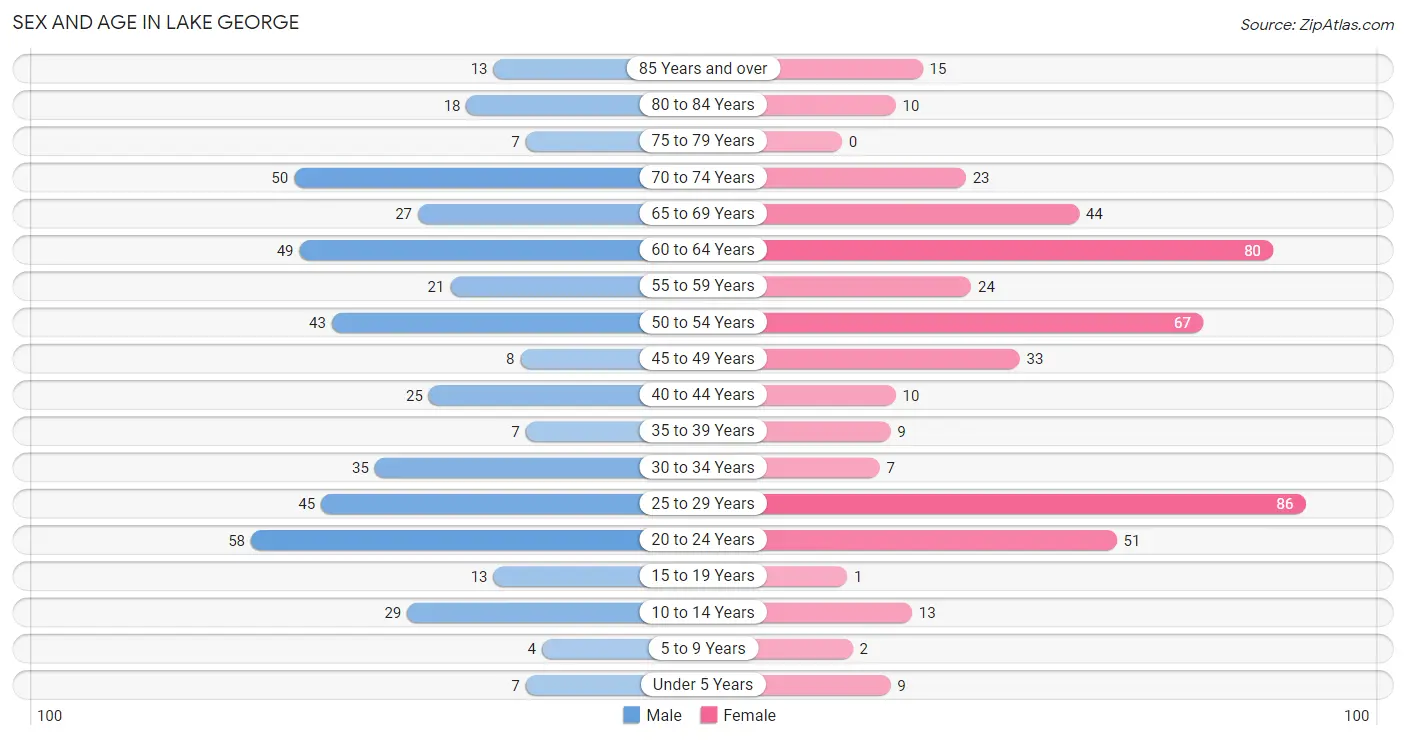
The most populous age groups in Lake George are 20 to 24 Years (58 | 12.6%) for men and 25 to 29 Years (86 | 17.8%) for women.
| Age Bracket | Male | Female |
| Under 5 Years | 7 (1.5%) | 9 (1.9%) |
| 5 to 9 Years | 4 (0.9%) | 2 (0.4%) |
| 10 to 14 Years | 29 (6.3%) | 13 (2.7%) |
| 15 to 19 Years | 13 (2.8%) | 1 (0.2%) |
| 20 to 24 Years | 58 (12.6%) | 51 (10.5%) |
| 25 to 29 Years | 45 (9.8%) | 86 (17.8%) |
| 30 to 34 Years | 35 (7.6%) | 7 (1.5%) |
| 35 to 39 Years | 7 (1.5%) | 9 (1.9%) |
| 40 to 44 Years | 25 (5.4%) | 10 (2.1%) |
| 45 to 49 Years | 8 (1.7%) | 33 (6.8%) |
| 50 to 54 Years | 43 (9.4%) | 67 (13.8%) |
| 55 to 59 Years | 21 (4.6%) | 24 (5.0%) |
| 60 to 64 Years | 49 (10.7%) | 80 (16.5%) |
| 65 to 69 Years | 27 (5.9%) | 44 (9.1%) |
| 70 to 74 Years | 50 (10.9%) | 23 (4.8%) |
| 75 to 79 Years | 7 (1.5%) | 0 (0.0%) |
| 80 to 84 Years | 18 (3.9%) | 10 (2.1%) |
| 85 Years and over | 13 (2.8%) | 15 (3.1%) |
| Total | 459 (100.0%) | 484 (100.0%) |
Families and Households in Lake George
Median Family Size in Lake George
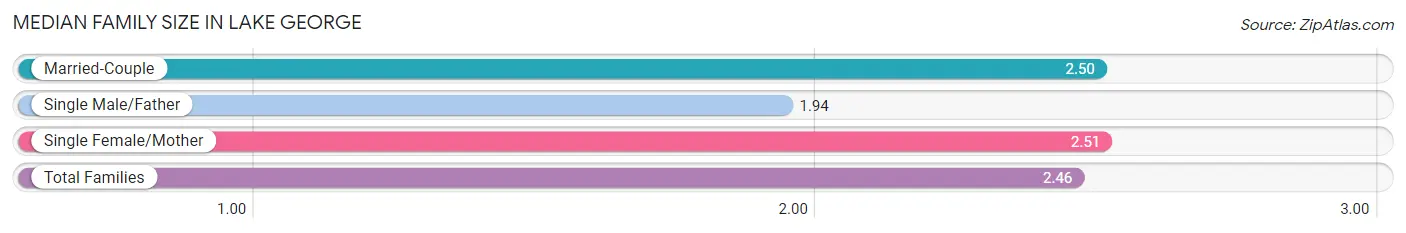
The median family size in Lake George is 2.46 persons per family, with single female/mother families (100 | 42.7%) accounting for the largest median family size of 2.51 persons per family. On the other hand, single male/father families (18 | 7.7%) represent the smallest median family size with 1.94 persons per family.
| Family Type | # Families | Family Size |
| Married-Couple | 116 (49.6%) | 2.50 |
| Single Male/Father | 18 (7.7%) | 1.94 |
| Single Female/Mother | 100 (42.7%) | 2.51 |
| Total Families | 234 (100.0%) | 2.46 |
Median Household Size in Lake George
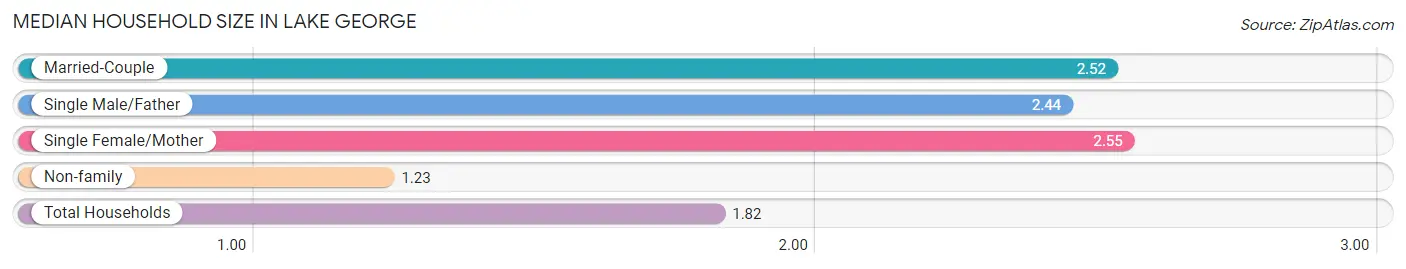
The median household size in Lake George is 1.82 persons per household, with single female/mother households (100 | 19.4%) accounting for the largest median household size of 2.55 persons per household. non-family households (281 | 54.6%) represent the smallest median household size with 1.23 persons per household.
| Household Type | # Households | Household Size |
| Married-Couple | 116 (22.5%) | 2.52 |
| Single Male/Father | 18 (3.5%) | 2.44 |
| Single Female/Mother | 100 (19.4%) | 2.55 |
| Non-family | 281 (54.6%) | 1.23 |
| Total Households | 515 (100.0%) | 1.82 |
Household Size by Marriage Status in Lake George
Out of a total of 515 households in Lake George, 234 (45.4%) are family households, while 281 (54.6%) are nonfamily households. The most numerous type of family households are 2-person households, comprising 127, and the most common type of nonfamily households are 1-person households, comprising 205.
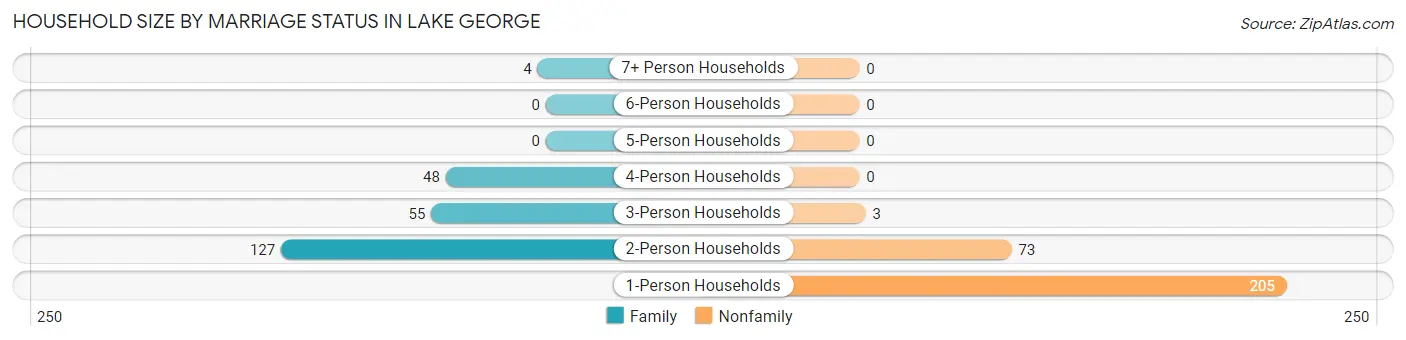
| Household Size | Family Households | Nonfamily Households |
| 1-Person Households | - | 205 (39.8%) |
| 2-Person Households | 127 (24.7%) | 73 (14.2%) |
| 3-Person Households | 55 (10.7%) | 3 (0.6%) |
| 4-Person Households | 48 (9.3%) | 0 (0.0%) |
| 5-Person Households | 0 (0.0%) | 0 (0.0%) |
| 6-Person Households | 0 (0.0%) | 0 (0.0%) |
| 7+ Person Households | 4 (0.8%) | 0 (0.0%) |
| Total | 234 (45.4%) | 281 (54.6%) |
Female Fertility in Lake George
Fertility by Age in Lake George
Average fertility rate in Lake George is 20.0 births per 1,000 women. Women in the age bracket of 20 to 34 years have the highest fertility rate with 28.0 births per 1,000 women. Women in the age bracket of 20 to 34 years acount for 100.0% of all women with births.
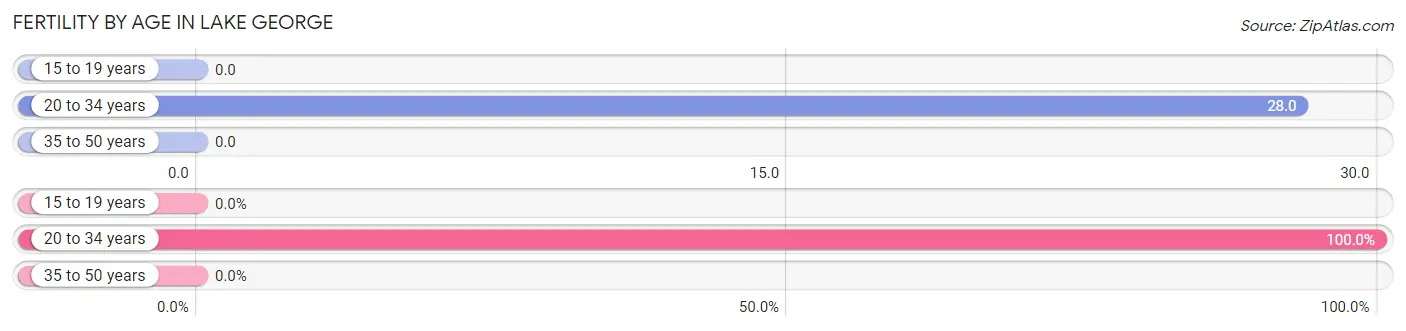
| Age Bracket | Women with Births | Births / 1,000 Women |
| 15 to 19 years | 0 (0.0%) | 0.0 |
| 20 to 34 years | 4 (100.0%) | 28.0 |
| 35 to 50 years | 0 (0.0%) | 0.0 |
| Total | 4 (100.0%) | 20.0 |
Fertility by Age by Marriage Status in Lake George
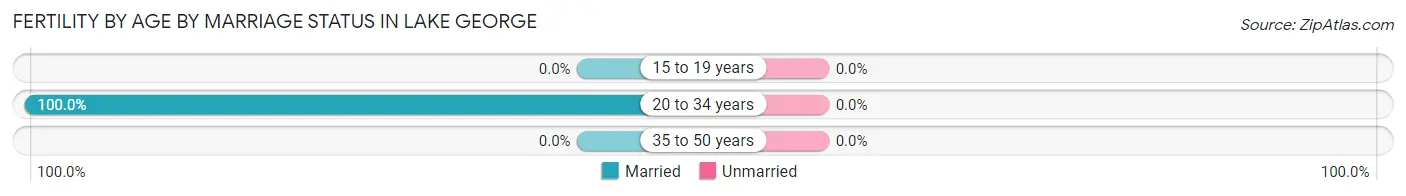
| Age Bracket | Married | Unmarried |
| 15 to 19 years | 0 (0.0%) | 0 (0.0%) |
| 20 to 34 years | 4 (100.0%) | 0 (0.0%) |
| 35 to 50 years | 0 (0.0%) | 0 (0.0%) |
| Total | 4 (100.0%) | 0 (0.0%) |
Fertility by Education in Lake George
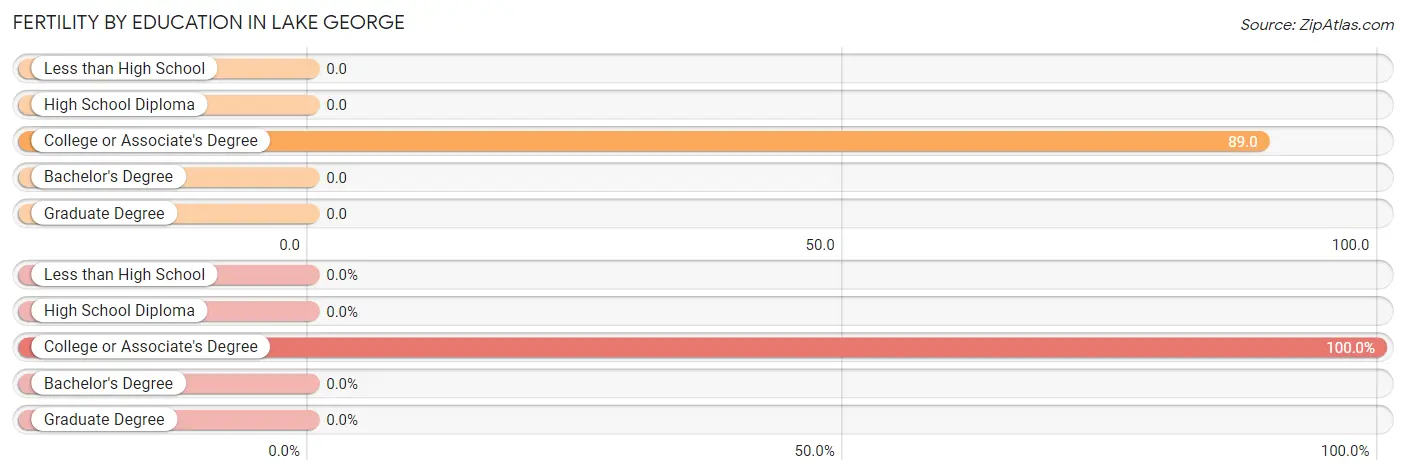
| Educational Attainment | Women with Births | Births / 1,000 Women |
| Less than High School | 0 (0.0%) | 0.0 |
| High School Diploma | 0 (0.0%) | 0.0 |
| College or Associate's Degree | 4 (100.0%) | 89.0 |
| Bachelor's Degree | 0 (0.0%) | 0.0 |
| Graduate Degree | 0 (0.0%) | 0.0 |
| Total | 4 (100.0%) | 20.0 |
Fertility by Education by Marriage Status in Lake George
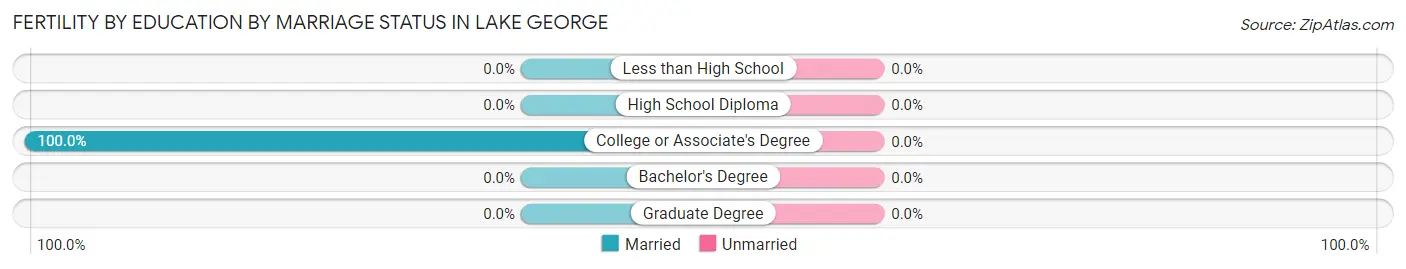
| Educational Attainment | Married | Unmarried |
| Less than High School | 0 (0.0%) | 0 (0.0%) |
| High School Diploma | 0 (0.0%) | 0 (0.0%) |
| College or Associate's Degree | 4 (100.0%) | 0 (0.0%) |
| Bachelor's Degree | 0 (0.0%) | 0 (0.0%) |
| Graduate Degree | 0 (0.0%) | 0 (0.0%) |
| Total | 4 (100.0%) | 0 (0.0%) |
Employment Characteristics in Lake George
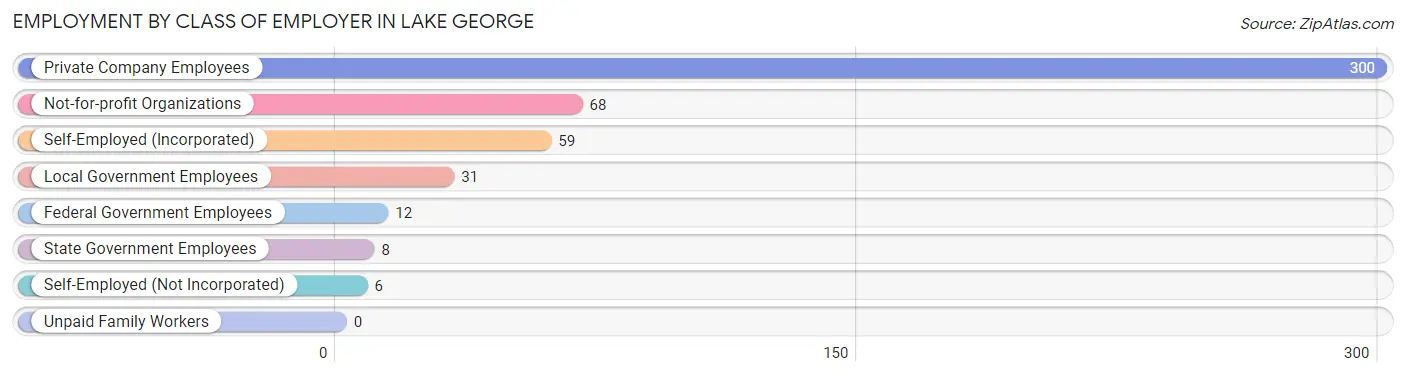
Employment by Class of Employer in Lake George
Among the 484 employed individuals in Lake George, private company employees (300 | 62.0%), not-for-profit organizations (68 | 14.1%), and self-employed (incorporated) (59 | 12.2%) make up the most common classes of employment.
| Employer Class | # Employees | % Employees |
| Private Company Employees | 300 | 62.0% |
| Self-Employed (Incorporated) | 59 | 12.2% |
| Self-Employed (Not Incorporated) | 6 | 1.2% |
| Not-for-profit Organizations | 68 | 14.1% |
| Local Government Employees | 31 | 6.4% |
| State Government Employees | 8 | 1.7% |
| Federal Government Employees | 12 | 2.5% |
| Unpaid Family Workers | 0 | 0.0% |
| Total | 484 | 100.0% |
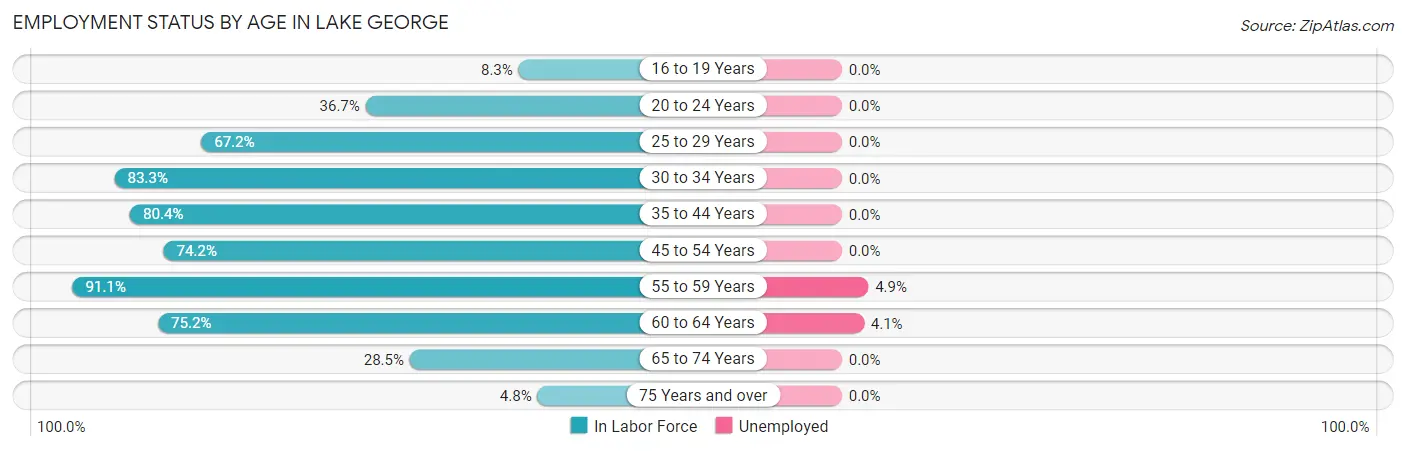
Employment Status by Age in Lake George
According to the labor force statistics for Lake George, out of the total population over 16 years of age (877), 56.9% or 499 individuals are in the labor force, with 1.2% or 6 of them unemployed. The age group with the highest labor force participation rate is 55 to 59 years, with 91.1% or 41 individuals in the labor force. Within the labor force, the 55 to 59 years age range has the highest percentage of unemployed individuals, with 4.9% or 2 of them being unemployed.
| Age Bracket | In Labor Force | Unemployed |
| 16 to 19 Years | 1 (8.3%) | 0 (0.0%) |
| 20 to 24 Years | 40 (36.7%) | 0 (0.0%) |
| 25 to 29 Years | 88 (67.2%) | 0 (0.0%) |
| 30 to 34 Years | 35 (83.3%) | 0 (0.0%) |
| 35 to 44 Years | 41 (80.4%) | 0 (0.0%) |
| 45 to 54 Years | 112 (74.2%) | 0 (0.0%) |
| 55 to 59 Years | 41 (91.1%) | 2 (4.9%) |
| 60 to 64 Years | 97 (75.2%) | 4 (4.1%) |
| 65 to 74 Years | 41 (28.5%) | 0 (0.0%) |
| 75 Years and over | 3 (4.8%) | 0 (0.0%) |
| Total | 499 (56.9%) | 6 (1.2%) |
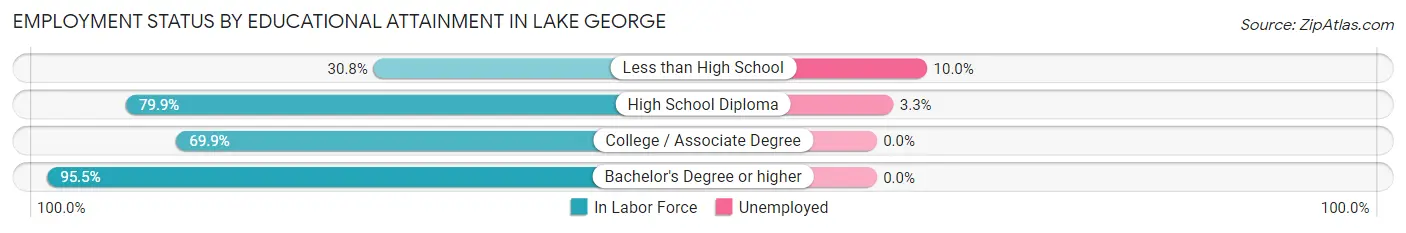
Employment Status by Educational Attainment in Lake George
According to labor force statistics for Lake George, 75.4% of individuals (414) out of the total population between 25 and 64 years of age (549) are in the labor force, with 1.4% or 6 of them being unemployed. The group with the highest labor force participation rate are those with the educational attainment of bachelor's degree or higher, with 95.5% or 150 individuals in the labor force. Within the labor force, individuals with less than high school education have the highest percentage of unemployment, with 10.0% or 2 of them being unemployed.
| Educational Attainment | In Labor Force | Unemployed |
| Less than High School | 20 (30.8%) | 6 (10.0%) |
| High School Diploma | 123 (79.9%) | 5 (3.3%) |
| College / Associate Degree | 121 (69.9%) | 0 (0.0%) |
| Bachelor's Degree or higher | 150 (95.5%) | 0 (0.0%) |
| Total | 414 (75.4%) | 8 (1.4%) |
Employment Occupations by Sex in Lake George
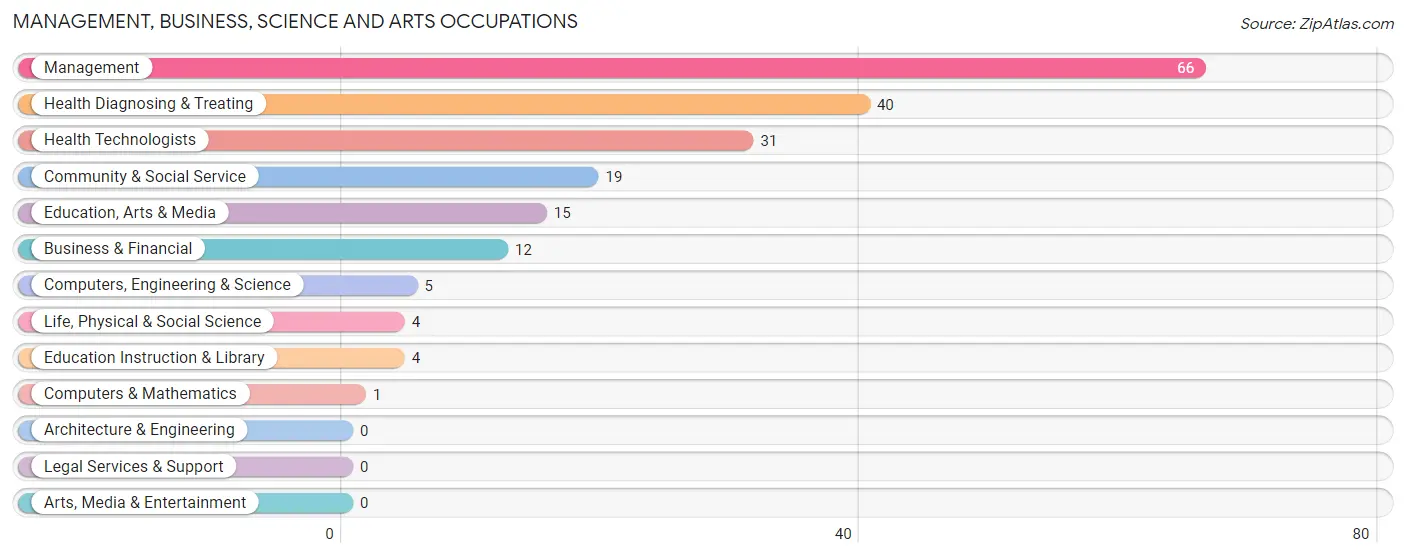
Management, Business, Science and Arts Occupations
The most common Management, Business, Science and Arts occupations in Lake George are Management (66 | 13.4%), Health Diagnosing & Treating (40 | 8.1%), Health Technologists (31 | 6.3%), Community & Social Service (19 | 3.8%), and Education, Arts & Media (15 | 3.0%).
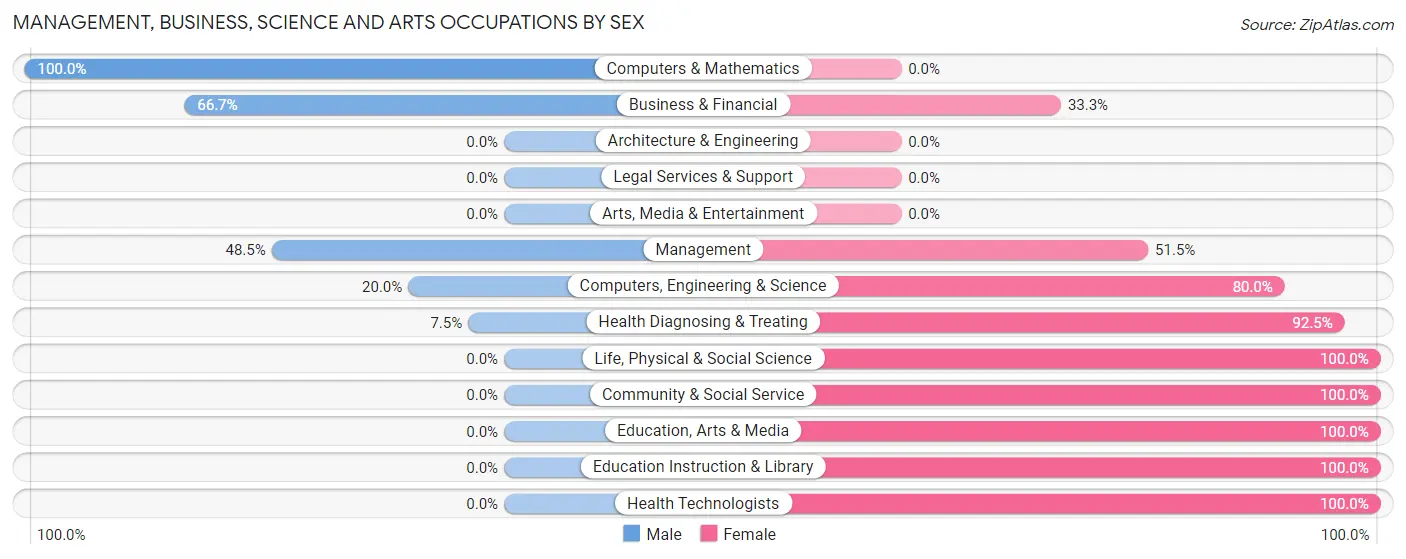
Management, Business, Science and Arts Occupations by Sex
Within the Management, Business, Science and Arts occupations in Lake George, the most male-oriented occupations are Computers & Mathematics (100.0%), Business & Financial (66.7%), and Management (48.5%), while the most female-oriented occupations are Life, Physical & Social Science (100.0%), Community & Social Service (100.0%), and Education, Arts & Media (100.0%).
| Occupation | Male | Female |
| Management | 32 (48.5%) | 34 (51.5%) |
| Business & Financial | 8 (66.7%) | 4 (33.3%) |
| Computers, Engineering & Science | 1 (20.0%) | 4 (80.0%) |
| Computers & Mathematics | 1 (100.0%) | 0 (0.0%) |
| Architecture & Engineering | 0 (0.0%) | 0 (0.0%) |
| Life, Physical & Social Science | 0 (0.0%) | 4 (100.0%) |
| Community & Social Service | 0 (0.0%) | 19 (100.0%) |
| Education, Arts & Media | 0 (0.0%) | 15 (100.0%) |
| Legal Services & Support | 0 (0.0%) | 0 (0.0%) |
| Education Instruction & Library | 0 (0.0%) | 4 (100.0%) |
| Arts, Media & Entertainment | 0 (0.0%) | 0 (0.0%) |
| Health Diagnosing & Treating | 3 (7.5%) | 37 (92.5%) |
| Health Technologists | 0 (0.0%) | 31 (100.0%) |
| Total (Category) | 44 (31.0%) | 98 (69.0%) |
| Total (Overall) | 250 (50.7%) | 243 (49.3%) |
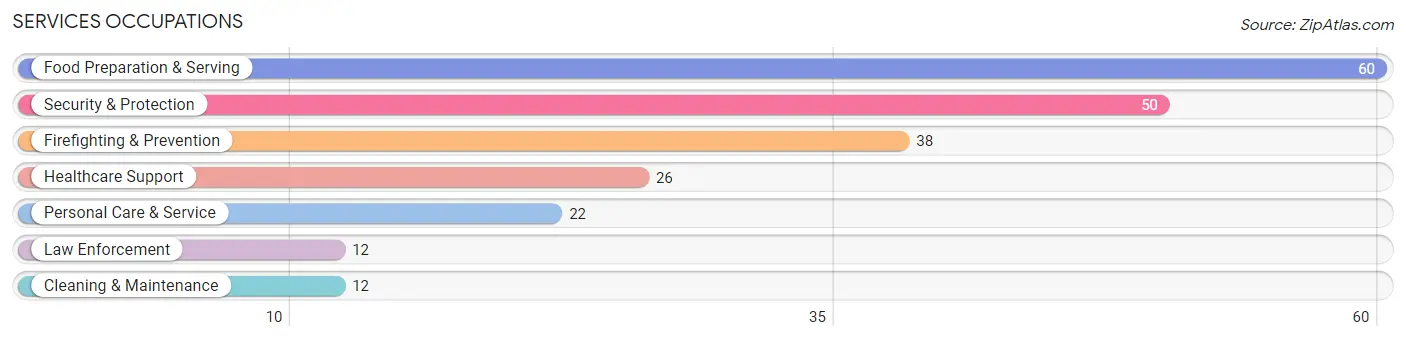
Services Occupations
The most common Services occupations in Lake George are Food Preparation & Serving (60 | 12.2%), Security & Protection (50 | 10.1%), Firefighting & Prevention (38 | 7.7%), Healthcare Support (26 | 5.3%), and Personal Care & Service (22 | 4.5%).
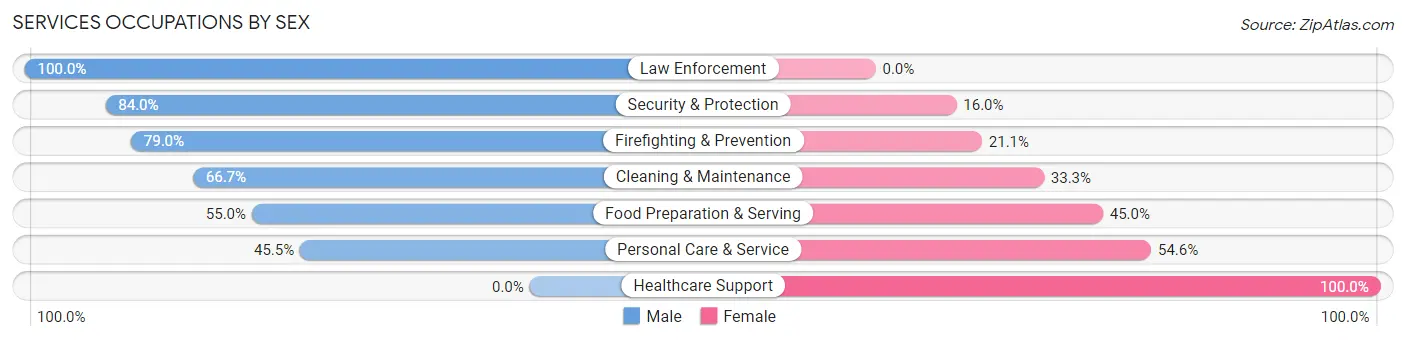
Services Occupations by Sex
Within the Services occupations in Lake George, the most male-oriented occupations are Law Enforcement (100.0%), Security & Protection (84.0%), and Firefighting & Prevention (78.9%), while the most female-oriented occupations are Healthcare Support (100.0%), Personal Care & Service (54.5%), and Food Preparation & Serving (45.0%).
| Occupation | Male | Female |
| Healthcare Support | 0 (0.0%) | 26 (100.0%) |
| Security & Protection | 42 (84.0%) | 8 (16.0%) |
| Firefighting & Prevention | 30 (78.9%) | 8 (21.0%) |
| Law Enforcement | 12 (100.0%) | 0 (0.0%) |
| Food Preparation & Serving | 33 (55.0%) | 27 (45.0%) |
| Cleaning & Maintenance | 8 (66.7%) | 4 (33.3%) |
| Personal Care & Service | 10 (45.5%) | 12 (54.5%) |
| Total (Category) | 93 (54.7%) | 77 (45.3%) |
| Total (Overall) | 250 (50.7%) | 243 (49.3%) |
Sales and Office Occupations
The most common Sales and Office occupations in Lake George are Sales & Related (61 | 12.4%), and Office & Administration (55 | 11.2%).
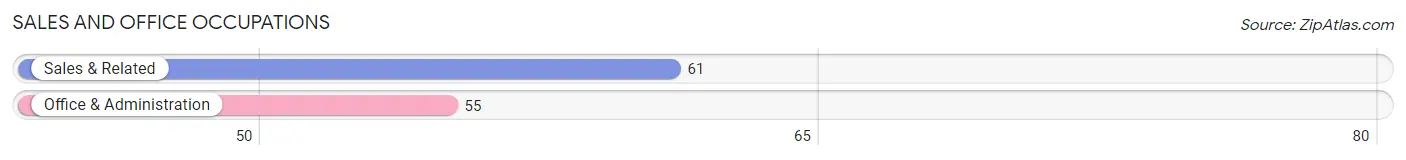
Sales and Office Occupations by Sex
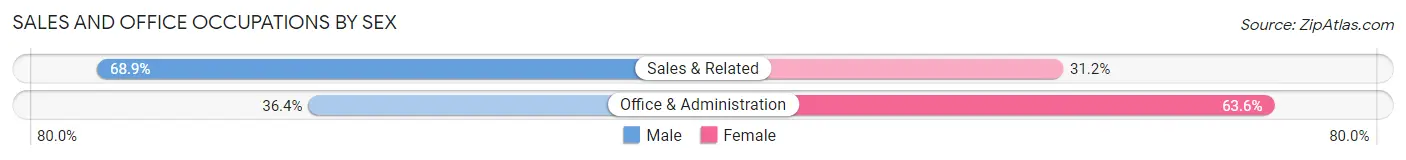
| Occupation | Male | Female |
| Sales & Related | 42 (68.9%) | 19 (31.1%) |
| Office & Administration | 20 (36.4%) | 35 (63.6%) |
| Total (Category) | 62 (53.4%) | 54 (46.6%) |
| Total (Overall) | 250 (50.7%) | 243 (49.3%) |
Natural Resources, Construction and Maintenance Occupations
The most common Natural Resources, Construction and Maintenance occupations in Lake George are Construction & Extraction (20 | 4.1%), and Installation, Maintenance & Repair (17 | 3.5%).
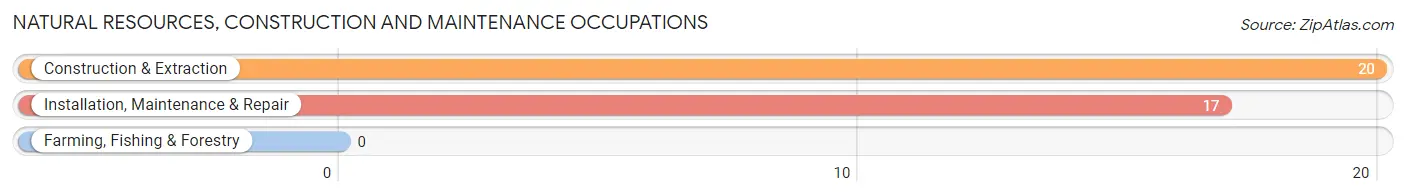
Natural Resources, Construction and Maintenance Occupations by Sex
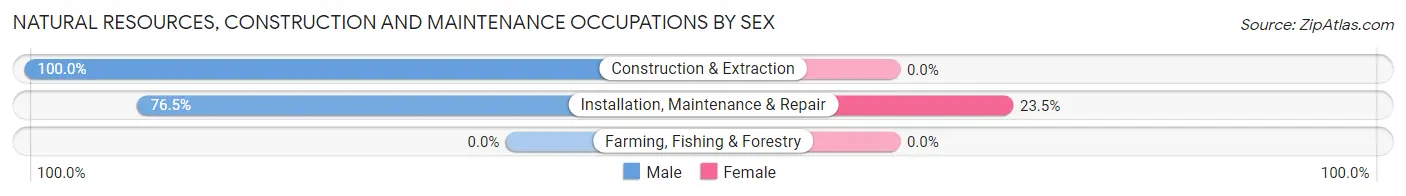
| Occupation | Male | Female |
| Farming, Fishing & Forestry | 0 (0.0%) | 0 (0.0%) |
| Construction & Extraction | 20 (100.0%) | 0 (0.0%) |
| Installation, Maintenance & Repair | 13 (76.5%) | 4 (23.5%) |
| Total (Category) | 33 (89.2%) | 4 (10.8%) |
| Total (Overall) | 250 (50.7%) | 243 (49.3%) |
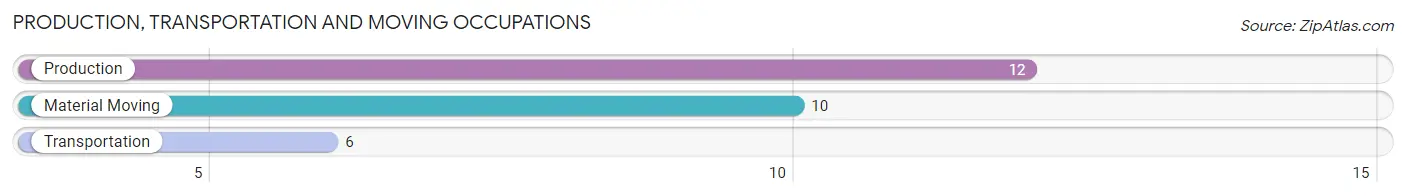
Production, Transportation and Moving Occupations
The most common Production, Transportation and Moving occupations in Lake George are Production (12 | 2.4%), Material Moving (10 | 2.0%), and Transportation (6 | 1.2%).
Production, Transportation and Moving Occupations by Sex
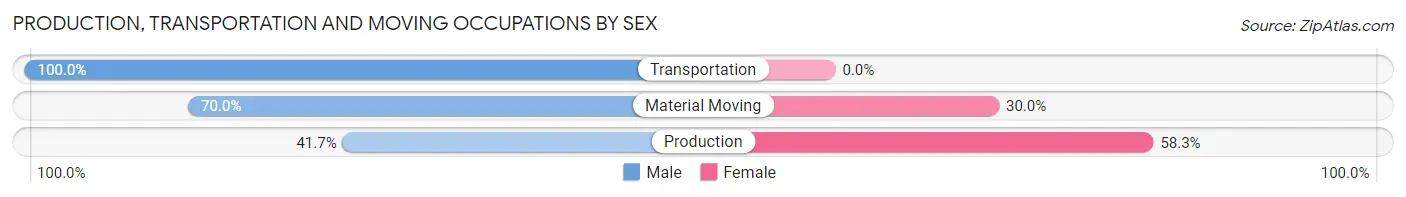
| Occupation | Male | Female |
| Production | 5 (41.7%) | 7 (58.3%) |
| Transportation | 6 (100.0%) | 0 (0.0%) |
| Material Moving | 7 (70.0%) | 3 (30.0%) |
| Total (Category) | 18 (64.3%) | 10 (35.7%) |
| Total (Overall) | 250 (50.7%) | 243 (49.3%) |
Employment Industries by Sex in Lake George
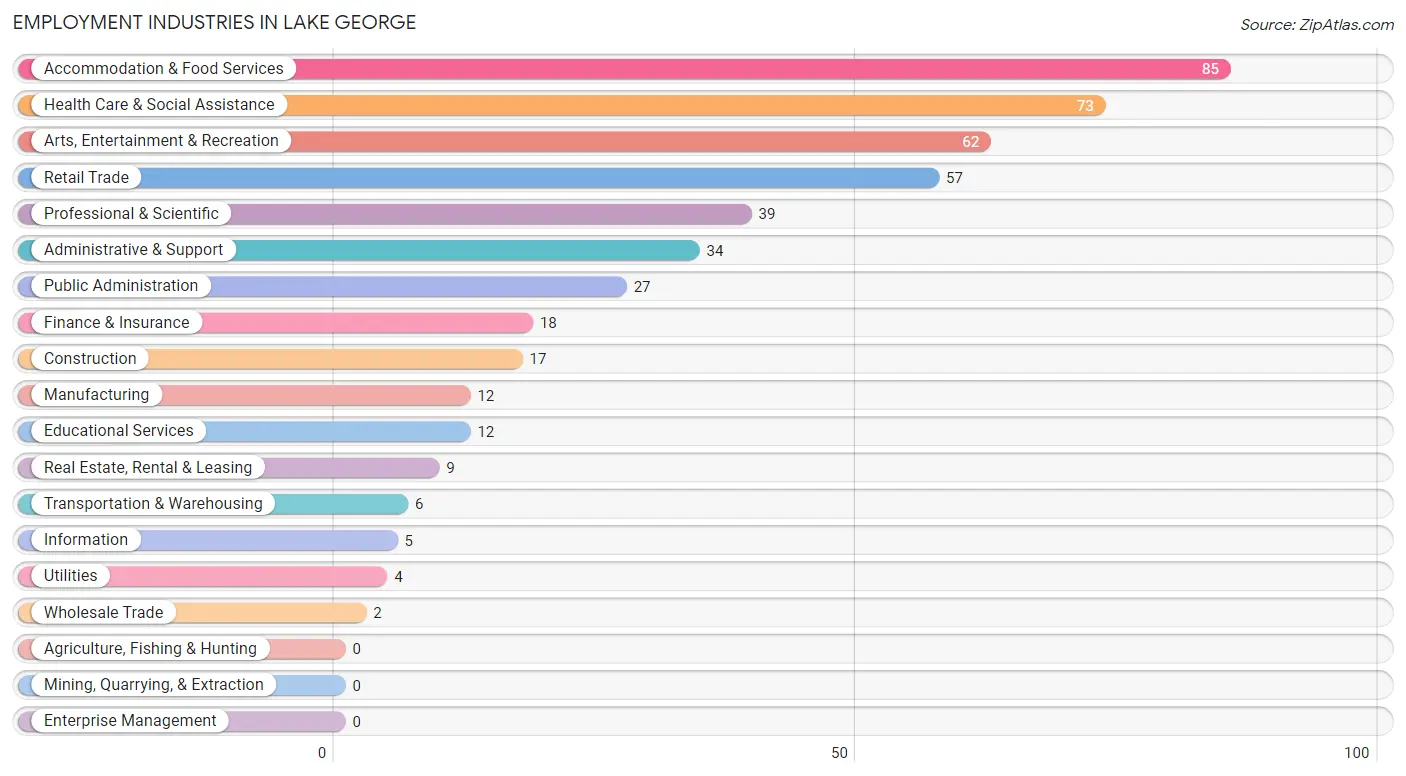
Employment Industries in Lake George
The major employment industries in Lake George include Accommodation & Food Services (85 | 17.2%), Health Care & Social Assistance (73 | 14.8%), Arts, Entertainment & Recreation (62 | 12.6%), Retail Trade (57 | 11.6%), and Professional & Scientific (39 | 7.9%).
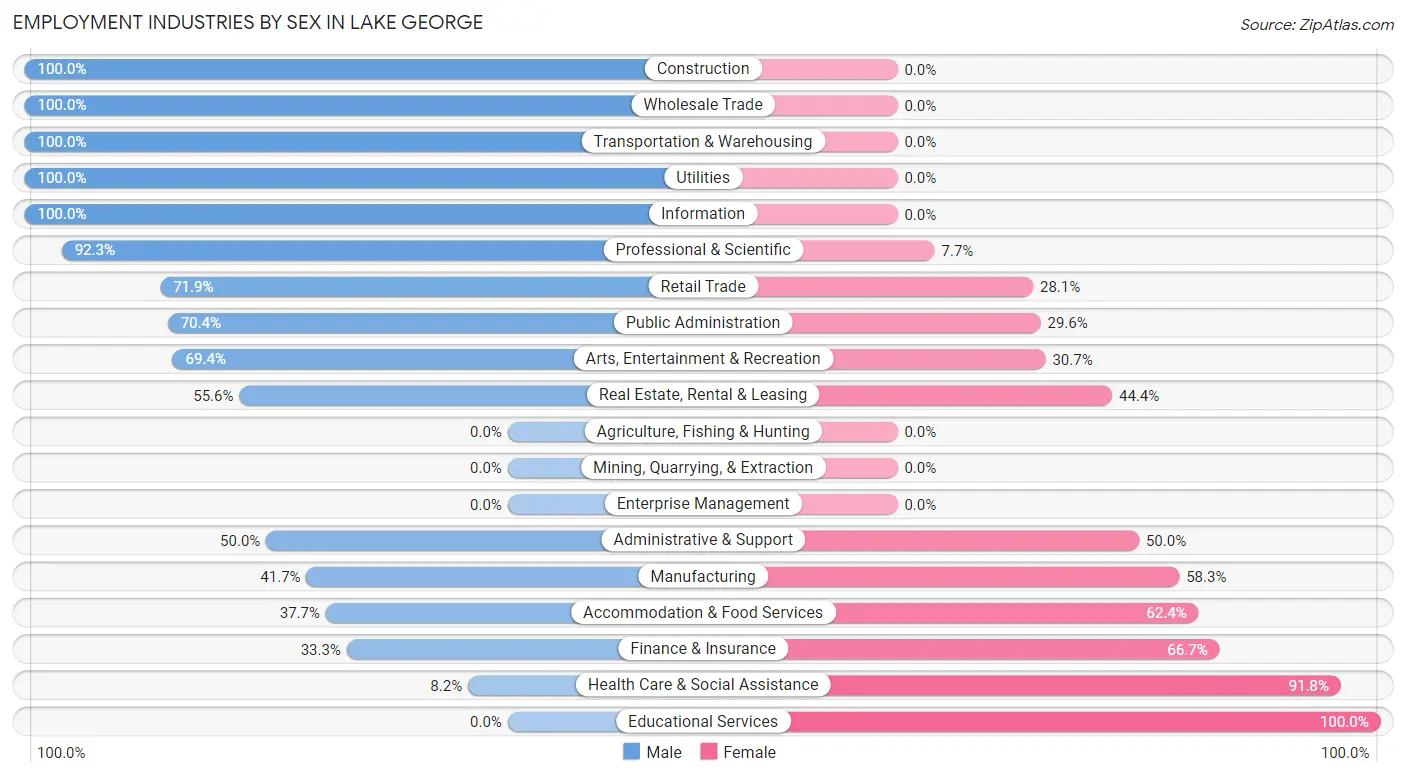
Employment Industries by Sex in Lake George
The Lake George industries that see more men than women are Construction (100.0%), Wholesale Trade (100.0%), and Transportation & Warehousing (100.0%), whereas the industries that tend to have a higher number of women are Educational Services (100.0%), Health Care & Social Assistance (91.8%), and Finance & Insurance (66.7%).
| Industry | Male | Female |
| Agriculture, Fishing & Hunting | 0 (0.0%) | 0 (0.0%) |
| Mining, Quarrying, & Extraction | 0 (0.0%) | 0 (0.0%) |
| Construction | 17 (100.0%) | 0 (0.0%) |
| Manufacturing | 5 (41.7%) | 7 (58.3%) |
| Wholesale Trade | 2 (100.0%) | 0 (0.0%) |
| Retail Trade | 41 (71.9%) | 16 (28.1%) |
| Transportation & Warehousing | 6 (100.0%) | 0 (0.0%) |
| Utilities | 4 (100.0%) | 0 (0.0%) |
| Information | 5 (100.0%) | 0 (0.0%) |
| Finance & Insurance | 6 (33.3%) | 12 (66.7%) |
| Real Estate, Rental & Leasing | 5 (55.6%) | 4 (44.4%) |
| Professional & Scientific | 36 (92.3%) | 3 (7.7%) |
| Enterprise Management | 0 (0.0%) | 0 (0.0%) |
| Administrative & Support | 17 (50.0%) | 17 (50.0%) |
| Educational Services | 0 (0.0%) | 12 (100.0%) |
| Health Care & Social Assistance | 6 (8.2%) | 67 (91.8%) |
| Arts, Entertainment & Recreation | 43 (69.4%) | 19 (30.6%) |
| Accommodation & Food Services | 32 (37.7%) | 53 (62.4%) |
| Public Administration | 19 (70.4%) | 8 (29.6%) |
| Total | 250 (50.7%) | 243 (49.3%) |
Education in Lake George
School Enrollment in Lake George
The most common levels of schooling among the 113 students in Lake George are college / undergraduate (62 | 54.9%), middle school (36 | 31.9%), and high school (13 | 11.5%).
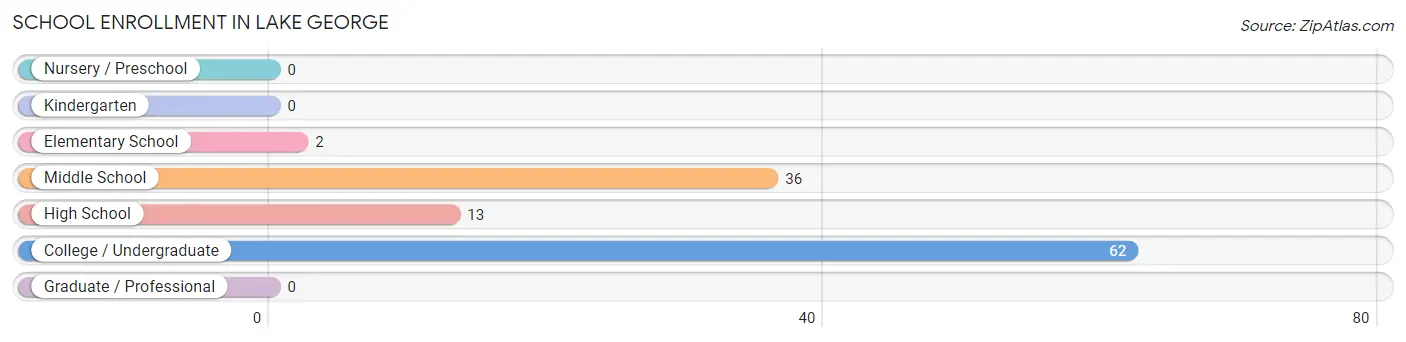
| School Level | # Students | % Students |
| Nursery / Preschool | 0 | 0.0% |
| Kindergarten | 0 | 0.0% |
| Elementary School | 2 | 1.8% |
| Middle School | 36 | 31.9% |
| High School | 13 | 11.5% |
| College / Undergraduate | 62 | 54.9% |
| Graduate / Professional | 0 | 0.0% |
| Total | 113 | 100.0% |
School Enrollment by Age by Funding Source in Lake George
Out of a total of 113 students who are enrolled in schools in Lake George, 29 (25.7%) attend a private institution, while the remaining 84 (74.3%) are enrolled in public schools. The age group of 18 to 19 year olds has the highest likelihood of being enrolled in private schools, with 11 (100.0% in the age bracket) enrolled. Conversely, the age group of 5 to 9 year old has the lowest likelihood of being enrolled in a private school, with 6 (100.0% in the age bracket) attending a public institution.
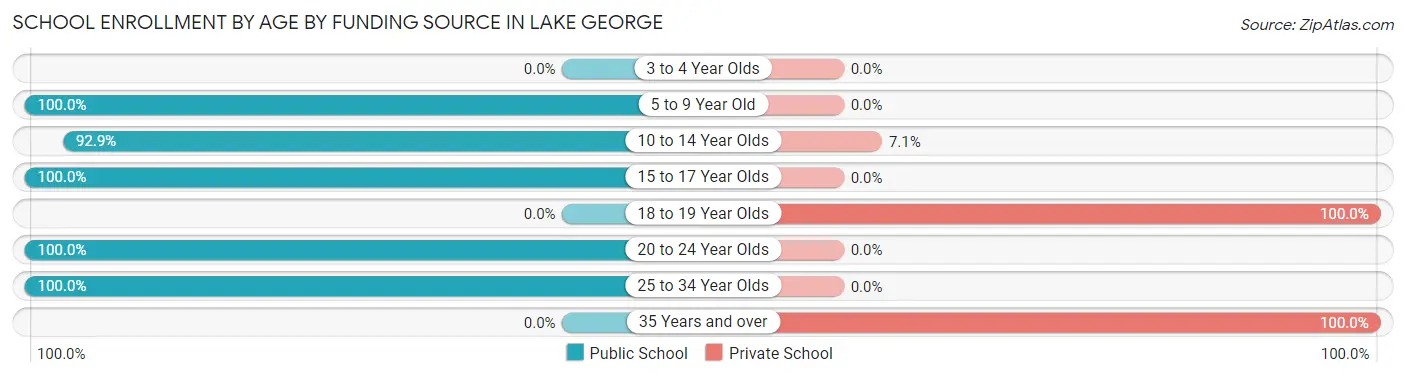
| Age Bracket | Public School | Private School |
| 3 to 4 Year Olds | 0 (0.0%) | 0 (0.0%) |
| 5 to 9 Year Old | 6 (100.0%) | 0 (0.0%) |
| 10 to 14 Year Olds | 39 (92.9%) | 3 (7.1%) |
| 15 to 17 Year Olds | 3 (100.0%) | 0 (0.0%) |
| 18 to 19 Year Olds | 0 (0.0%) | 11 (100.0%) |
| 20 to 24 Year Olds | 32 (100.0%) | 0 (0.0%) |
| 25 to 34 Year Olds | 4 (100.0%) | 0 (0.0%) |
| 35 Years and over | 0 (0.0%) | 15 (100.0%) |
| Total | 84 (74.3%) | 29 (25.7%) |
Educational Attainment by Field of Study in Lake George
Business (69 | 25.7%), social sciences (48 | 17.8%), psychology (28 | 10.4%), liberal arts & history (26 | 9.7%), and education (20 | 7.4%) are the most common fields of study among 269 individuals in Lake George who have obtained a bachelor's degree or higher.
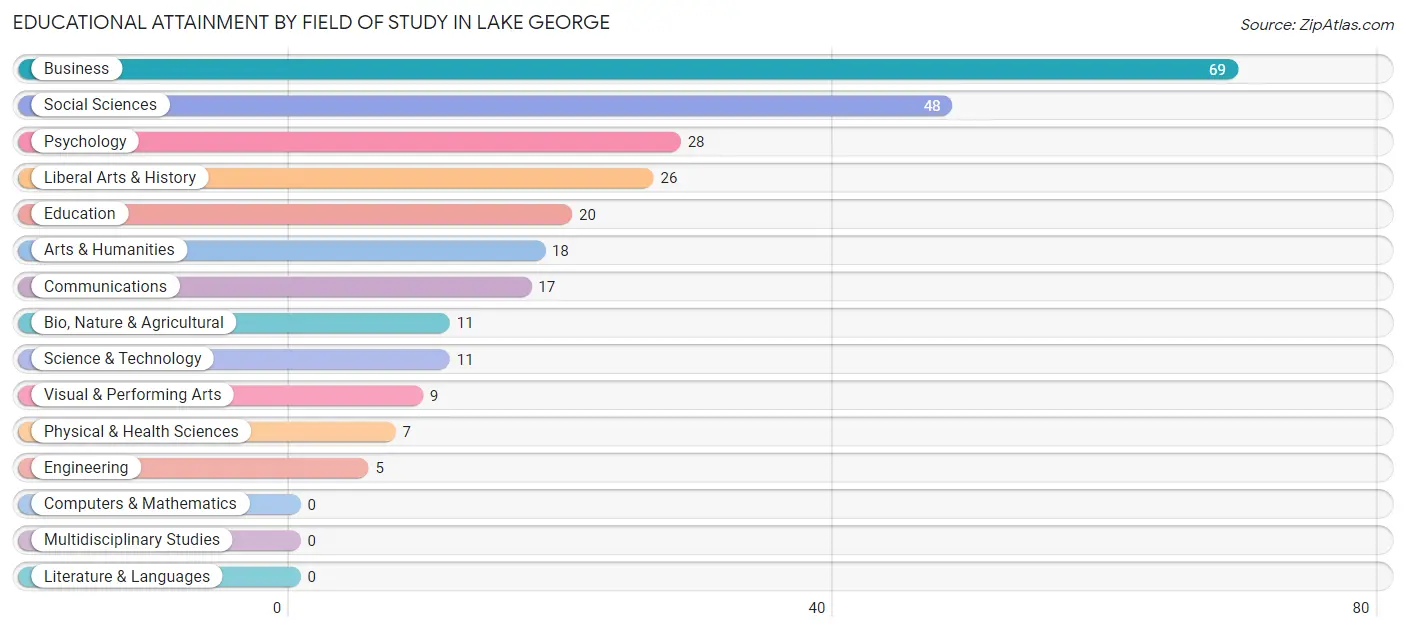
| Field of Study | # Graduates | % Graduates |
| Computers & Mathematics | 0 | 0.0% |
| Bio, Nature & Agricultural | 11 | 4.1% |
| Physical & Health Sciences | 7 | 2.6% |
| Psychology | 28 | 10.4% |
| Social Sciences | 48 | 17.8% |
| Engineering | 5 | 1.9% |
| Multidisciplinary Studies | 0 | 0.0% |
| Science & Technology | 11 | 4.1% |
| Business | 69 | 25.7% |
| Education | 20 | 7.4% |
| Literature & Languages | 0 | 0.0% |
| Liberal Arts & History | 26 | 9.7% |
| Visual & Performing Arts | 9 | 3.4% |
| Communications | 17 | 6.3% |
| Arts & Humanities | 18 | 6.7% |
| Total | 269 | 100.0% |
Transportation & Commute in Lake George
Vehicle Availability by Sex in Lake George
The most prevalent vehicle ownership categories in Lake George are males with 1 vehicle (106, accounting for 42.7%) and females with 1 vehicle (79, making up 44.9%).
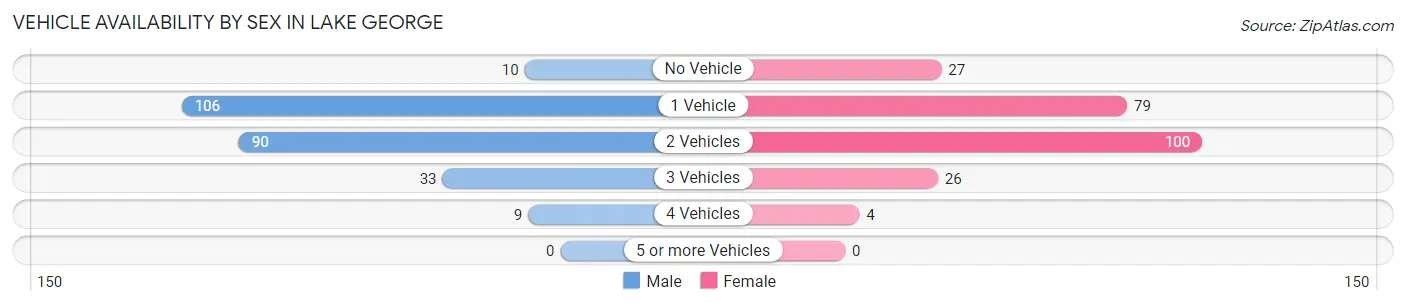
| Vehicles Available | Male | Female |
| No Vehicle | 10 (4.0%) | 27 (11.4%) |
| 1 Vehicle | 106 (42.7%) | 79 (33.5%) |
| 2 Vehicles | 90 (36.3%) | 100 (42.4%) |
| 3 Vehicles | 33 (13.3%) | 26 (11.0%) |
| 4 Vehicles | 9 (3.6%) | 4 (1.7%) |
| 5 or more Vehicles | 0 (0.0%) | 0 (0.0%) |
| Total | 248 (100.0%) | 236 (100.0%) |
Commute Time in Lake George
The most frequently occuring commute durations in Lake George are 20 to 24 minutes (135 commuters, 30.0%), 5 to 9 minutes (120 commuters, 26.7%), and 10 to 14 minutes (43 commuters, 9.6%).
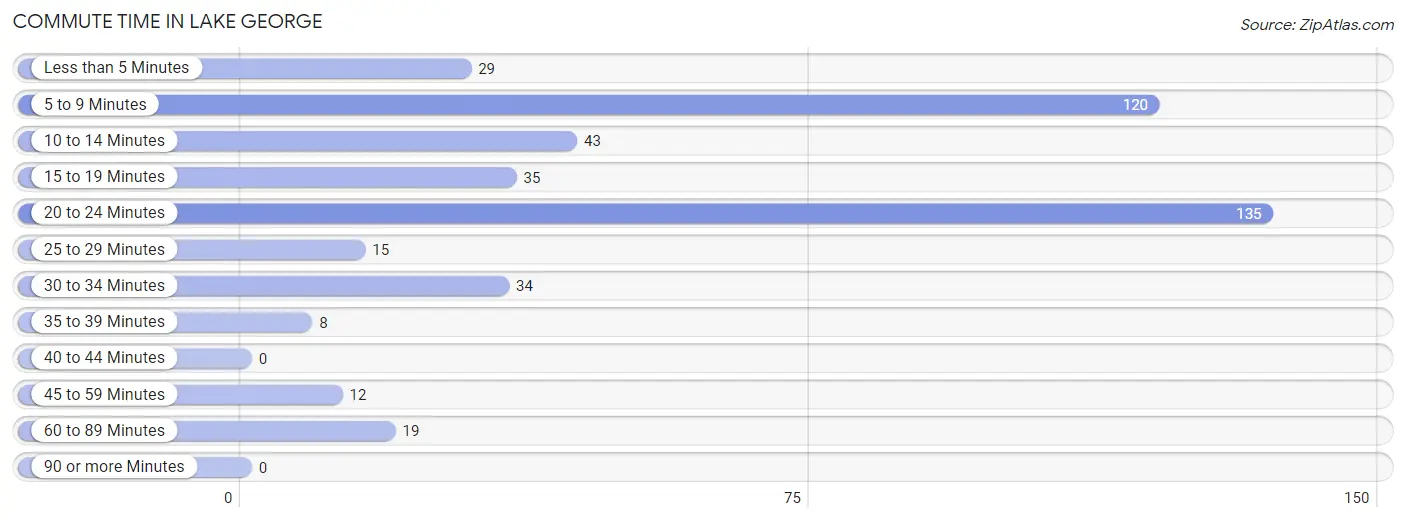
| Commute Time | # Commuters | % Commuters |
| Less than 5 Minutes | 29 | 6.4% |
| 5 to 9 Minutes | 120 | 26.7% |
| 10 to 14 Minutes | 43 | 9.6% |
| 15 to 19 Minutes | 35 | 7.8% |
| 20 to 24 Minutes | 135 | 30.0% |
| 25 to 29 Minutes | 15 | 3.3% |
| 30 to 34 Minutes | 34 | 7.6% |
| 35 to 39 Minutes | 8 | 1.8% |
| 40 to 44 Minutes | 0 | 0.0% |
| 45 to 59 Minutes | 12 | 2.7% |
| 60 to 89 Minutes | 19 | 4.2% |
| 90 or more Minutes | 0 | 0.0% |
Commute Time by Sex in Lake George
The most common commute times in Lake George are 5 to 9 minutes (79 commuters, 33.8%) for males and 20 to 24 minutes (75 commuters, 34.7%) for females.
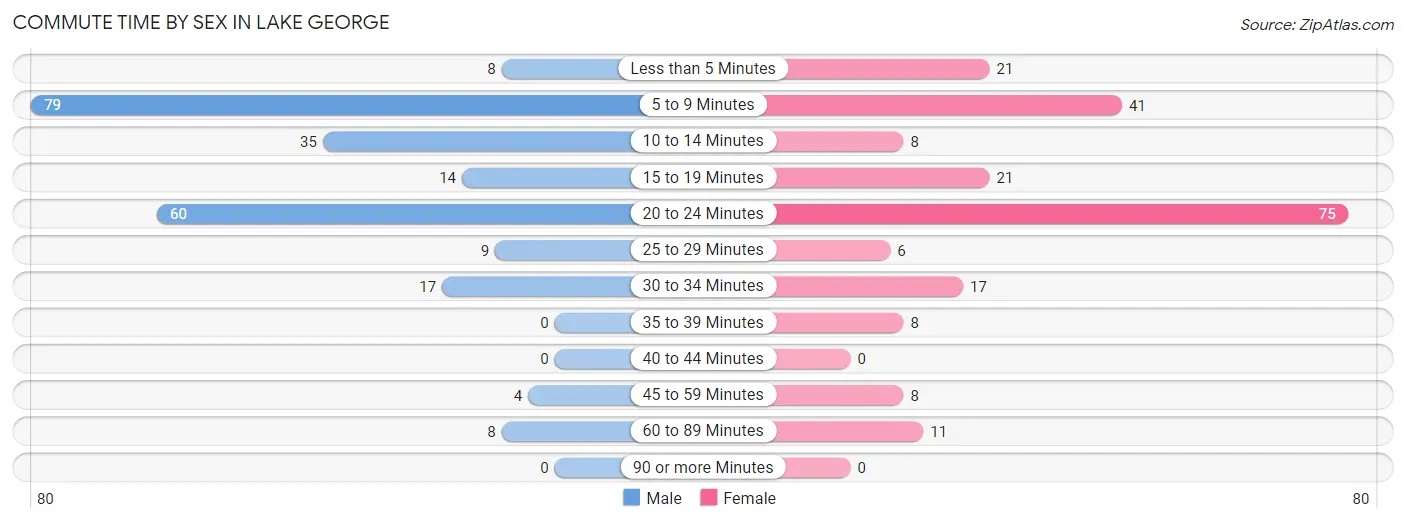
| Commute Time | Male | Female |
| Less than 5 Minutes | 8 (3.4%) | 21 (9.7%) |
| 5 to 9 Minutes | 79 (33.8%) | 41 (19.0%) |
| 10 to 14 Minutes | 35 (15.0%) | 8 (3.7%) |
| 15 to 19 Minutes | 14 (6.0%) | 21 (9.7%) |
| 20 to 24 Minutes | 60 (25.6%) | 75 (34.7%) |
| 25 to 29 Minutes | 9 (3.8%) | 6 (2.8%) |
| 30 to 34 Minutes | 17 (7.3%) | 17 (7.9%) |
| 35 to 39 Minutes | 0 (0.0%) | 8 (3.7%) |
| 40 to 44 Minutes | 0 (0.0%) | 0 (0.0%) |
| 45 to 59 Minutes | 4 (1.7%) | 8 (3.7%) |
| 60 to 89 Minutes | 8 (3.4%) | 11 (5.1%) |
| 90 or more Minutes | 0 (0.0%) | 0 (0.0%) |
Time of Departure to Work by Sex in Lake George
The most frequent times of departure to work in Lake George are 7:30 AM to 7:59 AM (49, 20.9%) for males and 7:30 AM to 7:59 AM (46, 21.3%) for females.
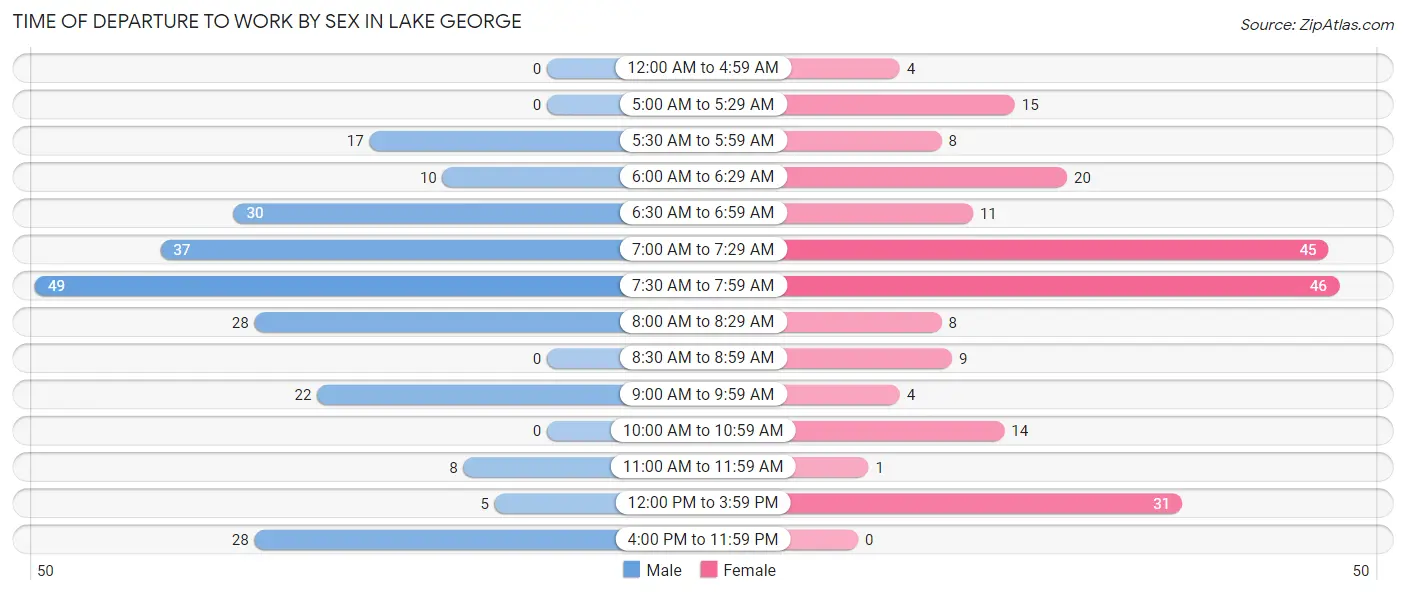
| Time of Departure | Male | Female |
| 12:00 AM to 4:59 AM | 0 (0.0%) | 4 (1.8%) |
| 5:00 AM to 5:29 AM | 0 (0.0%) | 15 (6.9%) |
| 5:30 AM to 5:59 AM | 17 (7.3%) | 8 (3.7%) |
| 6:00 AM to 6:29 AM | 10 (4.3%) | 20 (9.3%) |
| 6:30 AM to 6:59 AM | 30 (12.8%) | 11 (5.1%) |
| 7:00 AM to 7:29 AM | 37 (15.8%) | 45 (20.8%) |
| 7:30 AM to 7:59 AM | 49 (20.9%) | 46 (21.3%) |
| 8:00 AM to 8:29 AM | 28 (12.0%) | 8 (3.7%) |
| 8:30 AM to 8:59 AM | 0 (0.0%) | 9 (4.2%) |
| 9:00 AM to 9:59 AM | 22 (9.4%) | 4 (1.8%) |
| 10:00 AM to 10:59 AM | 0 (0.0%) | 14 (6.5%) |
| 11:00 AM to 11:59 AM | 8 (3.4%) | 1 (0.5%) |
| 12:00 PM to 3:59 PM | 5 (2.1%) | 31 (14.3%) |
| 4:00 PM to 11:59 PM | 28 (12.0%) | 0 (0.0%) |
| Total | 234 (100.0%) | 216 (100.0%) |
Housing Occupancy in Lake George
Occupancy by Ownership in Lake George
Of the total 515 dwellings in Lake George, owner-occupied units account for 256 (49.7%), while renter-occupied units make up 259 (50.3%).
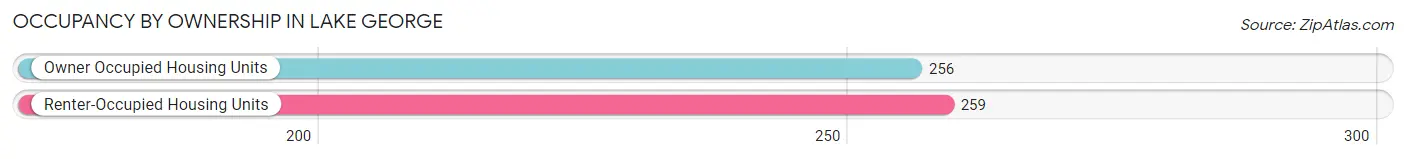
| Occupancy | # Housing Units | % Housing Units |
| Owner Occupied Housing Units | 256 | 49.7% |
| Renter-Occupied Housing Units | 259 | 50.3% |
| Total Occupied Housing Units | 515 | 100.0% |
Occupancy by Household Size in Lake George
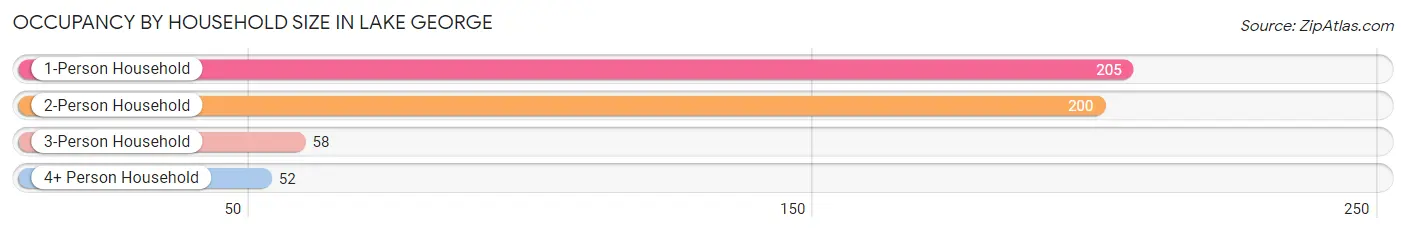
| Household Size | # Housing Units | % Housing Units |
| 1-Person Household | 205 | 39.8% |
| 2-Person Household | 200 | 38.8% |
| 3-Person Household | 58 | 11.3% |
| 4+ Person Household | 52 | 10.1% |
| Total Housing Units | 515 | 100.0% |
Occupancy by Ownership by Household Size in Lake George
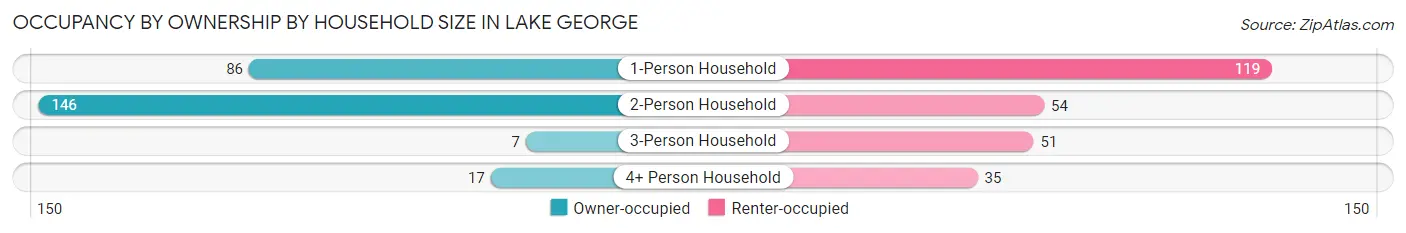
| Household Size | Owner-occupied | Renter-occupied |
| 1-Person Household | 86 (41.9%) | 119 (58.1%) |
| 2-Person Household | 146 (73.0%) | 54 (27.0%) |
| 3-Person Household | 7 (12.1%) | 51 (87.9%) |
| 4+ Person Household | 17 (32.7%) | 35 (67.3%) |
| Total Housing Units | 256 (49.7%) | 259 (50.3%) |
Occupancy by Educational Attainment in Lake George
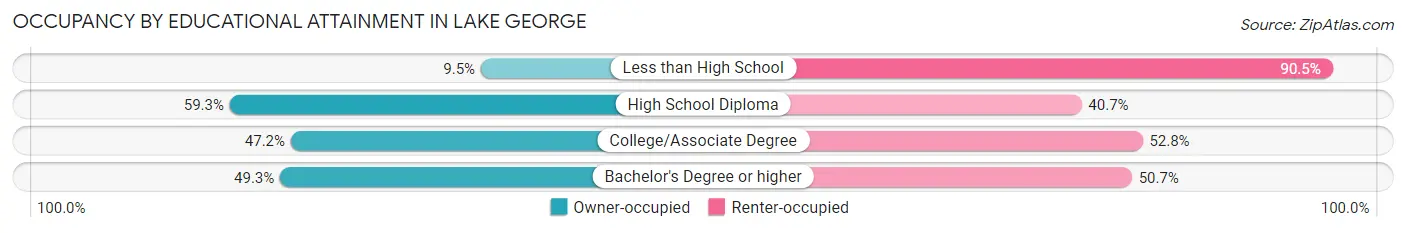
| Household Size | Owner-occupied | Renter-occupied |
| Less than High School | 2 (9.5%) | 19 (90.5%) |
| High School Diploma | 86 (59.3%) | 59 (40.7%) |
| College/Associate Degree | 93 (47.2%) | 104 (52.8%) |
| Bachelor's Degree or higher | 75 (49.3%) | 77 (50.7%) |
Occupancy by Age of Householder in Lake George
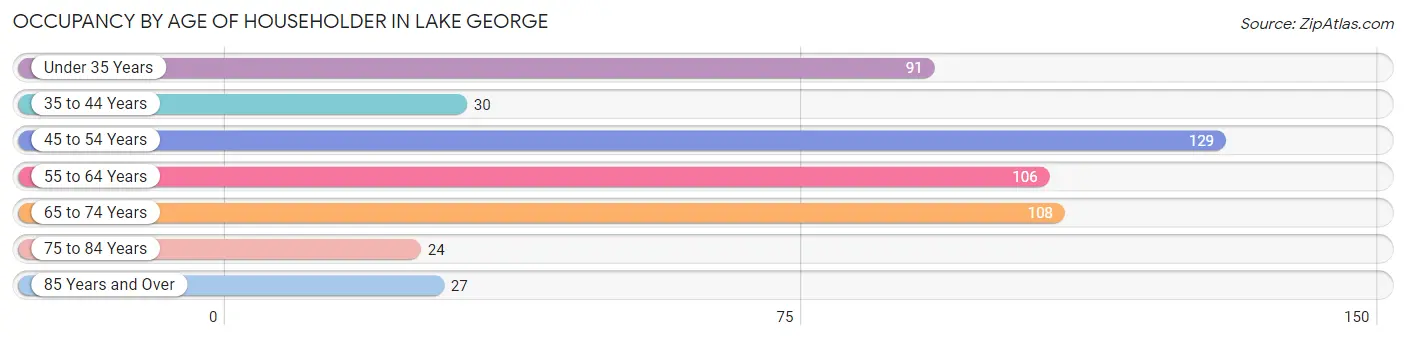
| Age Bracket | # Households | % Households |
| Under 35 Years | 91 | 17.7% |
| 35 to 44 Years | 30 | 5.8% |
| 45 to 54 Years | 129 | 25.1% |
| 55 to 64 Years | 106 | 20.6% |
| 65 to 74 Years | 108 | 21.0% |
| 75 to 84 Years | 24 | 4.7% |
| 85 Years and Over | 27 | 5.2% |
| Total | 515 | 100.0% |
Housing Finances in Lake George
Median Income by Occupancy in Lake George
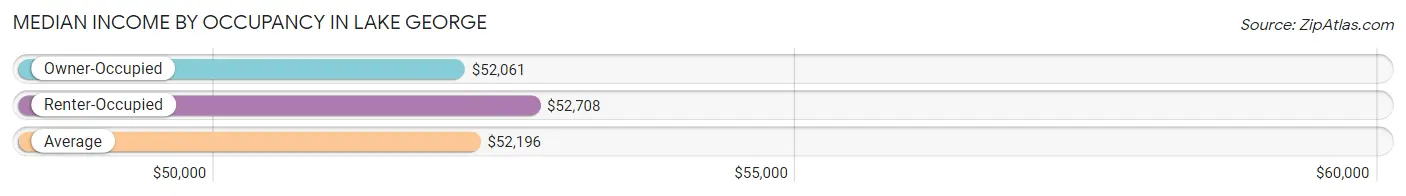
| Occupancy Type | # Households | Median Income |
| Owner-Occupied | 256 (49.7%) | $52,061 |
| Renter-Occupied | 259 (50.3%) | $52,708 |
| Average | 515 (100.0%) | $52,196 |
Occupancy by Householder Income Bracket in Lake George
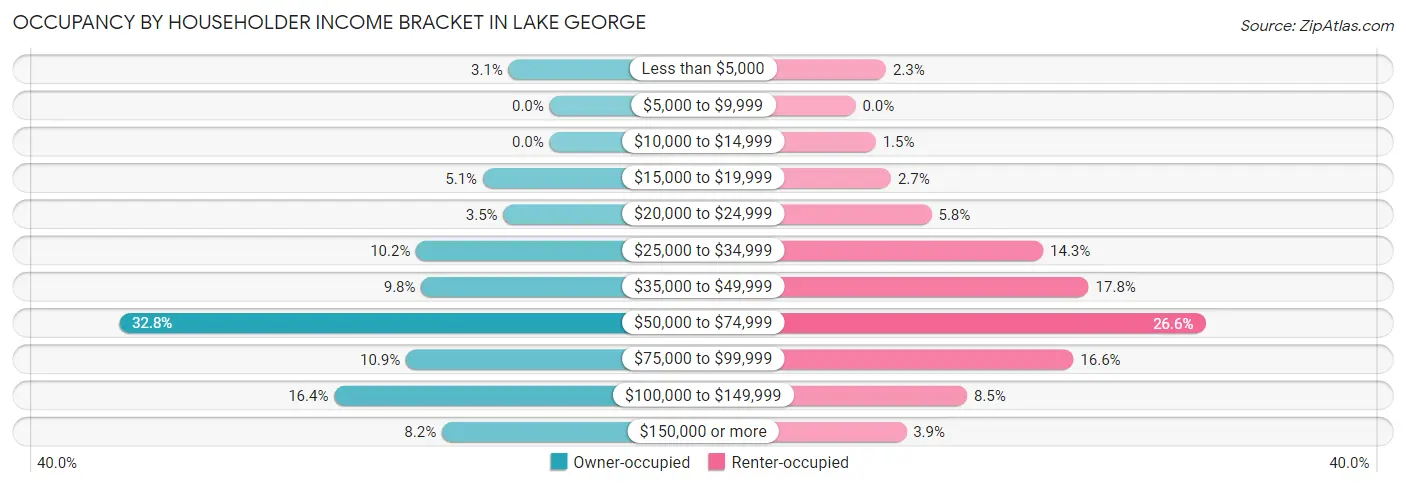
| Income Bracket | Owner-occupied | Renter-occupied |
| Less than $5,000 | 8 (3.1%) | 6 (2.3%) |
| $5,000 to $9,999 | 0 (0.0%) | 0 (0.0%) |
| $10,000 to $14,999 | 0 (0.0%) | 4 (1.5%) |
| $15,000 to $19,999 | 13 (5.1%) | 7 (2.7%) |
| $20,000 to $24,999 | 9 (3.5%) | 15 (5.8%) |
| $25,000 to $34,999 | 26 (10.2%) | 37 (14.3%) |
| $35,000 to $49,999 | 25 (9.8%) | 46 (17.8%) |
| $50,000 to $74,999 | 84 (32.8%) | 69 (26.6%) |
| $75,000 to $99,999 | 28 (10.9%) | 43 (16.6%) |
| $100,000 to $149,999 | 42 (16.4%) | 22 (8.5%) |
| $150,000 or more | 21 (8.2%) | 10 (3.9%) |
| Total | 256 (100.0%) | 259 (100.0%) |
Monthly Housing Cost Tiers in Lake George
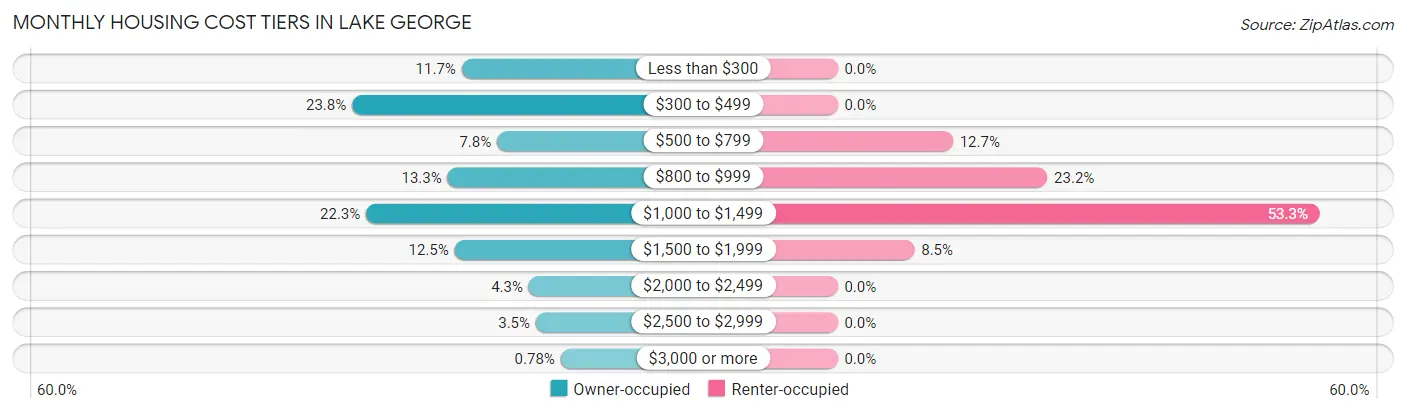
| Monthly Cost | Owner-occupied | Renter-occupied |
| Less than $300 | 30 (11.7%) | 0 (0.0%) |
| $300 to $499 | 61 (23.8%) | 0 (0.0%) |
| $500 to $799 | 20 (7.8%) | 33 (12.7%) |
| $800 to $999 | 34 (13.3%) | 60 (23.2%) |
| $1,000 to $1,499 | 57 (22.3%) | 138 (53.3%) |
| $1,500 to $1,999 | 32 (12.5%) | 22 (8.5%) |
| $2,000 to $2,499 | 11 (4.3%) | 0 (0.0%) |
| $2,500 to $2,999 | 9 (3.5%) | 0 (0.0%) |
| $3,000 or more | 2 (0.8%) | 0 (0.0%) |
| Total | 256 (100.0%) | 259 (100.0%) |
Physical Housing Characteristics in Lake George
Housing Structures in Lake George
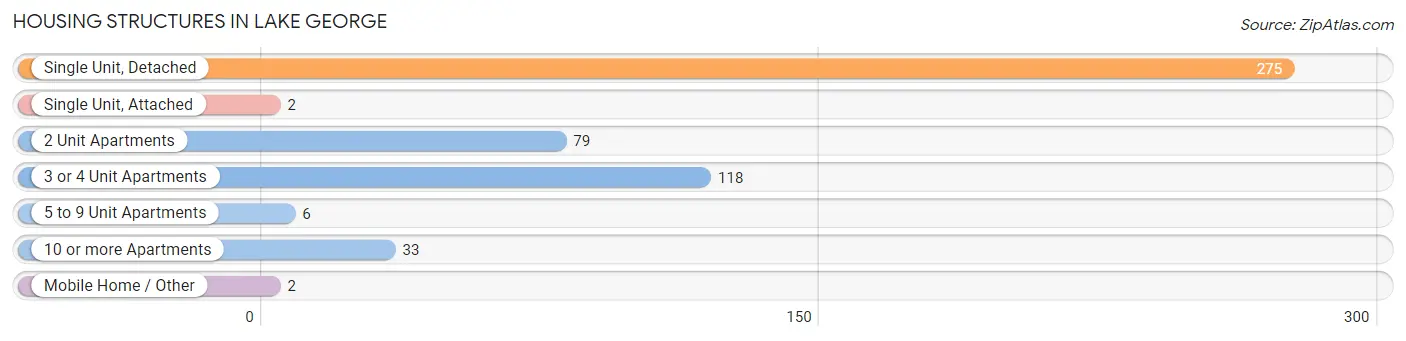
| Structure Type | # Housing Units | % Housing Units |
| Single Unit, Detached | 275 | 53.4% |
| Single Unit, Attached | 2 | 0.4% |
| 2 Unit Apartments | 79 | 15.3% |
| 3 or 4 Unit Apartments | 118 | 22.9% |
| 5 to 9 Unit Apartments | 6 | 1.2% |
| 10 or more Apartments | 33 | 6.4% |
| Mobile Home / Other | 2 | 0.4% |
| Total | 515 | 100.0% |
Housing Structures by Occupancy in Lake George
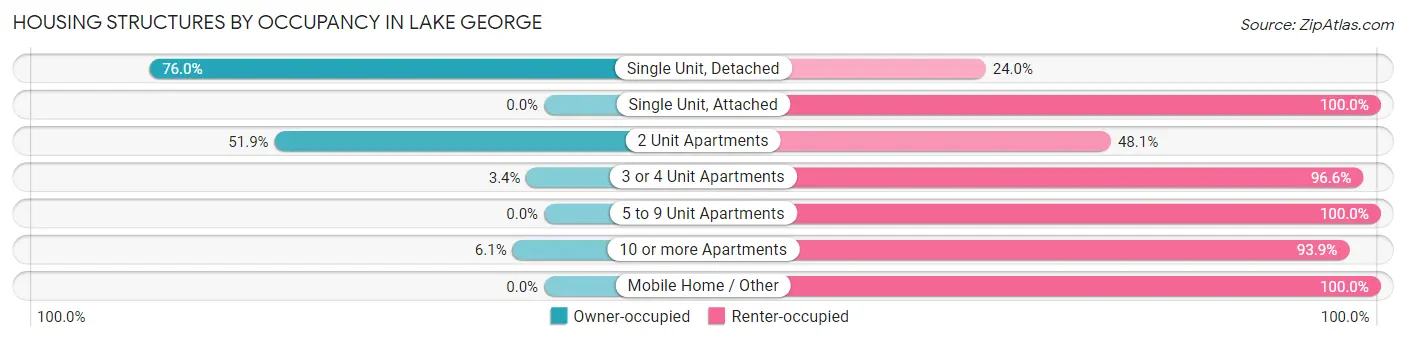
| Structure Type | Owner-occupied | Renter-occupied |
| Single Unit, Detached | 209 (76.0%) | 66 (24.0%) |
| Single Unit, Attached | 0 (0.0%) | 2 (100.0%) |
| 2 Unit Apartments | 41 (51.9%) | 38 (48.1%) |
| 3 or 4 Unit Apartments | 4 (3.4%) | 114 (96.6%) |
| 5 to 9 Unit Apartments | 0 (0.0%) | 6 (100.0%) |
| 10 or more Apartments | 2 (6.1%) | 31 (93.9%) |
| Mobile Home / Other | 0 (0.0%) | 2 (100.0%) |
| Total | 256 (49.7%) | 259 (50.3%) |
Housing Structures by Number of Rooms in Lake George
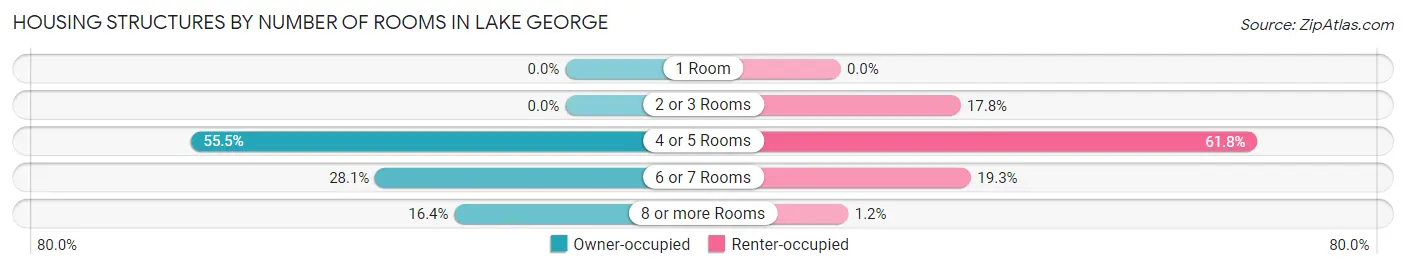
| Number of Rooms | Owner-occupied | Renter-occupied |
| 1 Room | 0 (0.0%) | 0 (0.0%) |
| 2 or 3 Rooms | 0 (0.0%) | 46 (17.8%) |
| 4 or 5 Rooms | 142 (55.5%) | 160 (61.8%) |
| 6 or 7 Rooms | 72 (28.1%) | 50 (19.3%) |
| 8 or more Rooms | 42 (16.4%) | 3 (1.2%) |
| Total | 256 (100.0%) | 259 (100.0%) |
Housing Structure by Heating Type in Lake George
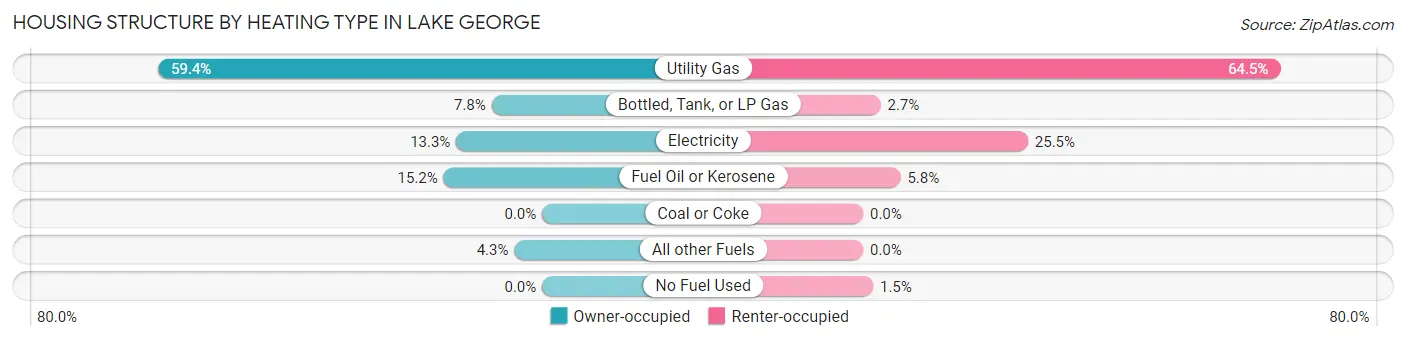
| Heating Type | Owner-occupied | Renter-occupied |
| Utility Gas | 152 (59.4%) | 167 (64.5%) |
| Bottled, Tank, or LP Gas | 20 (7.8%) | 7 (2.7%) |
| Electricity | 34 (13.3%) | 66 (25.5%) |
| Fuel Oil or Kerosene | 39 (15.2%) | 15 (5.8%) |
| Coal or Coke | 0 (0.0%) | 0 (0.0%) |
| All other Fuels | 11 (4.3%) | 0 (0.0%) |
| No Fuel Used | 0 (0.0%) | 4 (1.5%) |
| Total | 256 (100.0%) | 259 (100.0%) |
Household Vehicle Usage in Lake George
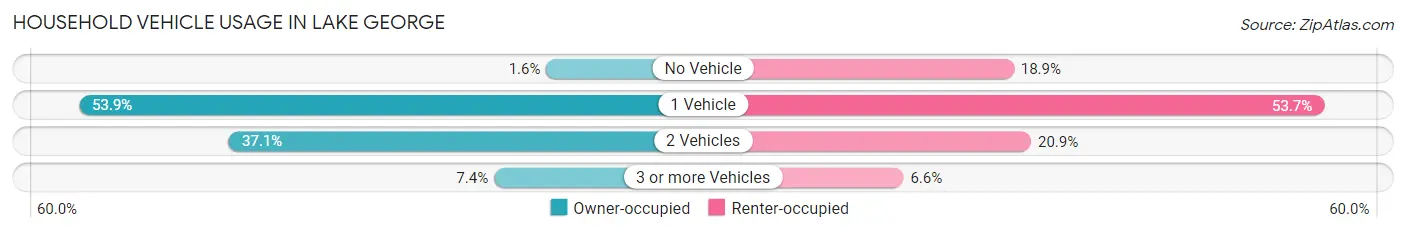
| Vehicles per Household | Owner-occupied | Renter-occupied |
| No Vehicle | 4 (1.6%) | 49 (18.9%) |
| 1 Vehicle | 138 (53.9%) | 139 (53.7%) |
| 2 Vehicles | 95 (37.1%) | 54 (20.8%) |
| 3 or more Vehicles | 19 (7.4%) | 17 (6.6%) |
| Total | 256 (100.0%) | 259 (100.0%) |
Real Estate & Mortgages in Lake George
Real Estate and Mortgage Overview in Lake George
| Characteristic | Without Mortgage | With Mortgage |
| Housing Units | 159 | 97 |
| Median Property Value | $276,200 | $256,000 |
| Median Household Income | $51,118 | $19 |
| Monthly Housing Costs | $423 | $2 |
| Real Estate Taxes | $2,920 | $4 |
Property Value by Mortgage Status in Lake George
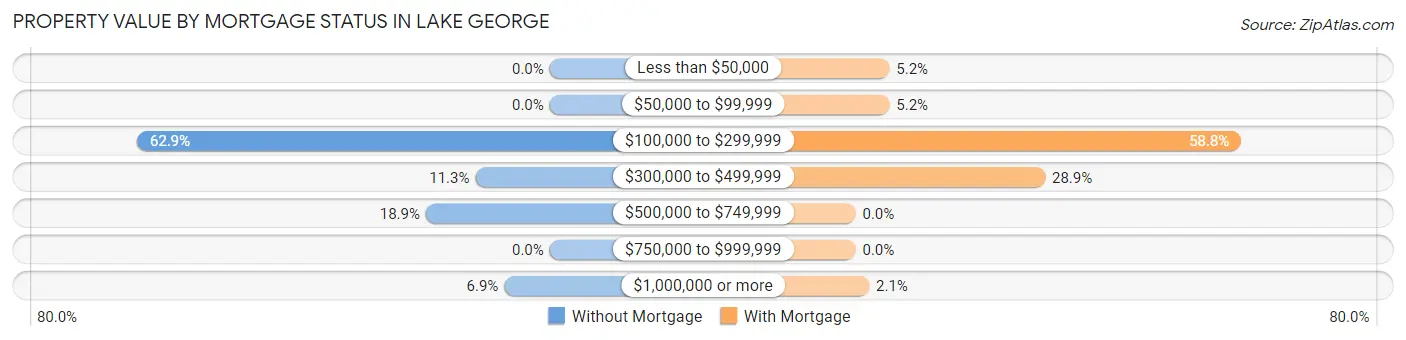
| Property Value | Without Mortgage | With Mortgage |
| Less than $50,000 | 0 (0.0%) | 5 (5.1%) |
| $50,000 to $99,999 | 0 (0.0%) | 5 (5.1%) |
| $100,000 to $299,999 | 100 (62.9%) | 57 (58.8%) |
| $300,000 to $499,999 | 18 (11.3%) | 28 (28.9%) |
| $500,000 to $749,999 | 30 (18.9%) | 0 (0.0%) |
| $750,000 to $999,999 | 0 (0.0%) | 0 (0.0%) |
| $1,000,000 or more | 11 (6.9%) | 2 (2.1%) |
| Total | 159 (100.0%) | 97 (100.0%) |
Household Income by Mortgage Status in Lake George
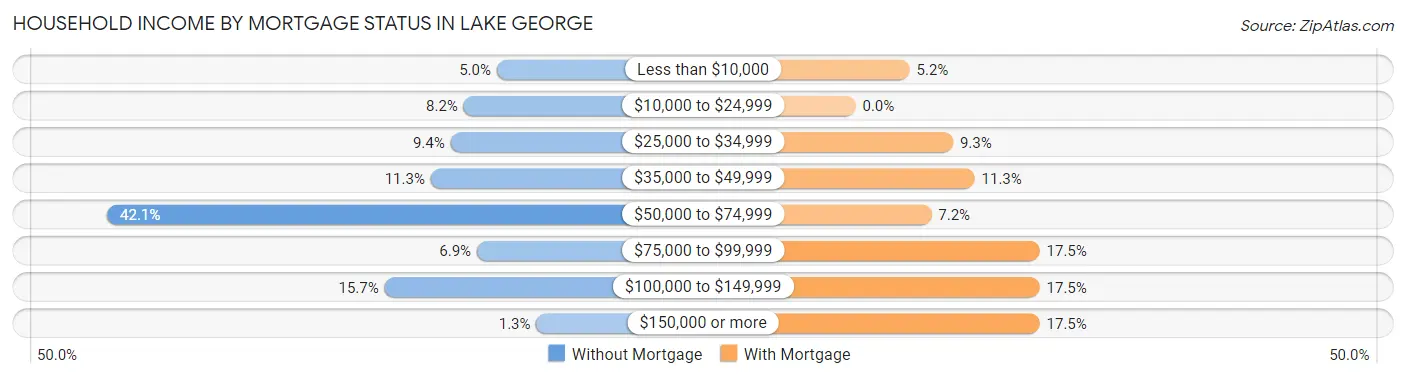
| Household Income | Without Mortgage | With Mortgage |
| Less than $10,000 | 8 (5.0%) | 5 (5.1%) |
| $10,000 to $24,999 | 13 (8.2%) | 0 (0.0%) |
| $25,000 to $34,999 | 15 (9.4%) | 9 (9.3%) |
| $35,000 to $49,999 | 18 (11.3%) | 11 (11.3%) |
| $50,000 to $74,999 | 67 (42.1%) | 7 (7.2%) |
| $75,000 to $99,999 | 11 (6.9%) | 17 (17.5%) |
| $100,000 to $149,999 | 25 (15.7%) | 17 (17.5%) |
| $150,000 or more | 2 (1.3%) | 17 (17.5%) |
| Total | 159 (100.0%) | 97 (100.0%) |
Property Value to Household Income Ratio in Lake George
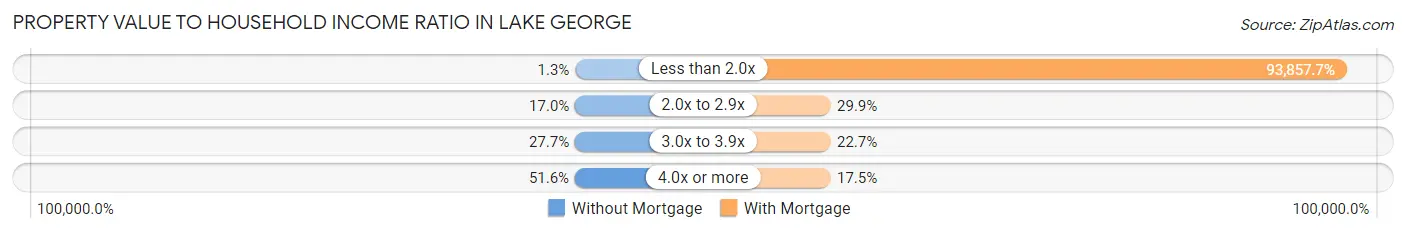
| Value-to-Income Ratio | Without Mortgage | With Mortgage |
| Less than 2.0x | 2 (1.3%) | 91,042 (93,857.7%) |
| 2.0x to 2.9x | 27 (17.0%) | 29 (29.9%) |
| 3.0x to 3.9x | 44 (27.7%) | 22 (22.7%) |
| 4.0x or more | 82 (51.6%) | 17 (17.5%) |
| Total | 159 (100.0%) | 97 (100.0%) |
Real Estate Taxes by Mortgage Status in Lake George
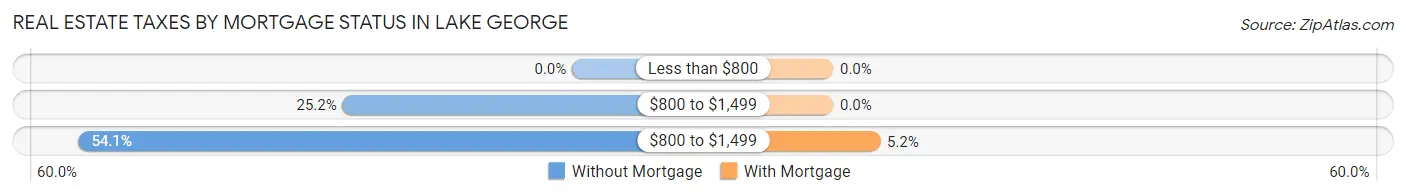
| Property Taxes | Without Mortgage | With Mortgage |
| Less than $800 | 0 (0.0%) | 0 (0.0%) |
| $800 to $1,499 | 40 (25.2%) | 0 (0.0%) |
| $800 to $1,499 | 86 (54.1%) | 5 (5.1%) |
| Total | 159 (100.0%) | 97 (100.0%) |
Health & Disability in Lake George
Health Insurance Coverage by Age in Lake George
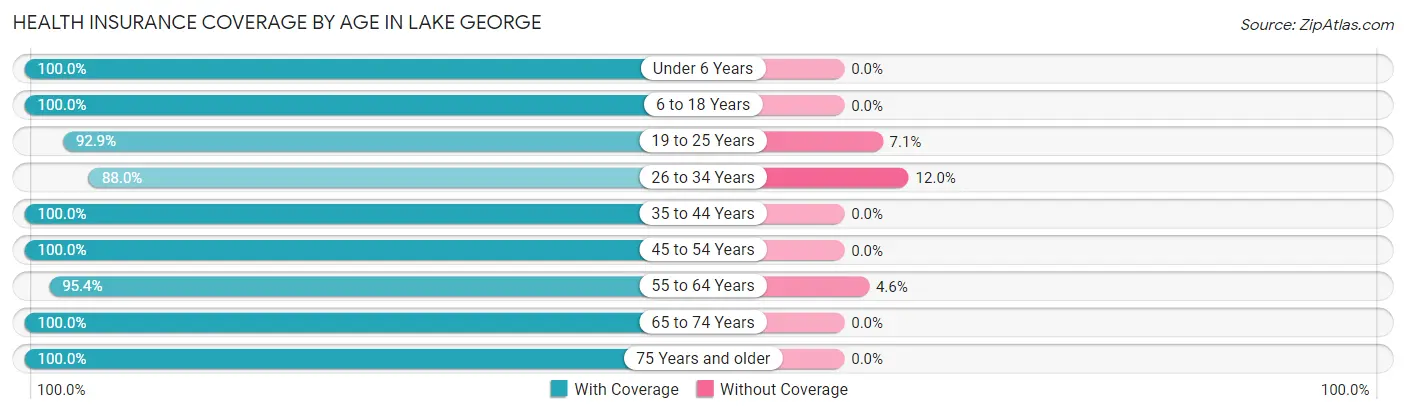
| Age Bracket | With Coverage | Without Coverage |
| Under 6 Years | 16 (100.0%) | 0 (0.0%) |
| 6 to 18 Years | 62 (100.0%) | 0 (0.0%) |
| 19 to 25 Years | 169 (92.9%) | 13 (7.1%) |
| 26 to 34 Years | 88 (88.0%) | 12 (12.0%) |
| 35 to 44 Years | 51 (100.0%) | 0 (0.0%) |
| 45 to 54 Years | 151 (100.0%) | 0 (0.0%) |
| 55 to 64 Years | 166 (95.4%) | 8 (4.6%) |
| 65 to 74 Years | 144 (100.0%) | 0 (0.0%) |
| 75 Years and older | 63 (100.0%) | 0 (0.0%) |
| Total | 910 (96.5%) | 33 (3.5%) |
Health Insurance Coverage by Citizenship Status in Lake George
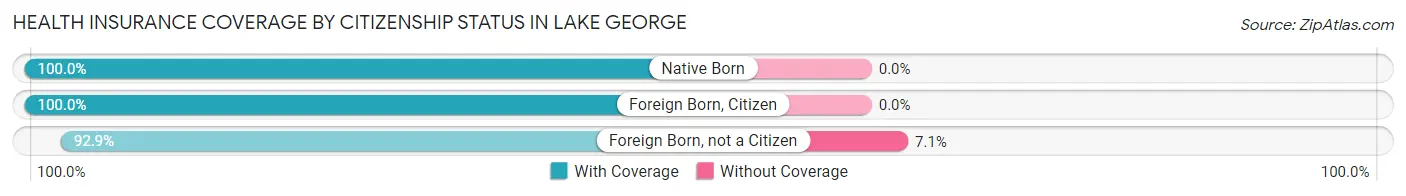
| Citizenship Status | With Coverage | Without Coverage |
| Native Born | 16 (100.0%) | 0 (0.0%) |
| Foreign Born, Citizen | 62 (100.0%) | 0 (0.0%) |
| Foreign Born, not a Citizen | 169 (92.9%) | 13 (7.1%) |
Health Insurance Coverage by Household Income in Lake George
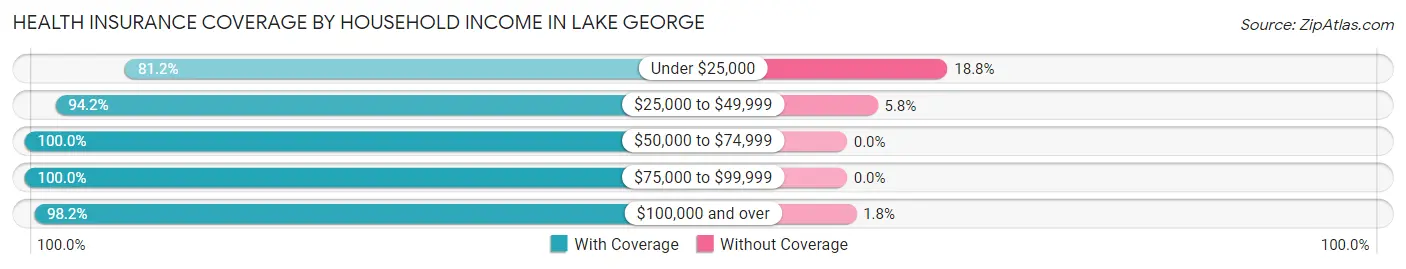
| Household Income | With Coverage | Without Coverage |
| Under $25,000 | 56 (81.2%) | 13 (18.8%) |
| $25,000 to $49,999 | 262 (94.2%) | 16 (5.8%) |
| $50,000 to $74,999 | 243 (100.0%) | 0 (0.0%) |
| $75,000 to $99,999 | 121 (100.0%) | 0 (0.0%) |
| $100,000 and over | 222 (98.2%) | 4 (1.8%) |
Public vs Private Health Insurance Coverage by Age in Lake George
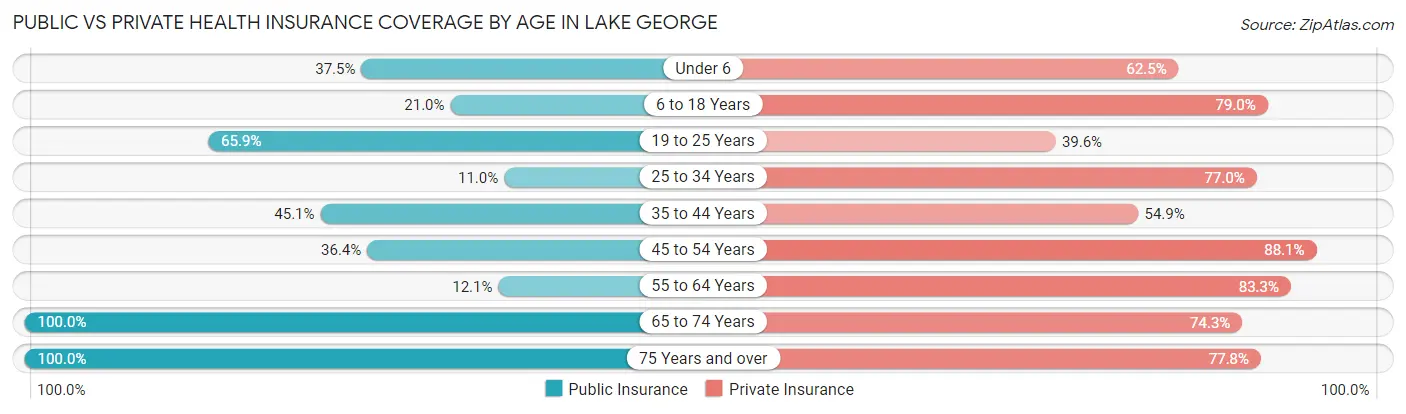
| Age Bracket | Public Insurance | Private Insurance |
| Under 6 | 6 (37.5%) | 10 (62.5%) |
| 6 to 18 Years | 13 (21.0%) | 49 (79.0%) |
| 19 to 25 Years | 120 (65.9%) | 72 (39.6%) |
| 25 to 34 Years | 11 (11.0%) | 77 (77.0%) |
| 35 to 44 Years | 23 (45.1%) | 28 (54.9%) |
| 45 to 54 Years | 55 (36.4%) | 133 (88.1%) |
| 55 to 64 Years | 21 (12.1%) | 145 (83.3%) |
| 65 to 74 Years | 144 (100.0%) | 107 (74.3%) |
| 75 Years and over | 63 (100.0%) | 49 (77.8%) |
| Total | 456 (48.4%) | 670 (71.1%) |
Disability Status by Sex by Age in Lake George
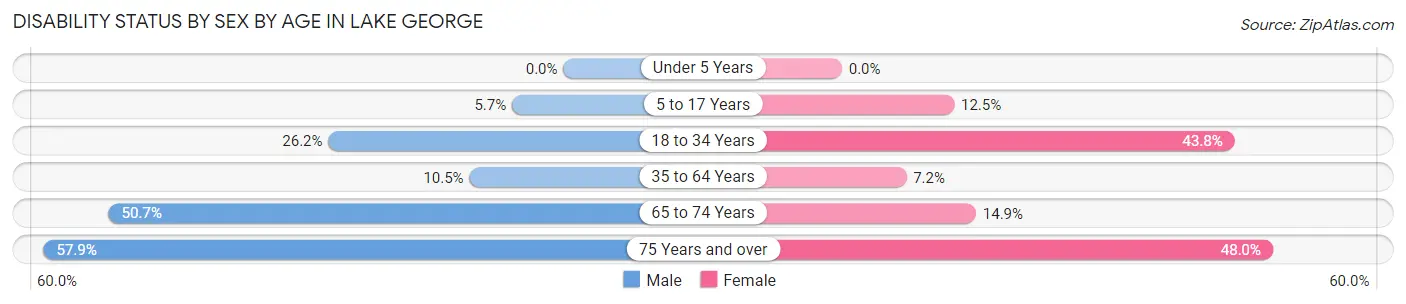
| Age Bracket | Male | Female |
| Under 5 Years | 0 (0.0%) | 0 (0.0%) |
| 5 to 17 Years | 2 (5.7%) | 2 (12.5%) |
| 18 to 34 Years | 39 (26.2%) | 63 (43.8%) |
| 35 to 64 Years | 16 (10.5%) | 16 (7.2%) |
| 65 to 74 Years | 39 (50.6%) | 10 (14.9%) |
| 75 Years and over | 22 (57.9%) | 12 (48.0%) |
Disability Class by Sex by Age in Lake George
Disability Class: Hearing Difficulty
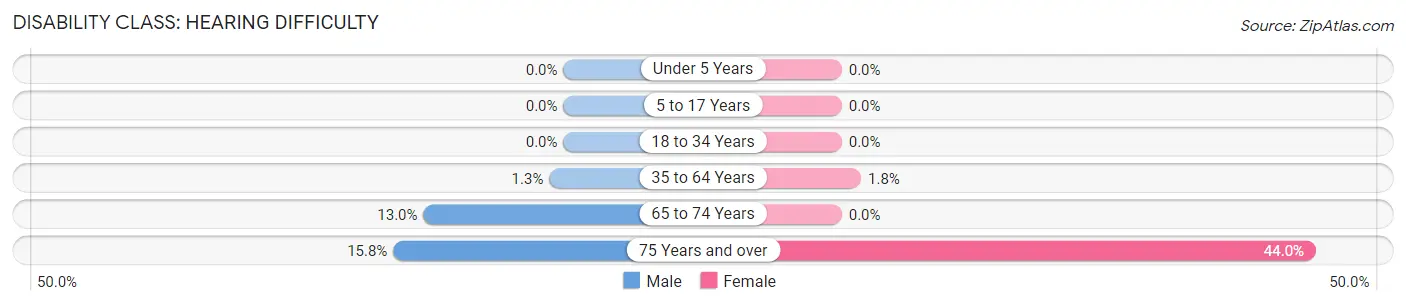
| Age Bracket | Male | Female |
| Under 5 Years | 0 (0.0%) | 0 (0.0%) |
| 5 to 17 Years | 0 (0.0%) | 0 (0.0%) |
| 18 to 34 Years | 0 (0.0%) | 0 (0.0%) |
| 35 to 64 Years | 2 (1.3%) | 4 (1.8%) |
| 65 to 74 Years | 10 (13.0%) | 0 (0.0%) |
| 75 Years and over | 6 (15.8%) | 11 (44.0%) |
Disability Class: Vision Difficulty
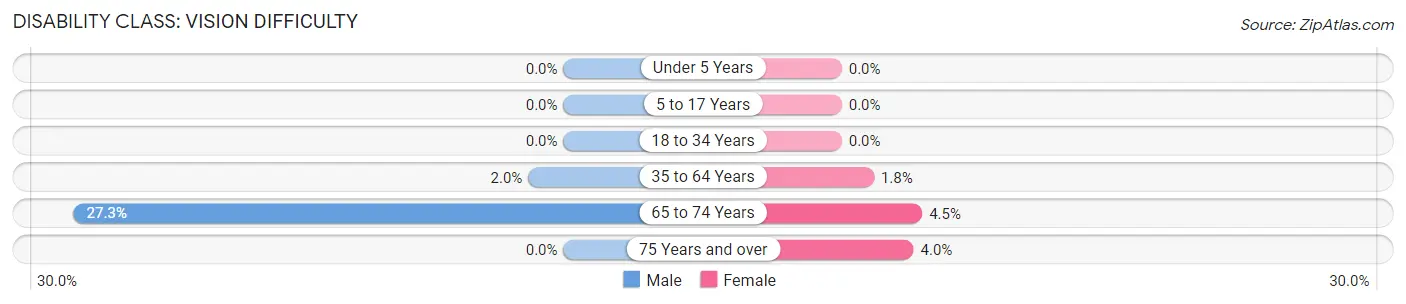
| Age Bracket | Male | Female |
| Under 5 Years | 0 (0.0%) | 0 (0.0%) |
| 5 to 17 Years | 0 (0.0%) | 0 (0.0%) |
| 18 to 34 Years | 0 (0.0%) | 0 (0.0%) |
| 35 to 64 Years | 3 (2.0%) | 4 (1.8%) |
| 65 to 74 Years | 21 (27.3%) | 3 (4.5%) |
| 75 Years and over | 0 (0.0%) | 1 (4.0%) |
Disability Class: Cognitive Difficulty
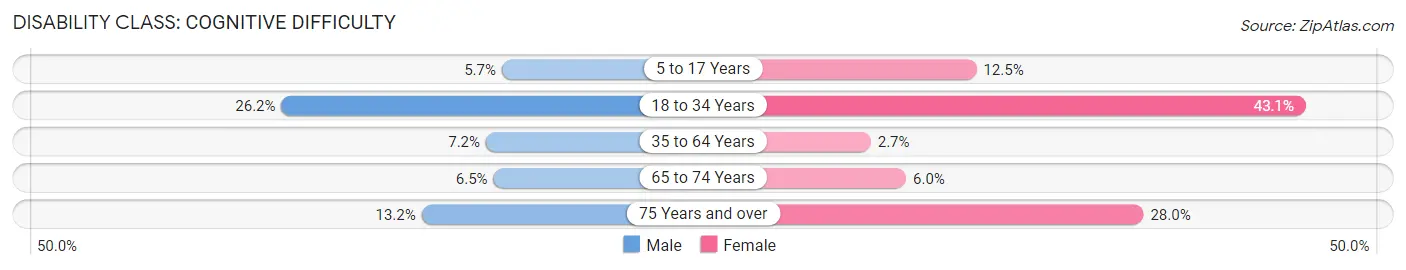
| Age Bracket | Male | Female |
| 5 to 17 Years | 2 (5.7%) | 2 (12.5%) |
| 18 to 34 Years | 39 (26.2%) | 62 (43.1%) |
| 35 to 64 Years | 11 (7.2%) | 6 (2.7%) |
| 65 to 74 Years | 5 (6.5%) | 4 (6.0%) |
| 75 Years and over | 5 (13.2%) | 7 (28.0%) |
Disability Class: Ambulatory Difficulty
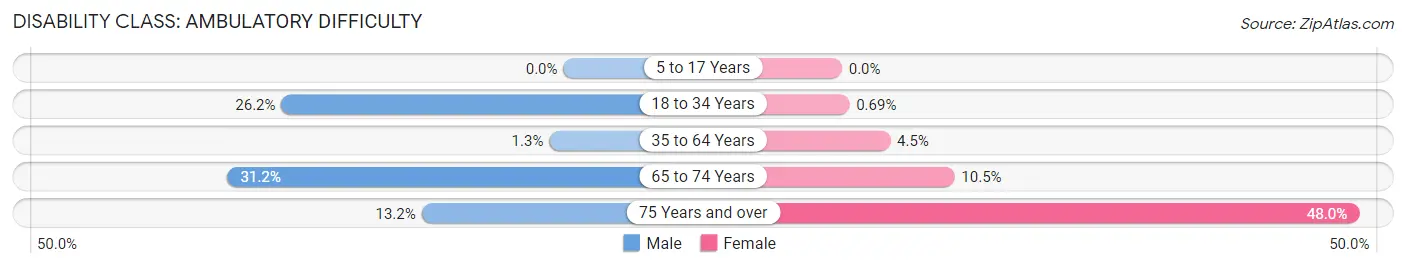
| Age Bracket | Male | Female |
| 5 to 17 Years | 0 (0.0%) | 0 (0.0%) |
| 18 to 34 Years | 39 (26.2%) | 1 (0.7%) |
| 35 to 64 Years | 2 (1.3%) | 10 (4.5%) |
| 65 to 74 Years | 24 (31.2%) | 7 (10.4%) |
| 75 Years and over | 5 (13.2%) | 12 (48.0%) |
Disability Class: Self-Care Difficulty
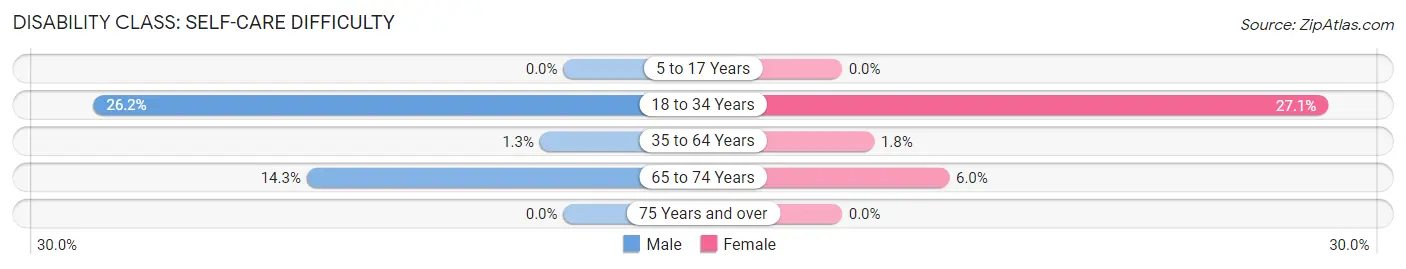
| Age Bracket | Male | Female |
| 5 to 17 Years | 0 (0.0%) | 0 (0.0%) |
| 18 to 34 Years | 39 (26.2%) | 39 (27.1%) |
| 35 to 64 Years | 2 (1.3%) | 4 (1.8%) |
| 65 to 74 Years | 11 (14.3%) | 4 (6.0%) |
| 75 Years and over | 0 (0.0%) | 0 (0.0%) |
Technology Access in Lake George
Computing Device Access in Lake George
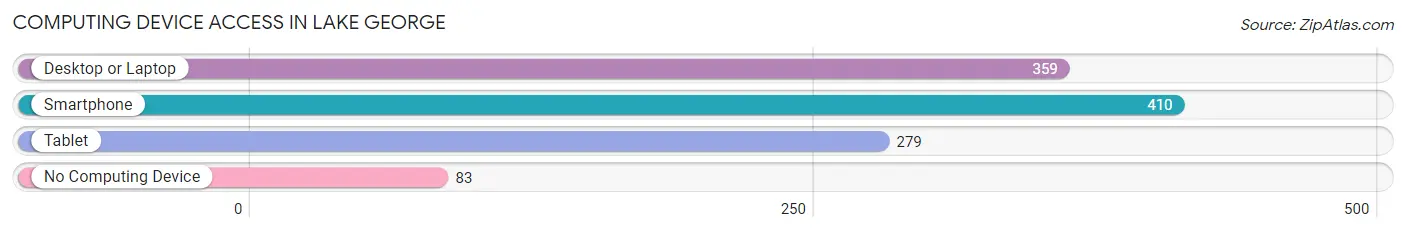
| Device Type | # Households | % Households |
| Desktop or Laptop | 359 | 69.7% |
| Smartphone | 410 | 79.6% |
| Tablet | 279 | 54.2% |
| No Computing Device | 83 | 16.1% |
| Total | 515 | 100.0% |
Internet Access in Lake George
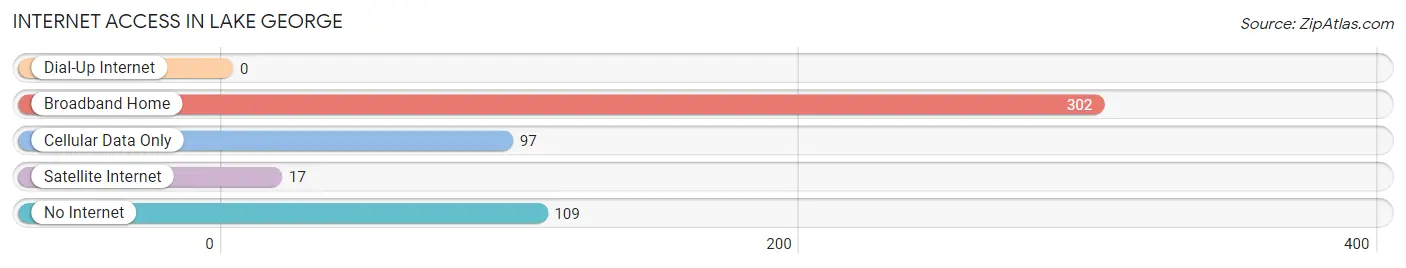
| Internet Type | # Households | % Households |
| Dial-Up Internet | 0 | 0.0% |
| Broadband Home | 302 | 58.6% |
| Cellular Data Only | 97 | 18.8% |
| Satellite Internet | 17 | 3.3% |
| No Internet | 109 | 21.2% |
| Total | 515 | 100.0% |
Lake George Summary
Lake George is a 32-mile long lake located in the Adirondack Mountains of upstate New York. It is the largest lake in the Adirondack Park and is a popular tourist destination. The lake is known for its stunning scenery, crystal clear waters, and abundance of recreational activities.
Geography
Lake George is located in the Adirondack Mountains of upstate New York. It is the largest lake in the Adirondack Park and is 32 miles long and 3 miles wide. The lake is located at an elevation of 1,977 feet and has a maximum depth of 195 feet. The lake is fed by several rivers and streams, including the Schroon River, the Sacandaga River, and the Indian River. The lake is surrounded by the towns of Bolton, Hague, Lake George, and Ticonderoga.
History
The lake was first discovered by French explorer Samuel de Champlain in 1609. He named the lake Lac du Saint-Sacrement, which translates to Lake of the Blessed Sacrament. The lake was later renamed Lake George in 1755 by British General William Johnson in honor of King George II.
The lake has a long history of military activity. During the French and Indian War, the lake was the site of several battles between the British and French forces. During the American Revolution, the lake was the site of the Battle of Valcour Island, which was a major victory for the American forces.
Economy
The economy of Lake George is largely driven by tourism. The lake is a popular destination for fishing, boating, swimming, and other recreational activities. There are several resorts and hotels located on the lake, as well as restaurants, bars, and other attractions. The lake is also home to several marinas, boat rentals, and charter services.
Demographics
As of the 2010 census, the population of Lake George was 5,168. The median age of the population was 44.7 years, and the median household income was $50,945. The racial makeup of the population was 94.3% White, 1.2% African American, 0.7% Native American, 0.7% Asian, 0.1% Pacific Islander, and 2.1% from other races.
Conclusion
Lake George is a stunning lake located in the Adirondack Mountains of upstate New York. It is the largest lake in the Adirondack Park and is a popular tourist destination. The lake has a long history of military activity and is now a popular destination for fishing, boating, swimming, and other recreational activities. The economy of Lake George is largely driven by tourism, and the population of the lake is largely white with a median age of 44.7 years and a median household income of $50,945.
Common Questions
What is Per Capita Income in Lake George?
Per Capita income in Lake George is $36,936.
What is the Median Family Income in Lake George?
Median Family Income in Lake George is $57,917.
What is the Median Household income in Lake George?
Median Household Income in Lake George is $52,196.
What is Income or Wage Gap in Lake George?
Income or Wage Gap in Lake George is 21.9%.
Women in Lake George earn 78.1 cents for every dollar earned by a man.
What is Inequality or Gini Index in Lake George?
Inequality or Gini Index in Lake George is 0.37.
What is the Total Population of Lake George?
Total Population of Lake George is 943.
What is the Total Male Population of Lake George?
Total Male Population of Lake George is 459.
What is the Total Female Population of Lake George?
Total Female Population of Lake George is 484.
What is the Ratio of Males per 100 Females in Lake George?
There are 94.83 Males per 100 Females in Lake George.
What is the Ratio of Females per 100 Males in Lake George?
There are 105.45 Females per 100 Males in Lake George.
What is the Median Population Age in Lake George?
Median Population Age in Lake George is 52.2 Years.
What is the Average Family Size in Lake George
Average Family Size in Lake George is 2.5 People.
What is the Average Household Size in Lake George
Average Household Size in Lake George is 1.8 People.
How Large is the Labor Force in Lake George?
There are 499 People in the Labor Forcein in Lake George.
What is the Percentage of People in the Labor Force in Lake George?
56.9% of People are in the Labor Force in Lake George.
What is the Unemployment Rate in Lake George?
Unemployment Rate in Lake George is 1.2%.