Cities with the Largest Hispanic or Latino Community in New York
RELATED REPORTS & OPTIONS
Hispanic or Latino
New York
Compare Cities
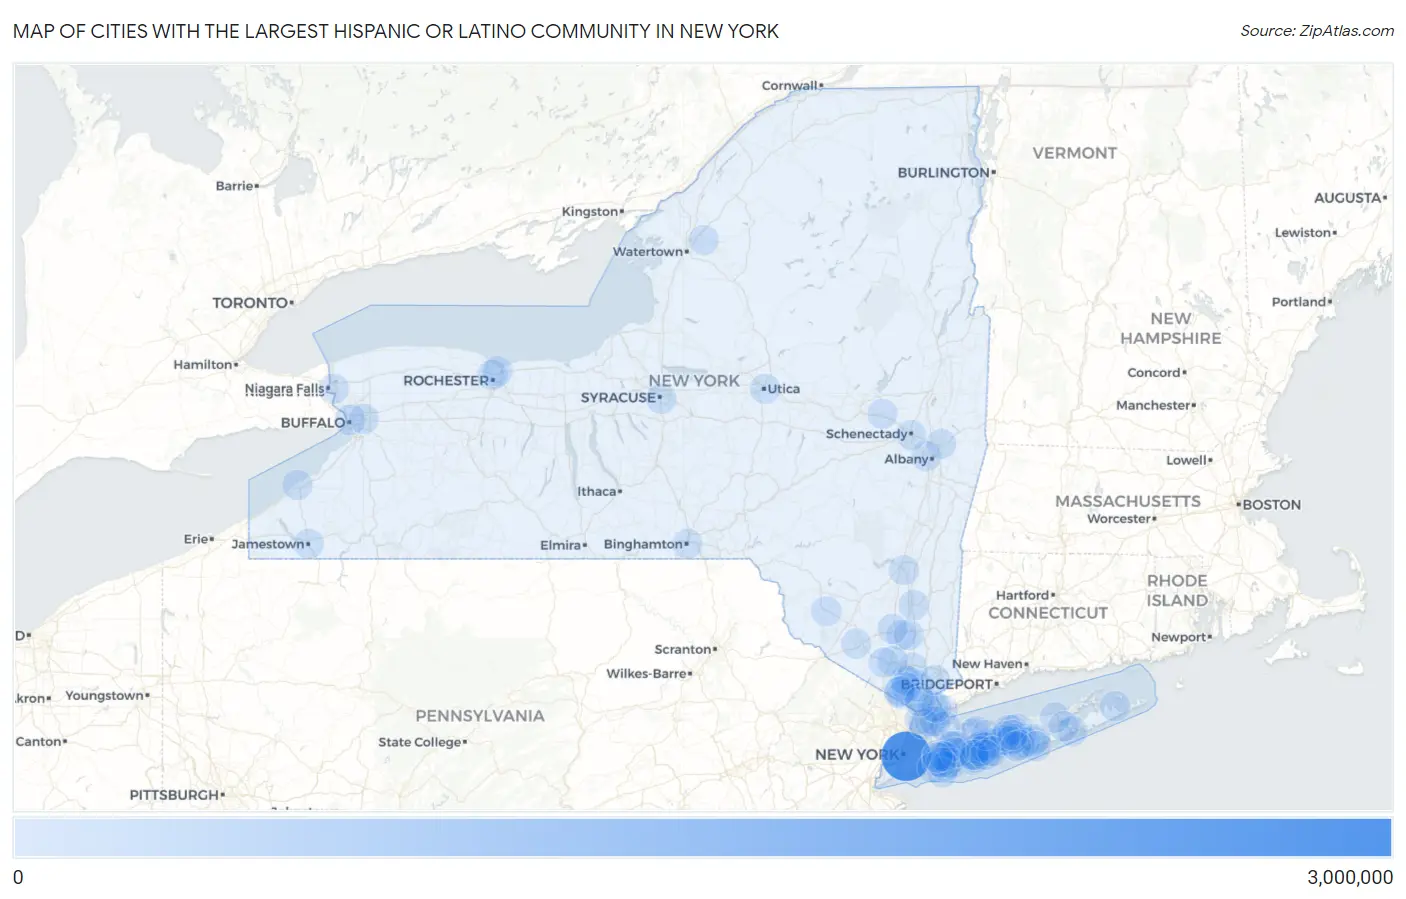
Map of Cities with the Largest Hispanic or Latino Community in New York
0
3,000,000
Cities with the Largest Hispanic or Latino Community in New York
| City | Hispanic or Latino | vs State | vs National | |
| 1. | New York | 2,503,005 | 3,895,714(64.25%)#1 | 61,755,866(4.05%)#1 |
| 2. | Yonkers | 87,256 | 3,895,714(2.24%)#2 | 61,755,866(0.14%)#74 |
| 3. | Brentwood | 47,416 | 3,895,714(1.22%)#3 | 61,755,866(0.08%)#175 |
| 4. | Rochester | 41,573 | 3,895,714(1.07%)#4 | 61,755,866(0.07%)#213 |
| 5. | Buffalo | 34,152 | 3,895,714(0.88%)#5 | 61,755,866(0.06%)#270 |
| 6. | Hempstead | 26,556 | 3,895,714(0.68%)#6 | 61,755,866(0.04%)#353 |
| 7. | New Rochelle | 25,087 | 3,895,714(0.64%)#7 | 61,755,866(0.04%)#378 |
| 8. | Central Islip | 21,779 | 3,895,714(0.56%)#8 | 61,755,866(0.04%)#436 |
| 9. | Port Chester | 19,536 | 3,895,714(0.50%)#9 | 61,755,866(0.03%)#482 |
| 10. | Freeport | 19,240 | 3,895,714(0.49%)#10 | 61,755,866(0.03%)#488 |
| 11. | White Plains | 18,589 | 3,895,714(0.48%)#11 | 61,755,866(0.03%)#503 |
| 12. | Syracuse | 14,422 | 3,895,714(0.37%)#12 | 61,755,866(0.02%)#641 |
| 13. | Newburgh | 13,989 | 3,895,714(0.36%)#13 | 61,755,866(0.02%)#668 |
| 14. | Uniondale | 13,384 | 3,895,714(0.34%)#14 | 61,755,866(0.02%)#699 |
| 15. | Mount Vernon | 12,538 | 3,895,714(0.32%)#15 | 61,755,866(0.02%)#731 |
| 16. | Middletown | 12,154 | 3,895,714(0.31%)#16 | 61,755,866(0.02%)#753 |
| 17. | North Bay Shore | 11,244 | 3,895,714(0.29%)#17 | 61,755,866(0.02%)#815 |
| 18. | Ossining | 11,185 | 3,895,714(0.29%)#18 | 61,755,866(0.02%)#818 |
| 19. | Huntington Station | 11,037 | 3,895,714(0.28%)#19 | 61,755,866(0.02%)#829 |
| 20. | Peekskill | 10,478 | 3,895,714(0.27%)#20 | 61,755,866(0.02%)#871 |
| 21. | Bay Shore | 10,130 | 3,895,714(0.26%)#21 | 61,755,866(0.02%)#901 |
| 22. | Albany | 9,907 | 3,895,714(0.25%)#22 | 61,755,866(0.02%)#920 |
| 23. | Copiague | 9,707 | 3,895,714(0.25%)#23 | 61,755,866(0.02%)#942 |
| 24. | Spring Valley | 9,660 | 3,895,714(0.25%)#24 | 61,755,866(0.02%)#950 |
| 25. | Valley Stream | 9,366 | 3,895,714(0.24%)#25 | 61,755,866(0.02%)#975 |
| 26. | Utica | 8,860 | 3,895,714(0.23%)#26 | 61,755,866(0.01%)#1,019 |
| 27. | Elmont | 8,651 | 3,895,714(0.22%)#27 | 61,755,866(0.01%)#1,043 |
| 28. | Schenectady | 8,598 | 3,895,714(0.22%)#28 | 61,755,866(0.01%)#1,045 |
| 29. | Roosevelt | 8,425 | 3,895,714(0.22%)#29 | 61,755,866(0.01%)#1,063 |
| 30. | New Cassel | 8,422 | 3,895,714(0.22%)#30 | 61,755,866(0.01%)#1,064 |
| 31. | Levittown | 8,304 | 3,895,714(0.21%)#31 | 61,755,866(0.01%)#1,080 |
| 32. | Glen Cove | 8,173 | 3,895,714(0.21%)#32 | 61,755,866(0.01%)#1,089 |
| 33. | Coram | 7,935 | 3,895,714(0.20%)#33 | 61,755,866(0.01%)#1,116 |
| 34. | Hicksville | 7,589 | 3,895,714(0.19%)#34 | 61,755,866(0.01%)#1,155 |
| 35. | West Babylon | 7,409 | 3,895,714(0.19%)#35 | 61,755,866(0.01%)#1,173 |
| 36. | Haverstraw | 6,850 | 3,895,714(0.18%)#36 | 61,755,866(0.01%)#1,241 |
| 37. | Baldwin | 6,809 | 3,895,714(0.17%)#37 | 61,755,866(0.01%)#1,244 |
| 38. | Medford | 6,759 | 3,895,714(0.17%)#38 | 61,755,866(0.01%)#1,250 |
| 39. | Poughkeepsie | 6,721 | 3,895,714(0.17%)#39 | 61,755,866(0.01%)#1,256 |
| 40. | North Amityville | 6,643 | 3,895,714(0.17%)#40 | 61,755,866(0.01%)#1,265 |
| 41. | Shirley | 6,211 | 3,895,714(0.16%)#41 | 61,755,866(0.01%)#1,333 |
| 42. | Amsterdam | 5,986 | 3,895,714(0.15%)#42 | 61,755,866(0.01%)#1,368 |
| 43. | West Haverstraw | 5,972 | 3,895,714(0.15%)#43 | 61,755,866(0.01%)#1,373 |
| 44. | Franklin Square | 5,830 | 3,895,714(0.15%)#44 | 61,755,866(0.01%)#1,404 |
| 45. | Mamaroneck | 5,394 | 3,895,714(0.14%)#45 | 61,755,866(0.01%)#1,480 |
| 46. | Centereach | 5,288 | 3,895,714(0.14%)#46 | 61,755,866(0.01%)#1,498 |
| 47. | Hampton Bays | 5,286 | 3,895,714(0.14%)#47 | 61,755,866(0.01%)#1,499 |
| 48. | Wyandanch | 5,234 | 3,895,714(0.13%)#48 | 61,755,866(0.01%)#1,511 |
| 49. | Sleepy Hollow | 5,230 | 3,895,714(0.13%)#49 | 61,755,866(0.01%)#1,513 |
| 50. | Irondequoit | 5,196 | 3,895,714(0.13%)#50 | 61,755,866(0.01%)#1,519 |
| 51. | Inwood | 5,167 | 3,895,714(0.13%)#51 | 61,755,866(0.01%)#1,528 |
| 52. | Westbury | 5,079 | 3,895,714(0.13%)#52 | 61,755,866(0.01%)#1,542 |
| 53. | Nanuet | 5,060 | 3,895,714(0.13%)#53 | 61,755,866(0.01%)#1,547 |
| 54. | New City | 5,058 | 3,895,714(0.13%)#54 | 61,755,866(0.01%)#1,549 |
| 55. | Long Beach | 4,983 | 3,895,714(0.13%)#55 | 61,755,866(0.01%)#1,570 |
| 56. | Oceanside | 4,932 | 3,895,714(0.13%)#56 | 61,755,866(0.01%)#1,581 |
| 57. | East Meadow | 4,906 | 3,895,714(0.13%)#57 | 61,755,866(0.01%)#1,585 |
| 58. | West Hempstead | 4,814 | 3,895,714(0.12%)#58 | 61,755,866(0.01%)#1,612 |
| 59. | Deer Park | 4,698 | 3,895,714(0.12%)#59 | 61,755,866(0.01%)#1,639 |
| 60. | Riverhead | 4,685 | 3,895,714(0.12%)#60 | 61,755,866(0.01%)#1,643 |
| 61. | Troy | 4,650 | 3,895,714(0.12%)#61 | 61,755,866(0.01%)#1,648 |
| 62. | Selden | 4,564 | 3,895,714(0.12%)#62 | 61,755,866(0.01%)#1,672 |
| 63. | Harrison | 4,536 | 3,895,714(0.12%)#63 | 61,755,866(0.01%)#1,682 |
| 64. | Lynbrook | 4,519 | 3,895,714(0.12%)#64 | 61,755,866(0.01%)#1,689 |
| 65. | Binghamton | 4,389 | 3,895,714(0.11%)#65 | 61,755,866(0.01%)#1,732 |
| 66. | North Bellport | 4,189 | 3,895,714(0.11%)#66 | 61,755,866(0.01%)#1,803 |
| 67. | Lindenhurst | 4,093 | 3,895,714(0.11%)#67 | 61,755,866(0.01%)#1,835 |
| 68. | Holbrook | 4,015 | 3,895,714(0.10%)#68 | 61,755,866(0.01%)#1,858 |
| 69. | Ronkonkoma | 3,794 | 3,895,714(0.10%)#69 | 61,755,866(0.01%)#1,946 |
| 70. | Mount Kisco | 3,735 | 3,895,714(0.10%)#70 | 61,755,866(0.01%)#1,965 |
| 71. | Mastic | 3,661 | 3,895,714(0.09%)#71 | 61,755,866(0.01%)#1,998 |
| 72. | Kingston | 3,655 | 3,895,714(0.09%)#72 | 61,755,866(0.01%)#2,002 |
| 73. | Fort Drum | 3,611 | 3,895,714(0.09%)#73 | 61,755,866(0.01%)#2,019 |
| 74. | Niagara Falls | 3,556 | 3,895,714(0.09%)#74 | 61,755,866(0.01%)#2,042 |
| 75. | Hillcrest | 3,544 | 3,895,714(0.09%)#75 | 61,755,866(0.01%)#2,045 |
| 76. | Flanders | 3,510 | 3,895,714(0.09%)#76 | 61,755,866(0.01%)#2,057 |
| 77. | Greenlawn | 3,500 | 3,895,714(0.09%)#77 | 61,755,866(0.01%)#2,061 |
| 78. | Dunkirk | 3,495 | 3,895,714(0.09%)#78 | 61,755,866(0.01%)#2,065 |
| 79. | North Valley Stream | 3,368 | 3,895,714(0.09%)#79 | 61,755,866(0.01%)#2,115 |
| 80. | Cheektowaga | 3,343 | 3,895,714(0.09%)#80 | 61,755,866(0.01%)#2,129 |
| 81. | Jamestown | 3,290 | 3,895,714(0.08%)#81 | 61,755,866(0.01%)#2,157 |
| 82. | Woodbury | 3,289 | 3,895,714(0.08%)#82 | 61,755,866(0.01%)#2,160 |
| 83. | Holtsville | 3,209 | 3,895,714(0.08%)#83 | 61,755,866(0.01%)#2,199 |
| 84. | Baywood | 3,193 | 3,895,714(0.08%)#84 | 61,755,866(0.01%)#2,212 |
| 85. | North Babylon | 3,145 | 3,895,714(0.08%)#85 | 61,755,866(0.01%)#2,233 |
| 86. | East Patchogue | 3,065 | 3,895,714(0.08%)#86 | 61,755,866(0.00%)#2,263 |
| 87. | Commack | 3,060 | 3,895,714(0.08%)#87 | 61,755,866(0.00%)#2,265 |
| 88. | Springs | 2,954 | 3,895,714(0.08%)#88 | 61,755,866(0.00%)#2,317 |
| 89. | North Lindenhurst | 2,877 | 3,895,714(0.07%)#89 | 61,755,866(0.00%)#2,361 |
| 90. | Mastic Beach | 2,858 | 3,895,714(0.07%)#90 | 61,755,866(0.00%)#2,372 |
| 91. | Lake Ronkonkoma | 2,852 | 3,895,714(0.07%)#91 | 61,755,866(0.00%)#2,376 |
| 92. | West Islip | 2,833 | 3,895,714(0.07%)#92 | 61,755,866(0.00%)#2,390 |
| 93. | Tarrytown | 2,812 | 3,895,714(0.07%)#93 | 61,755,866(0.00%)#2,409 |
| 94. | Beacon | 2,794 | 3,895,714(0.07%)#94 | 61,755,866(0.00%)#2,417 |
| 95. | Islip | 2,767 | 3,895,714(0.07%)#95 | 61,755,866(0.00%)#2,429 |
| 96. | Monroe | 2,761 | 3,895,714(0.07%)#96 | 61,755,866(0.00%)#2,433 |
| 97. | Monticello | 2,739 | 3,895,714(0.07%)#97 | 61,755,866(0.00%)#2,444 |
| 98. | Farmingville | 2,720 | 3,895,714(0.07%)#98 | 61,755,866(0.00%)#2,457 |
| 99. | Patchogue | 2,688 | 3,895,714(0.07%)#99 | 61,755,866(0.00%)#2,478 |
| 100. | Orange Lake | 2,680 | 3,895,714(0.07%)#100 | 61,755,866(0.00%)#2,487 |
Common Questions
What are the Top 10 Cities with the Largest Hispanic or Latino Community in New York?
Top 10 Cities with the Largest Hispanic or Latino Community in New York are:
#1
2,503,005
#2
87,256
#3
47,416
#4
41,573
#5
34,152
#6
26,556
#7
25,087
#8
21,779
#9
19,536
#10
19,240
What city has the Largest Hispanic or Latino Community in New York?
New York has the Largest Hispanic or Latino Community in New York with 2,503,005.
What is the Total Hispanic or Latino Population in the State of New York?
Total Hispanic or Latino Population in New York is 3,895,714.
What is the Total Hispanic or Latino Population in the United States?
Total Hispanic or Latino Population in the United States is 61,755,866.