Cities with the Highest Percentage of South American Indian Population in New York
RELATED REPORTS & OPTIONS
South American Indian
New York
Compare Cities
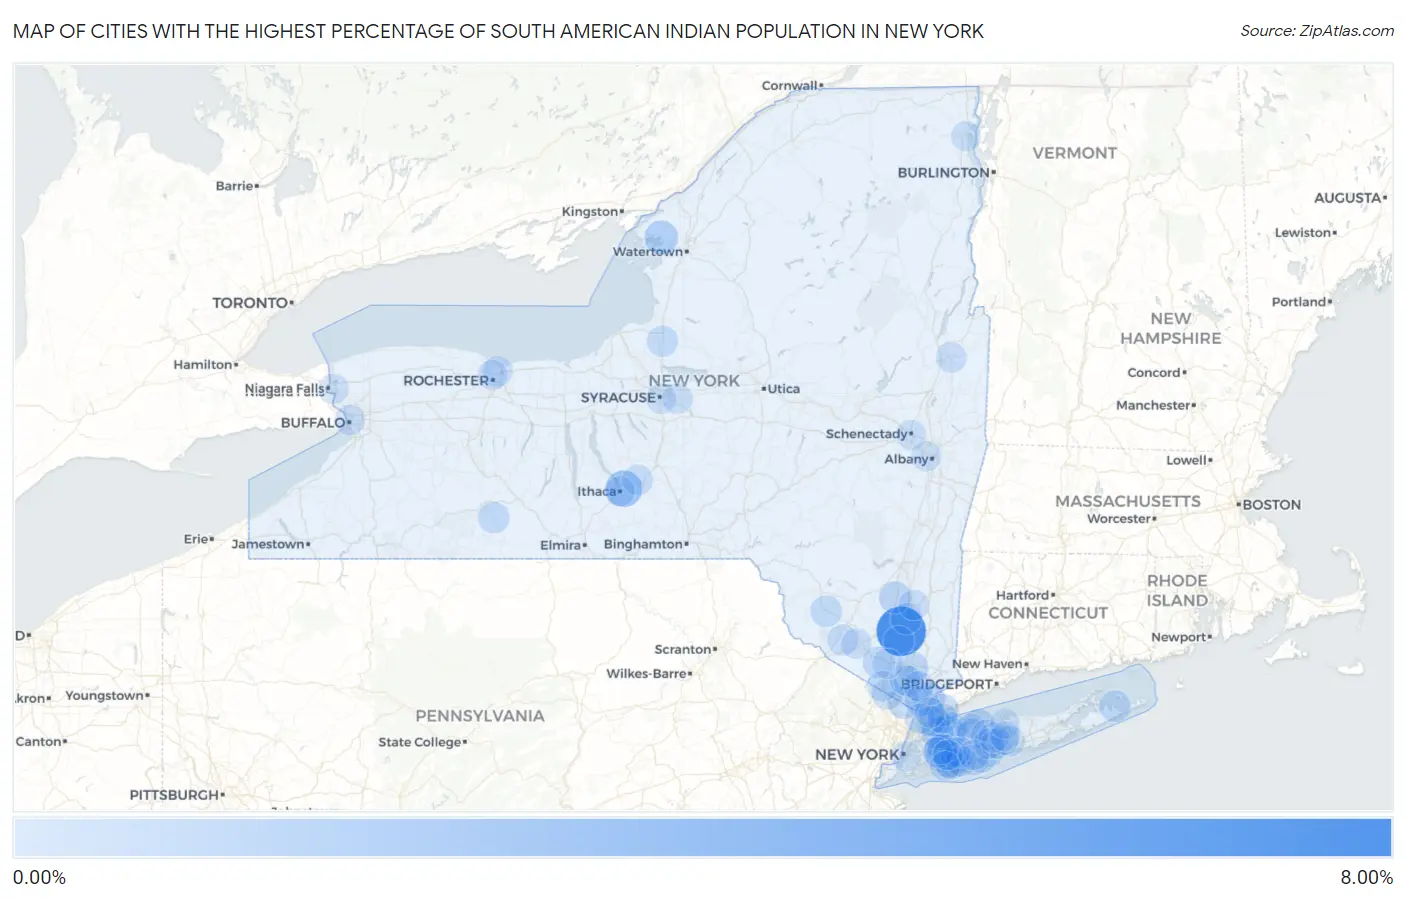
Map of Cities with the Highest Percentage of South American Indian Population in New York
0.00%
8.00%
Cities with the Highest Percentage of South American Indian Population in New York
| City | South American Indian | vs State | vs National | |
| 1. | Balmville | 6.98% | 0.053%(+6.93)#1 | 0.019%(+6.96)#7 |
| 2. | Forest Home | 2.26% | 0.053%(+2.21)#2 | 0.019%(+2.24)#22 |
| 3. | Varna | 2.00% | 0.053%(+1.95)#3 | 0.019%(+1.98)#24 |
| 4. | Chaumont | 1.31% | 0.053%(+1.26)#4 | 0.019%(+1.29)#41 |
| 5. | Glen Head | 1.19% | 0.053%(+1.13)#5 | 0.019%(+1.17)#48 |
| 6. | Valhalla | 1.02% | 0.053%(+0.963)#6 | 0.019%(+0.997)#62 |
| 7. | New Hyde Park | 0.82% | 0.053%(+0.768)#7 | 0.019%(+0.802)#77 |
| 8. | Locust Valley | 0.80% | 0.053%(+0.750)#8 | 0.019%(+0.785)#79 |
| 9. | Pearl River | 0.79% | 0.053%(+0.739)#9 | 0.019%(+0.773)#82 |
| 10. | Sands Point | 0.78% | 0.053%(+0.725)#10 | 0.019%(+0.759)#85 |
| 11. | Port Chester | 0.73% | 0.053%(+0.673)#11 | 0.019%(+0.707)#89 |
| 12. | New Paltz | 0.71% | 0.053%(+0.659)#12 | 0.019%(+0.693)#92 |
| 13. | Northport | 0.67% | 0.053%(+0.615)#13 | 0.019%(+0.649)#100 |
| 14. | Peekskill | 0.59% | 0.053%(+0.538)#14 | 0.019%(+0.572)#111 |
| 15. | Walton Park | 0.53% | 0.053%(+0.479)#15 | 0.019%(+0.513)#124 |
| 16. | Monticello | 0.50% | 0.053%(+0.446)#16 | 0.019%(+0.480)#133 |
| 17. | Springs | 0.49% | 0.053%(+0.439)#17 | 0.019%(+0.473)#137 |
| 18. | Suffern | 0.48% | 0.053%(+0.431)#18 | 0.019%(+0.465)#141 |
| 19. | Uniondale | 0.44% | 0.053%(+0.390)#19 | 0.019%(+0.424)#148 |
| 20. | Canisteo | 0.43% | 0.053%(+0.377)#20 | 0.019%(+0.411)#152 |
| 21. | Marlboro | 0.41% | 0.053%(+0.360)#21 | 0.019%(+0.394)#153 |
| 22. | Parish | 0.36% | 0.053%(+0.308)#22 | 0.019%(+0.342)#164 |
| 23. | Bay Shore | 0.35% | 0.053%(+0.298)#23 | 0.019%(+0.332)#171 |
| 24. | Franklin Square | 0.34% | 0.053%(+0.291)#24 | 0.019%(+0.326)#176 |
| 25. | Otisville | 0.28% | 0.053%(+0.227)#25 | 0.019%(+0.261)#213 |
| 26. | Vails Gate | 0.28% | 0.053%(+0.225)#26 | 0.019%(+0.259)#214 |
| 27. | Mamaroneck | 0.27% | 0.053%(+0.213)#27 | 0.019%(+0.247)#221 |
| 28. | Sloatsburg | 0.26% | 0.053%(+0.211)#28 | 0.019%(+0.245)#222 |
| 29. | Huntington Station | 0.24% | 0.053%(+0.190)#29 | 0.019%(+0.224)#236 |
| 30. | West Haverstraw | 0.23% | 0.053%(+0.182)#30 | 0.019%(+0.216)#239 |
| 31. | North New Hyde Park | 0.23% | 0.053%(+0.179)#31 | 0.019%(+0.213)#242 |
| 32. | Freeville | 0.21% | 0.053%(+0.161)#32 | 0.019%(+0.195)#265 |
| 33. | Haverstraw | 0.21% | 0.053%(+0.159)#33 | 0.019%(+0.193)#267 |
| 34. | North Bellmore | 0.20% | 0.053%(+0.151)#34 | 0.019%(+0.186)#277 |
| 35. | Copiague | 0.18% | 0.053%(+0.131)#35 | 0.019%(+0.165)#302 |
| 36. | Merrick | 0.18% | 0.053%(+0.123)#36 | 0.019%(+0.158)#308 |
| 37. | Huntington | 0.17% | 0.053%(+0.121)#37 | 0.019%(+0.155)#314 |
| 38. | Tarrytown | 0.16% | 0.053%(+0.109)#38 | 0.019%(+0.143)#327 |
| 39. | Freeport | 0.15% | 0.053%(+0.101)#39 | 0.019%(+0.135)#339 |
| 40. | Commack | 0.15% | 0.053%(+0.098)#40 | 0.019%(+0.132)#344 |
| 41. | Baldwin | 0.15% | 0.053%(+0.092)#41 | 0.019%(+0.127)#356 |
| 42. | Holbrook | 0.14% | 0.053%(+0.091)#42 | 0.019%(+0.125)#360 |
| 43. | Levittown | 0.13% | 0.053%(+0.079)#43 | 0.019%(+0.113)#376 |
| 44. | New Rochelle | 0.13% | 0.053%(+0.075)#44 | 0.019%(+0.109)#386 |
| 45. | Babylon | 0.12% | 0.053%(+0.070)#45 | 0.019%(+0.105)#395 |
| 46. | Seaford | 0.12% | 0.053%(+0.067)#46 | 0.019%(+0.101)#400 |
| 47. | Irondequoit | 0.12% | 0.053%(+0.065)#47 | 0.019%(+0.100)#404 |
| 48. | Hudson Falls | 0.11% | 0.053%(+0.055)#48 | 0.019%(+0.089)#423 |
| 49. | Yonkers | 0.093% | 0.053%(+0.040)#49 | 0.019%(+0.074)#454 |
| 50. | Ossining | 0.089% | 0.053%(+0.036)#50 | 0.019%(+0.070)#469 |
| 51. | Brentwood | 0.088% | 0.053%(+0.035)#51 | 0.019%(+0.069)#473 |
| 52. | East Meadow | 0.084% | 0.053%(+0.031)#52 | 0.019%(+0.066)#487 |
| 53. | Garden City Park | 0.077% | 0.053%(+0.025)#53 | 0.019%(+0.059)#513 |
| 54. | Poughkeepsie | 0.076% | 0.053%(+0.023)#54 | 0.019%(+0.057)#518 |
| 55. | Buffalo | 0.073% | 0.053%(+0.020)#55 | 0.019%(+0.054)#529 |
| 56. | New York | 0.073% | 0.053%(+0.020)#56 | 0.019%(+0.054)#530 |
| 57. | Central Islip | 0.071% | 0.053%(+0.019)#57 | 0.019%(+0.053)#541 |
| 58. | Fayetteville | 0.071% | 0.053%(+0.018)#58 | 0.019%(+0.052)#546 |
| 59. | Floral Park | 0.069% | 0.053%(+0.017)#59 | 0.019%(+0.051)#554 |
| 60. | Harriman | 0.068% | 0.053%(+0.015)#60 | 0.019%(+0.049)#559 |
| 61. | Middletown | 0.066% | 0.053%(+0.014)#61 | 0.019%(+0.048)#567 |
| 62. | Oceanside | 0.064% | 0.053%(+0.011)#62 | 0.019%(+0.045)#578 |
| 63. | Rochester | 0.060% | 0.053%(+0.008)#63 | 0.019%(+0.042)#593 |
| 64. | Schenectady | 0.054% | 0.053%(+0.001)#64 | 0.019%(+0.035)#618 |
| 65. | North Lindenhurst | 0.054% | 0.053%(+0.001)#65 | 0.019%(+0.035)#621 |
| 66. | Ronkonkoma | 0.048% | 0.053%(-0.005)#66 | 0.019%(+0.029)#650 |
| 67. | Hauppauge | 0.044% | 0.053%(-0.009)#67 | 0.019%(+0.026)#676 |
| 68. | Rye | 0.043% | 0.053%(-0.010)#68 | 0.019%(+0.024)#687 |
| 69. | Niagara Falls | 0.027% | 0.053%(-0.026)#69 | 0.019%(+0.008)#794 |
| 70. | Ithaca | 0.026% | 0.053%(-0.027)#70 | 0.019%(+0.007)#811 |
| 71. | Stony Brook University | 0.023% | 0.053%(-0.030)#71 | 0.019%(+0.004)#841 |
| 72. | Scarsdale | 0.022% | 0.053%(-0.031)#72 | 0.019%(+0.004)#849 |
| 73. | Albany | 0.014% | 0.053%(-0.039)#73 | 0.019%(-0.005)#931 |
| 74. | Hempstead | 0.014% | 0.053%(-0.039)#74 | 0.019%(-0.005)#933 |
| 75. | Plattsburgh | 0.010% | 0.053%(-0.043)#75 | 0.019%(-0.009)#978 |
| 76. | Syracuse | 0.0068% | 0.053%(-0.046)#76 | 0.019%(-0.012)#1,016 |
| 77. | Lake Ronkonkoma | 0.0055% | 0.053%(-0.047)#77 | 0.019%(-0.013)#1,031 |
Common Questions
What are the Top 10 Cities with the Highest Percentage of South American Indian Population in New York?
Top 10 Cities with the Highest Percentage of South American Indian Population in New York are:
#1
6.98%
#2
2.26%
#3
1.31%
#4
1.19%
#5
1.02%
#6
0.82%
#7
0.80%
#8
0.79%
#9
0.78%
#10
0.73%
What city has the Highest Percentage of South American Indian Population in New York?
Balmville has the Highest Percentage of South American Indian Population in New York with 6.98%.
What is the Percentage of South American Indian Population in the State of New York?
Percentage of South American Indian Population in New York is 0.053%.
What is the Percentage of South American Indian Population in the United States?
Percentage of South American Indian Population in the United States is 0.019%.