Binghamton University, NY Map & Demographics
Binghamton University Map
Binghamton University Overview
$2,714
PER CAPITA INCOME
18.9%
WAGE / INCOME GAP [ % ]
81.1¢/ $1
WAGE / INCOME GAP [ $ ]
6,405
TOTAL POPULATION
3,052
MALE POPULATION
3,353
FEMALE POPULATION
91.02
MALES / 100 FEMALES
109.86
FEMALES / 100 MALES
19.4
MEDIAN AGE
1,646
LABOR FORCE [ PEOPLE ]
25.7%
PERCENT IN LABOR FORCE
25.3%
UNEMPLOYMENT RATE
Income in Binghamton University
Income Overview in Binghamton University
| Characteristic | Number | Measure |
| Per Capita Income | 6,405 | $2,714 |
| Median Family Income | 0 | $0 |
| Mean Family Income | 0 | $0 |
| Median Household Income | 0 | $0 |
| Mean Household Income | 0 | $0 |
| Income Deficit | 0 | $0 |
| Wage / Income Gap (%) | 6,405 | 18.86% |
| Wage / Income Gap ($) | 6,405 | 81.14¢ per $1 |
| Gini / Inequality Index | 6,405 | 0.00 |
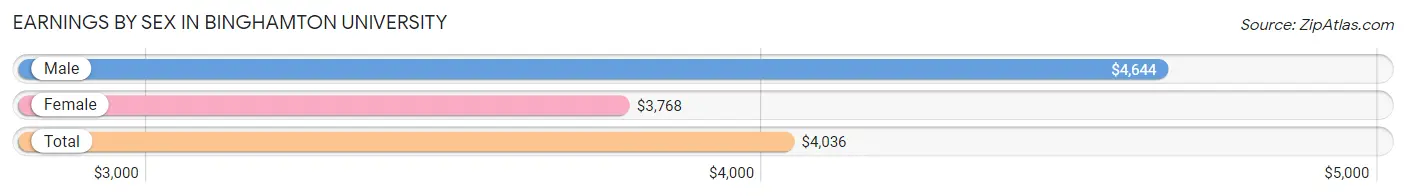
Earnings by Sex in Binghamton University
Average Earnings in Binghamton University are $4,036, $4,644 for men and $3,768 for women, a difference of 18.9%.
| Sex | Number | Average Earnings |
| Male | 1,283 (41.6%) | $4,644 |
| Female | 1,800 (58.4%) | $3,768 |
| Total | 3,083 (100.0%) | $4,036 |
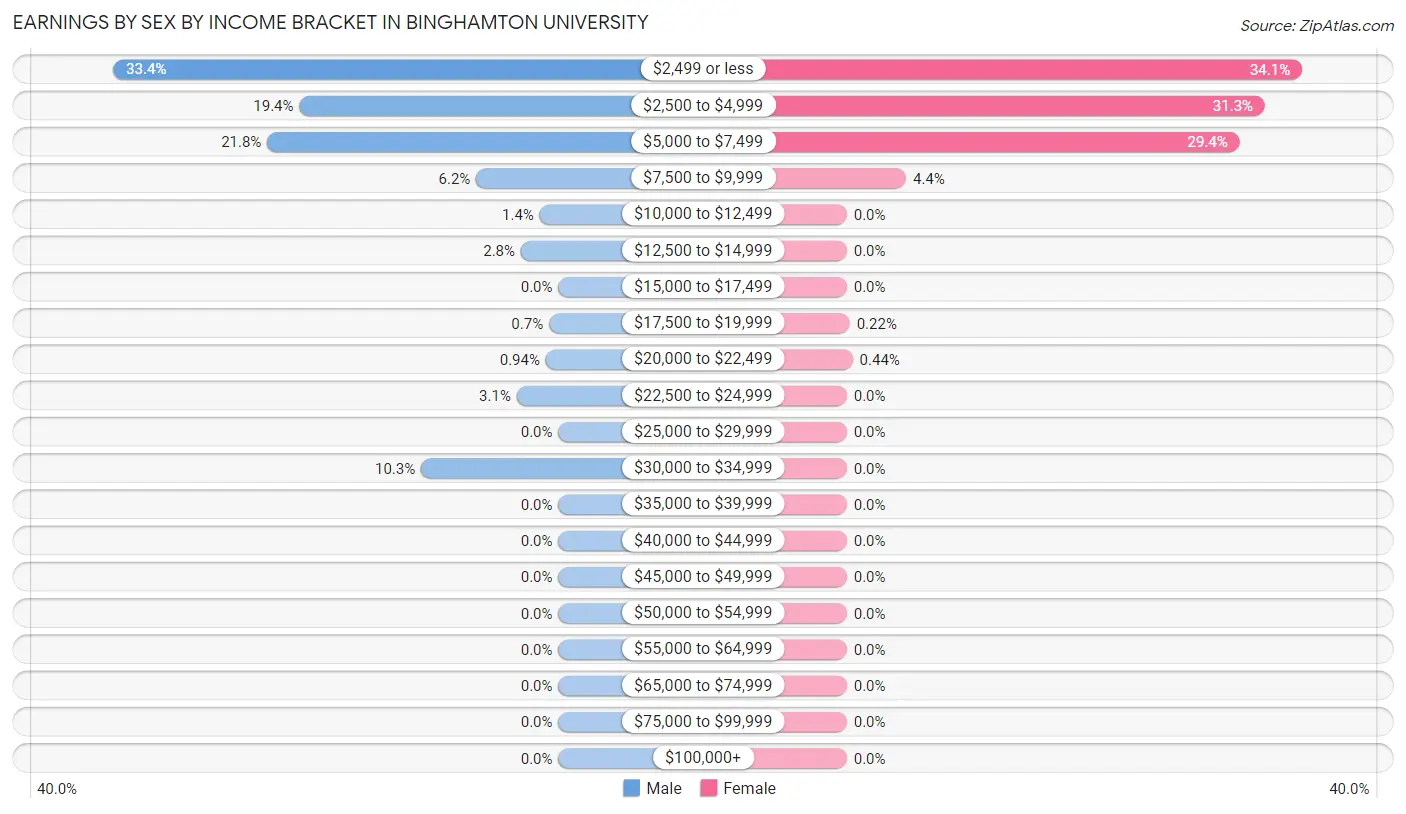
Earnings by Sex by Income Bracket in Binghamton University
The most common earnings brackets in Binghamton University are $2,499 or less for men (428 | 33.4%) and $2,499 or less for women (614 | 34.1%).
| Income | Male | Female |
| $2,499 or less | 428 (33.4%) | 614 (34.1%) |
| $2,500 to $4,999 | 249 (19.4%) | 564 (31.3%) |
| $5,000 to $7,499 | 280 (21.8%) | 530 (29.4%) |
| $7,500 to $9,999 | 79 (6.2%) | 80 (4.4%) |
| $10,000 to $12,499 | 18 (1.4%) | 0 (0.0%) |
| $12,500 to $14,999 | 36 (2.8%) | 0 (0.0%) |
| $15,000 to $17,499 | 0 (0.0%) | 0 (0.0%) |
| $17,500 to $19,999 | 9 (0.7%) | 4 (0.2%) |
| $20,000 to $22,499 | 12 (0.9%) | 8 (0.4%) |
| $22,500 to $24,999 | 40 (3.1%) | 0 (0.0%) |
| $25,000 to $29,999 | 0 (0.0%) | 0 (0.0%) |
| $30,000 to $34,999 | 132 (10.3%) | 0 (0.0%) |
| $35,000 to $39,999 | 0 (0.0%) | 0 (0.0%) |
| $40,000 to $44,999 | 0 (0.0%) | 0 (0.0%) |
| $45,000 to $49,999 | 0 (0.0%) | 0 (0.0%) |
| $50,000 to $54,999 | 0 (0.0%) | 0 (0.0%) |
| $55,000 to $64,999 | 0 (0.0%) | 0 (0.0%) |
| $65,000 to $74,999 | 0 (0.0%) | 0 (0.0%) |
| $75,000 to $99,999 | 0 (0.0%) | 0 (0.0%) |
| $100,000+ | 0 (0.0%) | 0 (0.0%) |
| Total | 1,283 (100.0%) | 1,800 (100.0%) |
Earnings by Sex by Educational Attainment in Binghamton University
| Educational Attainment | Male Income | Female Income |
| Less than High School | - | - |
| High School Diploma | - | - |
| College or Associate's Degree | - | - |
| Bachelor's Degree | - | - |
| Graduate Degree | - | - |
| Total | - | - |
Family Income in Binghamton University
Family Income Brackets in Binghamton University
| Income Bracket | # Families | % Families |
| Less than $10,000 | 0 | 0.0% |
| $10,000 to $14,999 | 0 | 0.0% |
| $15,000 to $24,999 | 0 | 0.0% |
| $25,000 to $34,999 | 0 | 0.0% |
| $35,000 to $49,999 | 0 | 0.0% |
| $50,000 to $74,999 | 0 | 0.0% |
| $75,000 to $99,999 | 0 | 0.0% |
| $100,000 to $149,999 | 0 | 0.0% |
| $150,000 to $199,999 | 0 | 0.0% |
| $200,000+ | 0 | 0.0% |
Family Income by Famaliy Size in Binghamton University
| Income Bracket | # Families | Median Income |
| 2-Person Families | 0 (0.0%) | $0 |
| 3-Person Families | 0 (0.0%) | $0 |
| 4-Person Families | 0 (0.0%) | $0 |
| 5-Person Families | 0 (0.0%) | $0 |
| 6-Person Families | 0 (0.0%) | $0 |
| 7+ Person Families | 0 (0.0%) | $0 |
| Total | 0 (0.0%) | $0 |
Family Income by Number of Earners in Binghamton University
| Number of Earners | # Families | Median Income |
| No Earners | 0 (0.0%) | $0 |
| 1 Earner | 0 (0.0%) | $0 |
| 2 Earners | 0 (0.0%) | $0 |
| 3+ Earners | 0 (0.0%) | $0 |
| Total | 0 (0.0%) | $0 |
Household Income in Binghamton University
Household Income Brackets in Binghamton University
| Income Bracket | # Households | % Households |
| Less than $10,000 | 0 | 0.0% |
| $10,000 to $14,999 | 0 | 0.0% |
| $15,000 to $24,999 | 0 | 0.0% |
| $25,000 to $34,999 | 0 | 0.0% |
| $35,000 to $49,999 | 0 | 0.0% |
| $50,000 to $74,999 | 0 | 0.0% |
| $75,000 to $99,999 | 0 | 0.0% |
| $100,000 to $149,999 | 0 | 0.0% |
| $150,000 to $199,999 | 0 | 0.0% |
| $200,000+ | 0 | 0.0% |
Household Income by Householder Age in Binghamton University
| Income Bracket | # Households | Median Income |
| 15 to 24 Years | 0 (0.0%) | $0 |
| 25 to 44 Years | 0 (0.0%) | $0 |
| 45 to 64 Years | 0 (0.0%) | $0 |
| 65+ Years | 0 (0.0%) | $0 |
| Total | 0 (0.0%) | $0 |
Poverty in Binghamton University
Income Below Poverty by Sex and Age in Binghamton University
| Age Bracket | Male | Female |
| Under 5 Years | 0 (0.0%) | 0 (0.0%) |
| 5 Years | 0 (0.0%) | 0 (0.0%) |
| 6 to 11 Years | 0 (0.0%) | 0 (0.0%) |
| 12 to 14 Years | 0 (0.0%) | 0 (0.0%) |
| 15 Years | 0 (0.0%) | 0 (0.0%) |
| 16 and 17 Years | 0 (0.0%) | 0 (0.0%) |
| 18 to 24 Years | 0 (0.0%) | 0 (0.0%) |
| 25 to 34 Years | 0 (0.0%) | 0 (0.0%) |
| 35 to 44 Years | 0 (0.0%) | 0 (0.0%) |
| 45 to 54 Years | 0 (0.0%) | 0 (0.0%) |
| 55 to 64 Years | 0 (0.0%) | 0 (0.0%) |
| 65 to 74 Years | 0 (0.0%) | 0 (0.0%) |
| 75 Years and over | 0 (0.0%) | 0 (0.0%) |
| Total | 0 (0.0%) | 0 (0.0%) |
Income Above Poverty by Sex and Age in Binghamton University
| Age Bracket | Male | Female |
| Under 5 Years | 0 (0.0%) | 0 (0.0%) |
| 5 Years | 0 (0.0%) | 0 (0.0%) |
| 6 to 11 Years | 0 (0.0%) | 0 (0.0%) |
| 12 to 14 Years | 0 (0.0%) | 0 (0.0%) |
| 15 Years | 0 (0.0%) | 0 (0.0%) |
| 16 and 17 Years | 0 (0.0%) | 0 (0.0%) |
| 18 to 24 Years | 0 (0.0%) | 0 (0.0%) |
| 25 to 34 Years | 0 (0.0%) | 0 (0.0%) |
| 35 to 44 Years | 0 (0.0%) | 0 (0.0%) |
| 45 to 54 Years | 0 (0.0%) | 0 (0.0%) |
| 55 to 64 Years | 0 (0.0%) | 0 (0.0%) |
| 65 to 74 Years | 0 (0.0%) | 0 (0.0%) |
| 75 Years and over | 0 (0.0%) | 0 (0.0%) |
| Total | 0 (0.0%) | 0 (0.0%) |
Income Below Poverty Among Married-Couple Families in Binghamton University
| Children | Above Poverty | Below Poverty |
| No Children | 0 (0.0%) | 0 (0.0%) |
| 1 or 2 Children | 0 (0.0%) | 0 (0.0%) |
| 3 or 4 Children | 0 (0.0%) | 0 (0.0%) |
| 5 or more Children | 0 (0.0%) | 0 (0.0%) |
| Total | 0 (0.0%) | 0 (0.0%) |
Income Below Poverty Among Single-Parent Households in Binghamton University
| Children | Single Father | Single Mother |
| No Children | 0 (0.0%) | 0 (0.0%) |
| 1 or 2 Children | 0 (0.0%) | 0 (0.0%) |
| 3 or 4 Children | 0 (0.0%) | 0 (0.0%) |
| 5 or more Children | 0 (0.0%) | 0 (0.0%) |
| Total | 0 (0.0%) | 0 (0.0%) |
Income Below Poverty Among Married-Couple vs Single-Parent Households in Binghamton University
| Children | Married-Couple Families | Single-Parent Households |
| No Children | 0 (0.0%) | 0 (0.0%) |
| 1 or 2 Children | 0 (0.0%) | 0 (0.0%) |
| 3 or 4 Children | 0 (0.0%) | 0 (0.0%) |
| 5 or more Children | 0 (0.0%) | 0 (0.0%) |
| Total | 0 (0.0%) | 0 (0.0%) |
Race in Binghamton University
The most populous races in Binghamton University are White / Caucasian (5,364 | 83.8%), Asian (848 | 13.2%), and Hispanic or Latino (325 | 5.1%).
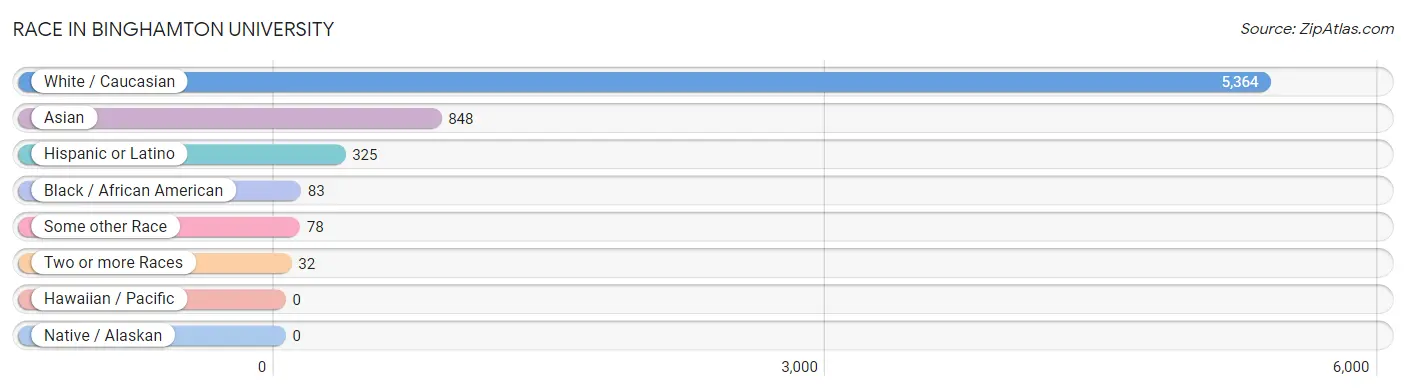
| Race | # Population | % Population |
| Asian | 848 | 13.2% |
| Black / African American | 83 | 1.3% |
| Hawaiian / Pacific | 0 | 0.0% |
| Hispanic or Latino | 325 | 5.1% |
| Native / Alaskan | 0 | 0.0% |
| White / Caucasian | 5,364 | 83.8% |
| Two or more Races | 32 | 0.5% |
| Some other Race | 78 | 1.2% |
| Total | 6,405 | 100.0% |
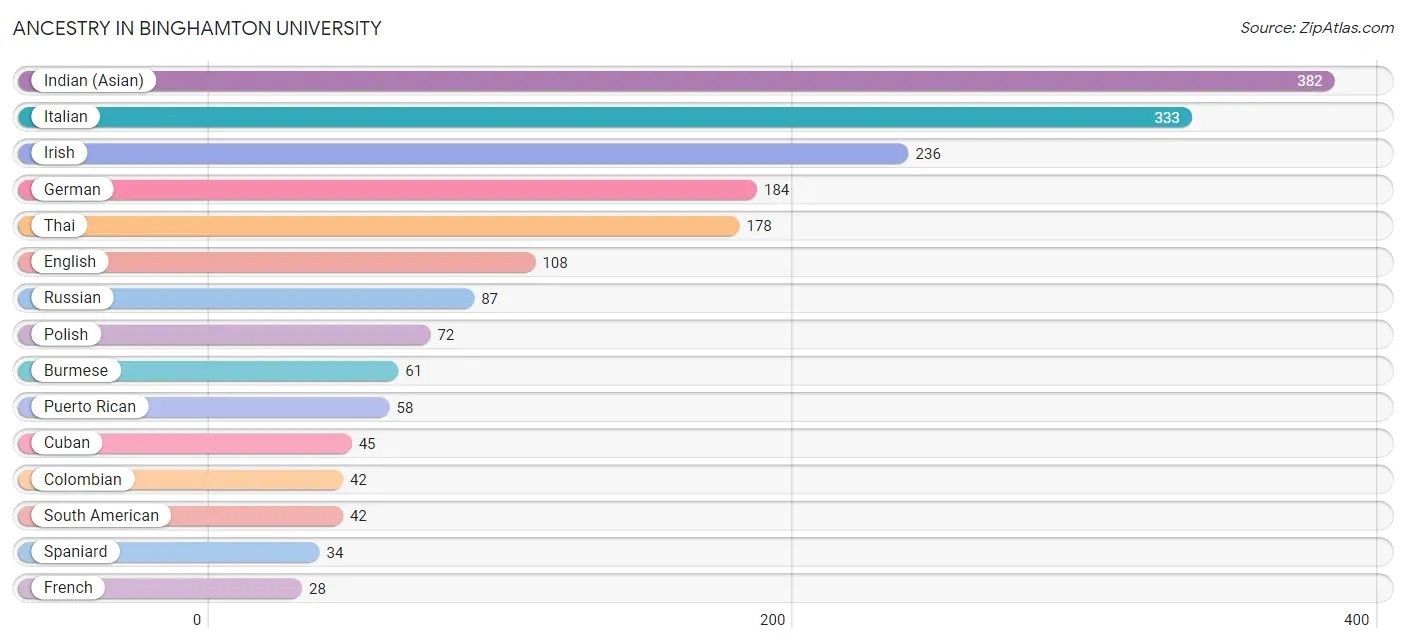
Ancestry in Binghamton University
The most populous ancestries reported in Binghamton University are Indian (Asian) (382 | 6.0%), Italian (333 | 5.2%), Irish (236 | 3.7%), German (184 | 2.9%), and Thai (178 | 2.8%), together accounting for 20.5% of all Binghamton University residents.
| Ancestry | # Population | % Population |
| American | 15 | 0.2% |
| Bhutanese | 4 | 0.1% |
| British | 5 | 0.1% |
| Burmese | 61 | 0.9% |
| Central American | 27 | 0.4% |
| Colombian | 42 | 0.7% |
| Cuban | 45 | 0.7% |
| Dominican | 4 | 0.1% |
| Eastern European | 14 | 0.2% |
| English | 108 | 1.7% |
| European | 22 | 0.3% |
| Finnish | 11 | 0.2% |
| French | 28 | 0.4% |
| German | 184 | 2.9% |
| Ghanaian | 10 | 0.2% |
| Greek | 16 | 0.3% |
| Guatemalan | 18 | 0.3% |
| Haitian | 6 | 0.1% |
| Indian (Asian) | 382 | 6.0% |
| Iranian | 9 | 0.1% |
| Irish | 236 | 3.7% |
| Israeli | 11 | 0.2% |
| Italian | 333 | 5.2% |
| Jamaican | 17 | 0.3% |
| Korean | 24 | 0.4% |
| Mexican | 18 | 0.3% |
| Norwegian | 6 | 0.1% |
| Pakistani | 15 | 0.2% |
| Polish | 72 | 1.1% |
| Portuguese | 8 | 0.1% |
| Puerto Rican | 58 | 0.9% |
| Romanian | 4 | 0.1% |
| Russian | 87 | 1.4% |
| Salvadoran | 9 | 0.1% |
| Scottish | 7 | 0.1% |
| South American | 42 | 0.7% |
| Spaniard | 34 | 0.5% |
| Sri Lankan | 3 | 0.1% |
| Subsaharan African | 10 | 0.2% |
| Thai | 178 | 2.8% |
| Trinidadian and Tobagonian | 13 | 0.2% |
| Ukrainian | 13 | 0.2% | View All 42 Rows |
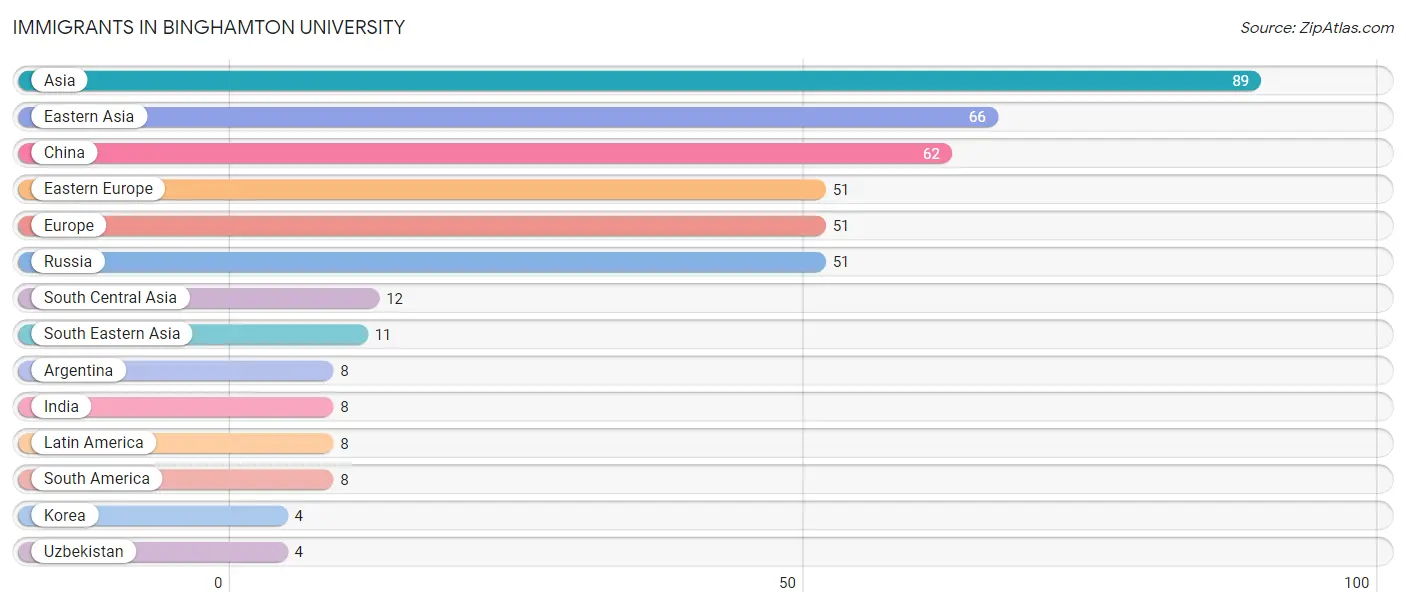
Immigrants in Binghamton University
The most numerous immigrant groups reported in Binghamton University came from Asia (89 | 1.4%), Eastern Asia (66 | 1.0%), China (62 | 1.0%), Eastern Europe (51 | 0.8%), and Europe (51 | 0.8%), together accounting for 5.0% of all Binghamton University residents.
| Immigration Origin | # Population | % Population |
| Argentina | 8 | 0.1% |
| Asia | 89 | 1.4% |
| China | 62 | 1.0% |
| Eastern Asia | 66 | 1.0% |
| Eastern Europe | 51 | 0.8% |
| Europe | 51 | 0.8% |
| India | 8 | 0.1% |
| Korea | 4 | 0.1% |
| Latin America | 8 | 0.1% |
| Russia | 51 | 0.8% |
| South America | 8 | 0.1% |
| South Central Asia | 12 | 0.2% |
| South Eastern Asia | 11 | 0.2% |
| Uzbekistan | 4 | 0.1% | View All 14 Rows |
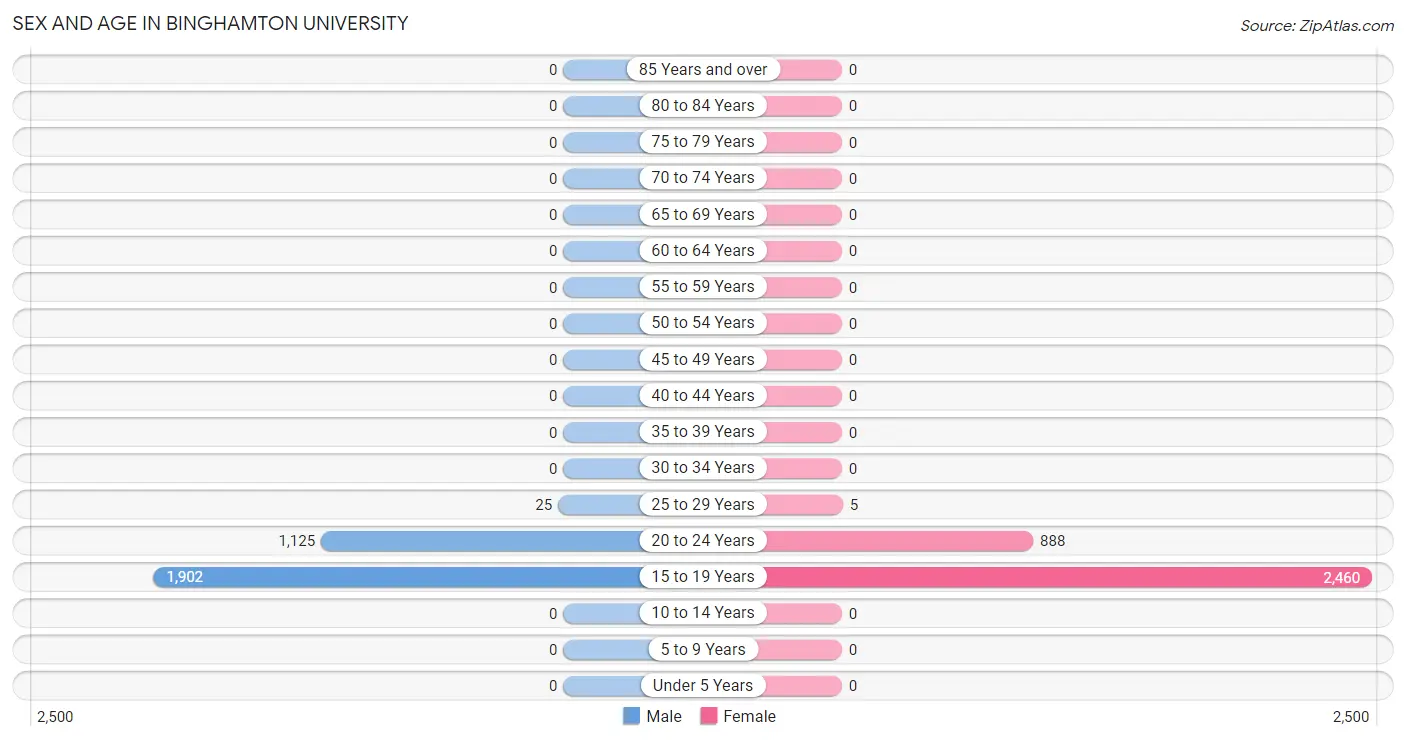
Sex and Age in Binghamton University
Sex and Age in Binghamton University
The most populous age groups in Binghamton University are 15 to 19 Years (1,902 | 62.3%) for men and 15 to 19 Years (2,460 | 73.4%) for women.
| Age Bracket | Male | Female |
| Under 5 Years | 0 (0.0%) | 0 (0.0%) |
| 5 to 9 Years | 0 (0.0%) | 0 (0.0%) |
| 10 to 14 Years | 0 (0.0%) | 0 (0.0%) |
| 15 to 19 Years | 1,902 (62.3%) | 2,460 (73.4%) |
| 20 to 24 Years | 1,125 (36.9%) | 888 (26.5%) |
| 25 to 29 Years | 25 (0.8%) | 5 (0.2%) |
| 30 to 34 Years | 0 (0.0%) | 0 (0.0%) |
| 35 to 39 Years | 0 (0.0%) | 0 (0.0%) |
| 40 to 44 Years | 0 (0.0%) | 0 (0.0%) |
| 45 to 49 Years | 0 (0.0%) | 0 (0.0%) |
| 50 to 54 Years | 0 (0.0%) | 0 (0.0%) |
| 55 to 59 Years | 0 (0.0%) | 0 (0.0%) |
| 60 to 64 Years | 0 (0.0%) | 0 (0.0%) |
| 65 to 69 Years | 0 (0.0%) | 0 (0.0%) |
| 70 to 74 Years | 0 (0.0%) | 0 (0.0%) |
| 75 to 79 Years | 0 (0.0%) | 0 (0.0%) |
| 80 to 84 Years | 0 (0.0%) | 0 (0.0%) |
| 85 Years and over | 0 (0.0%) | 0 (0.0%) |
| Total | 3,052 (100.0%) | 3,353 (100.0%) |
Families and Households in Binghamton University
Median Family Size in Binghamton University
| Family Type | # Families | Family Size |
| Married-Couple | 0 (0.0%) | - |
| Single Male/Father | 0 (0.0%) | - |
| Single Female/Mother | 0 (0.0%) | - |
| Total Families | 0 (0.0%) | - |
Median Household Size in Binghamton University
| Household Type | # Households | Household Size |
| Married-Couple | 0 (0.0%) | - |
| Single Male/Father | 0 (0.0%) | - |
| Single Female/Mother | 0 (0.0%) | - |
| Non-family | 0 (0.0%) | - |
| Total Households | 0 (0.0%) | - |
Household Size by Marriage Status in Binghamton University

| Household Size | Family Households | Nonfamily Households |
| 1-Person Households | - | 0 (0.0%) |
| 2-Person Households | 0 (0.0%) | 0 (0.0%) |
| 3-Person Households | 0 (0.0%) | 0 (0.0%) |
| 4-Person Households | 0 (0.0%) | 0 (0.0%) |
| 5-Person Households | 0 (0.0%) | 0 (0.0%) |
| 6-Person Households | 0 (0.0%) | 0 (0.0%) |
| 7+ Person Households | 0 (0.0%) | 0 (0.0%) |
| Total | 0 (0.0%) | 0 (0.0%) |
Female Fertility in Binghamton University
Fertility by Age in Binghamton University
Average fertility rate in Binghamton University is 23.0 births per 1,000 women. Women in the age bracket of 15 to 19 years have the highest fertility rate with 31.0 births per 1,000 women. Women in the age bracket of 15 to 19 years acount for 100.0% of all women with births.
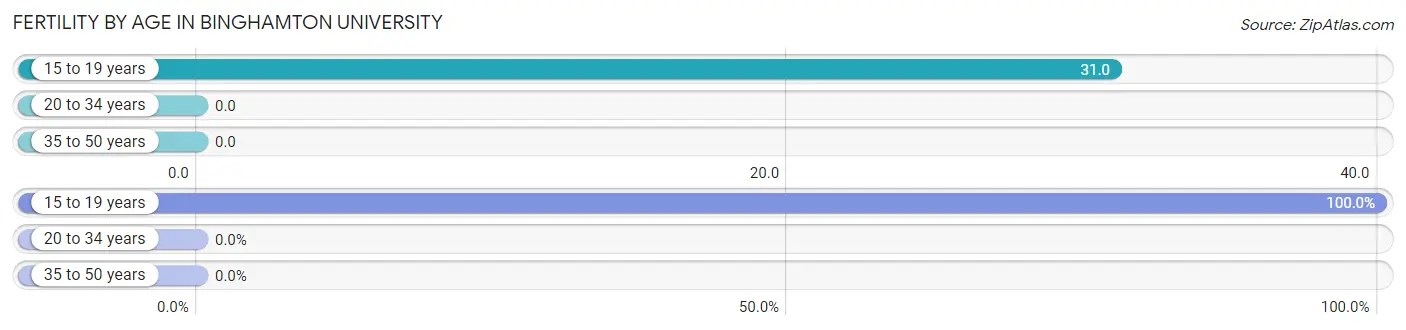
| Age Bracket | Women with Births | Births / 1,000 Women |
| 15 to 19 years | 76 (100.0%) | 31.0 |
| 20 to 34 years | 0 (0.0%) | 0.0 |
| 35 to 50 years | 0 (0.0%) | 0.0 |
| Total | 76 (100.0%) | 23.0 |
Fertility by Age by Marriage Status in Binghamton University
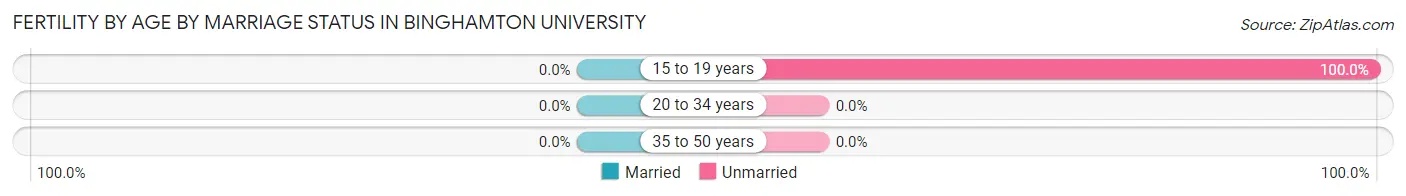
| Age Bracket | Married | Unmarried |
| 15 to 19 years | 0 (0.0%) | 76 (100.0%) |
| 20 to 34 years | 0 (0.0%) | 0 (0.0%) |
| 35 to 50 years | 0 (0.0%) | 0 (0.0%) |
| Total | 0 (0.0%) | 76 (100.0%) |
Fertility by Education in Binghamton University
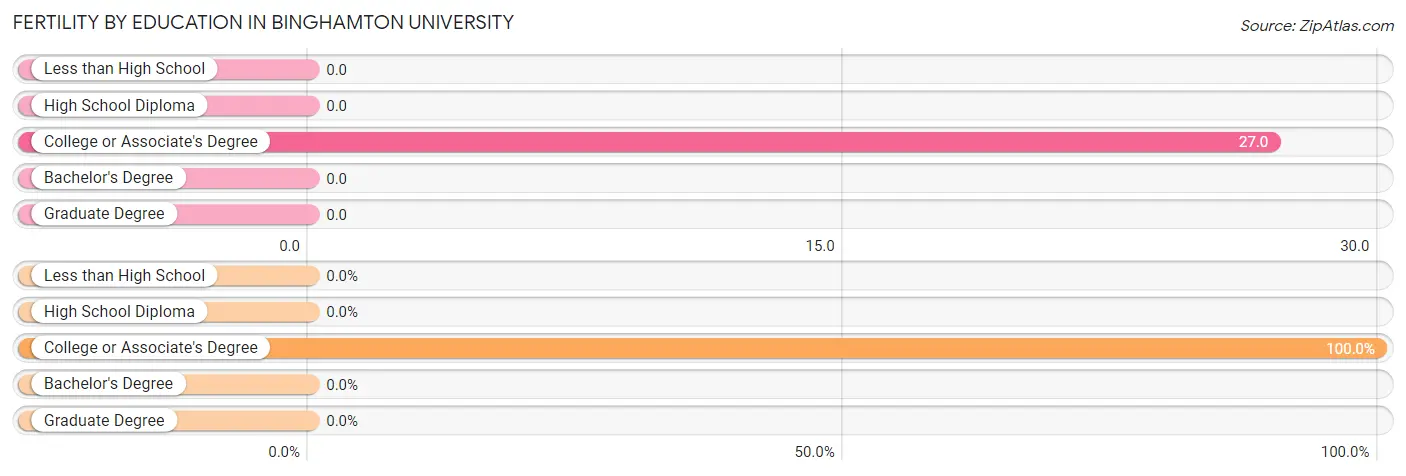
| Educational Attainment | Women with Births | Births / 1,000 Women |
| Less than High School | 0 (0.0%) | 0.0 |
| High School Diploma | 0 (0.0%) | 0.0 |
| College or Associate's Degree | 76 (100.0%) | 27.0 |
| Bachelor's Degree | 0 (0.0%) | 0.0 |
| Graduate Degree | 0 (0.0%) | 0.0 |
| Total | 76 (100.0%) | 23.0 |
Fertility by Education by Marriage Status in Binghamton University
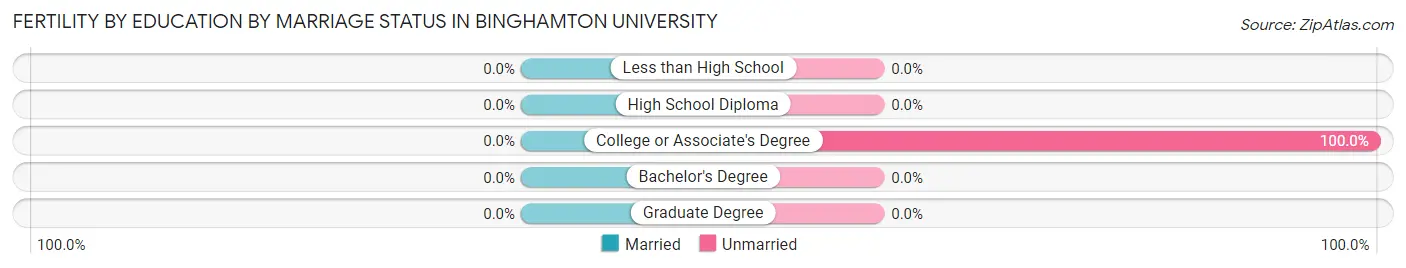
| Educational Attainment | Married | Unmarried |
| Less than High School | 0 (0.0%) | 0 (0.0%) |
| High School Diploma | 0 (0.0%) | 0 (0.0%) |
| College or Associate's Degree | 0 (0.0%) | 76 (100.0%) |
| Bachelor's Degree | 0 (0.0%) | 0 (0.0%) |
| Graduate Degree | 0 (0.0%) | 0 (0.0%) |
| Total | 0 (0.0%) | 76 (100.0%) |
Employment Characteristics in Binghamton University
Employment by Class of Employer in Binghamton University
Among the 1,160 employed individuals in Binghamton University, private company employees (821 | 70.8%), state government employees (155 | 13.4%), and not-for-profit organizations (138 | 11.9%) make up the most common classes of employment.
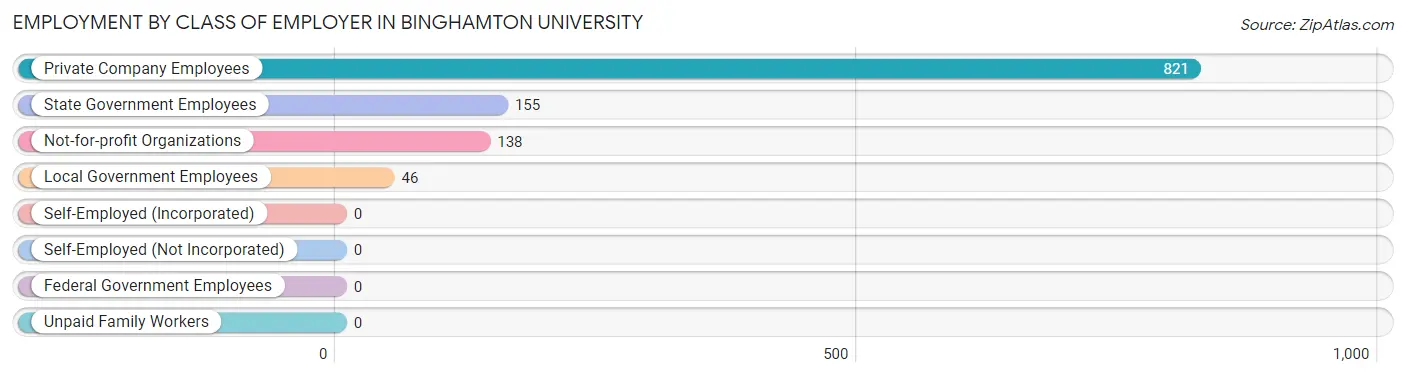
| Employer Class | # Employees | % Employees |
| Private Company Employees | 821 | 70.8% |
| Self-Employed (Incorporated) | 0 | 0.0% |
| Self-Employed (Not Incorporated) | 0 | 0.0% |
| Not-for-profit Organizations | 138 | 11.9% |
| Local Government Employees | 46 | 4.0% |
| State Government Employees | 155 | 13.4% |
| Federal Government Employees | 0 | 0.0% |
| Unpaid Family Workers | 0 | 0.0% |
| Total | 1,160 | 100.0% |
Employment Status by Age in Binghamton University
According to the labor force statistics for Binghamton University, out of the total population over 16 years of age (6,405), 25.7% or 1,646 individuals are in the labor force, with 25.3% or 416 of them unemployed. The age group with the highest labor force participation rate is 25 to 29 years, with 83.3% or 25 individuals in the labor force. Within the labor force, the 16 to 19 years age range has the highest percentage of unemployed individuals, with 35.9% or 365 of them being unemployed.
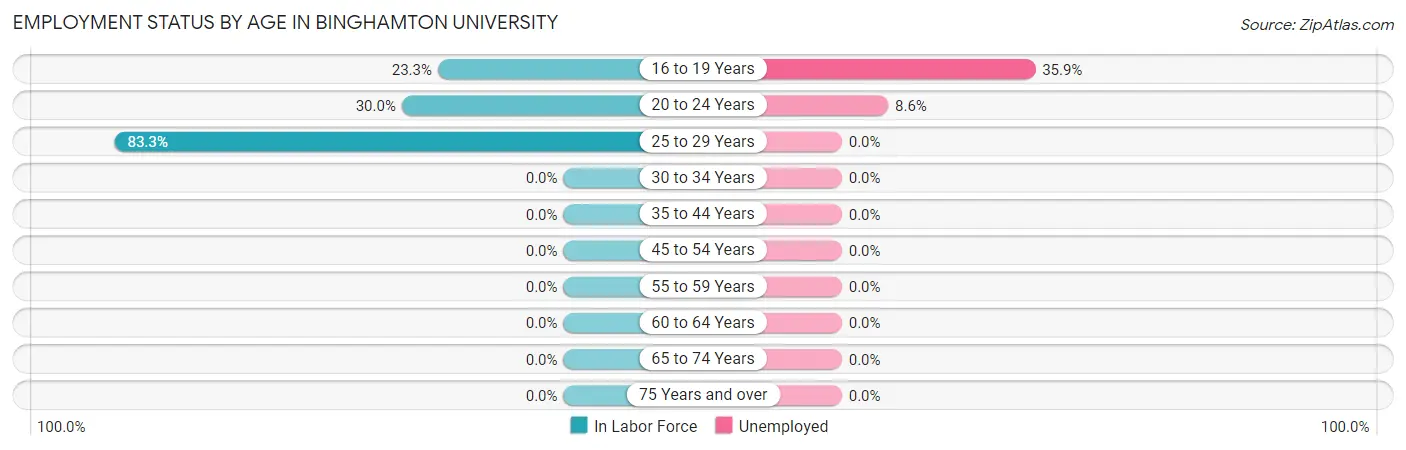
| Age Bracket | In Labor Force | Unemployed |
| 16 to 19 Years | 1,016 (23.3%) | 365 (35.9%) |
| 20 to 24 Years | 604 (30.0%) | 52 (8.6%) |
| 25 to 29 Years | 25 (83.3%) | 0 (0.0%) |
| 30 to 34 Years | 0 (0.0%) | 0 (0.0%) |
| 35 to 44 Years | 0 (0.0%) | 0 (0.0%) |
| 45 to 54 Years | 0 (0.0%) | 0 (0.0%) |
| 55 to 59 Years | 0 (0.0%) | 0 (0.0%) |
| 60 to 64 Years | 0 (0.0%) | 0 (0.0%) |
| 65 to 74 Years | 0 (0.0%) | 0 (0.0%) |
| 75 Years and over | 0 (0.0%) | 0 (0.0%) |
| Total | 1,646 (25.7%) | 416 (25.3%) |
Employment Status by Educational Attainment in Binghamton University
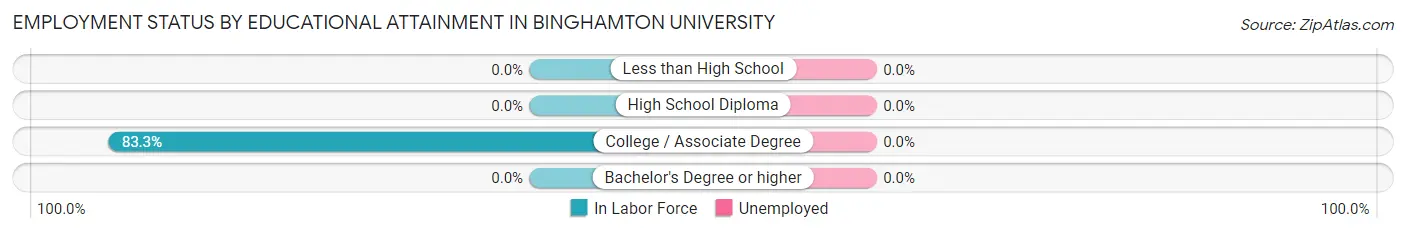
| Educational Attainment | In Labor Force | Unemployed |
| Less than High School | 0 (0.0%) | 0 (0.0%) |
| High School Diploma | 0 (0.0%) | 0 (0.0%) |
| College / Associate Degree | 25 (83.3%) | 0 (0.0%) |
| Bachelor's Degree or higher | 0 (0.0%) | 0 (0.0%) |
| Total | 25 (83.3%) | 0 (0.0%) |
Employment Occupations by Sex in Binghamton University
Management, Business, Science and Arts Occupations
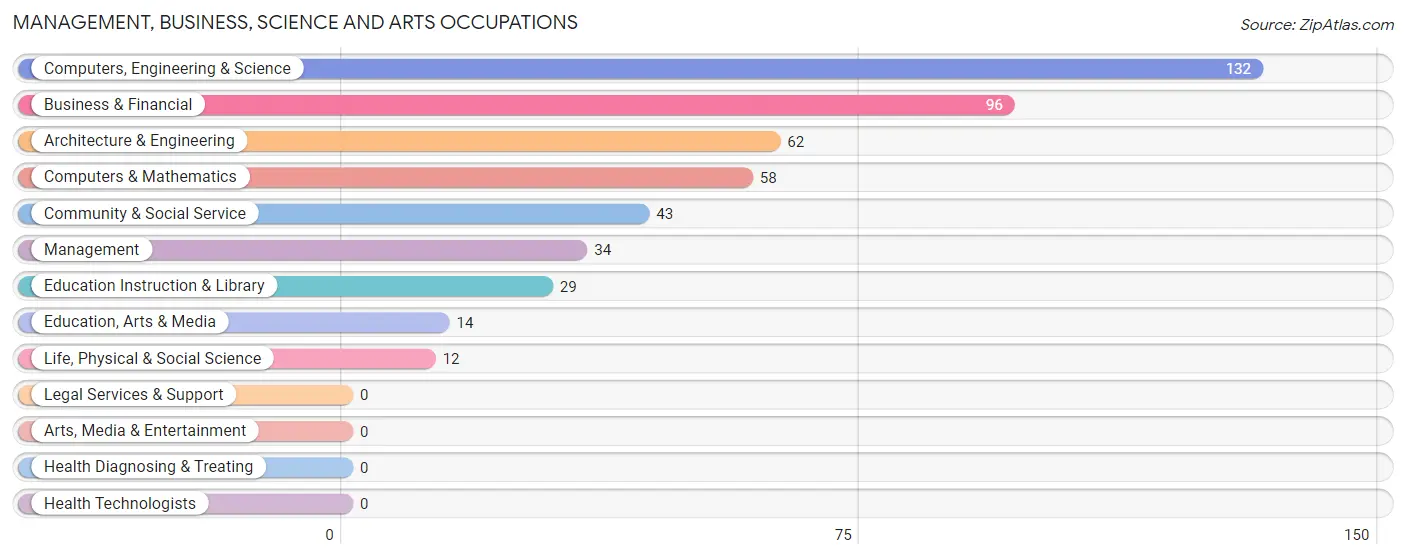
The most common Management, Business, Science and Arts occupations in Binghamton University are Computers, Engineering & Science (132 | 10.8%), Business & Financial (96 | 7.8%), Architecture & Engineering (62 | 5.1%), Computers & Mathematics (58 | 4.7%), and Community & Social Service (43 | 3.5%).
Management, Business, Science and Arts Occupations by Sex
Within the Management, Business, Science and Arts occupations in Binghamton University, the most male-oriented occupations are Business & Financial (100.0%), Computers & Mathematics (100.0%), and Life, Physical & Social Science (100.0%), while the most female-oriented occupations are Education, Arts & Media (100.0%), Architecture & Engineering (79.0%), and Community & Social Service (62.8%).
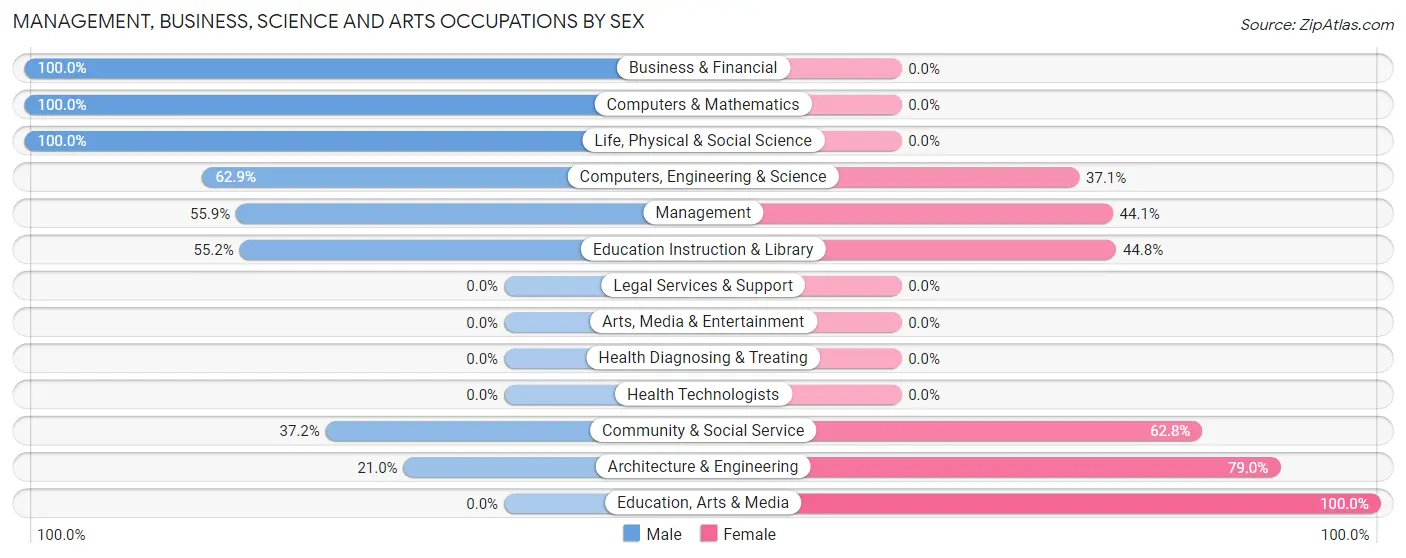
| Occupation | Male | Female |
| Management | 19 (55.9%) | 15 (44.1%) |
| Business & Financial | 96 (100.0%) | 0 (0.0%) |
| Computers, Engineering & Science | 83 (62.9%) | 49 (37.1%) |
| Computers & Mathematics | 58 (100.0%) | 0 (0.0%) |
| Architecture & Engineering | 13 (21.0%) | 49 (79.0%) |
| Life, Physical & Social Science | 12 (100.0%) | 0 (0.0%) |
| Community & Social Service | 16 (37.2%) | 27 (62.8%) |
| Education, Arts & Media | 0 (0.0%) | 14 (100.0%) |
| Legal Services & Support | 0 (0.0%) | 0 (0.0%) |
| Education Instruction & Library | 16 (55.2%) | 13 (44.8%) |
| Arts, Media & Entertainment | 0 (0.0%) | 0 (0.0%) |
| Health Diagnosing & Treating | 0 (0.0%) | 0 (0.0%) |
| Health Technologists | 0 (0.0%) | 0 (0.0%) |
| Total (Category) | 214 (70.2%) | 91 (29.8%) |
| Total (Overall) | 466 (38.0%) | 761 (62.0%) |
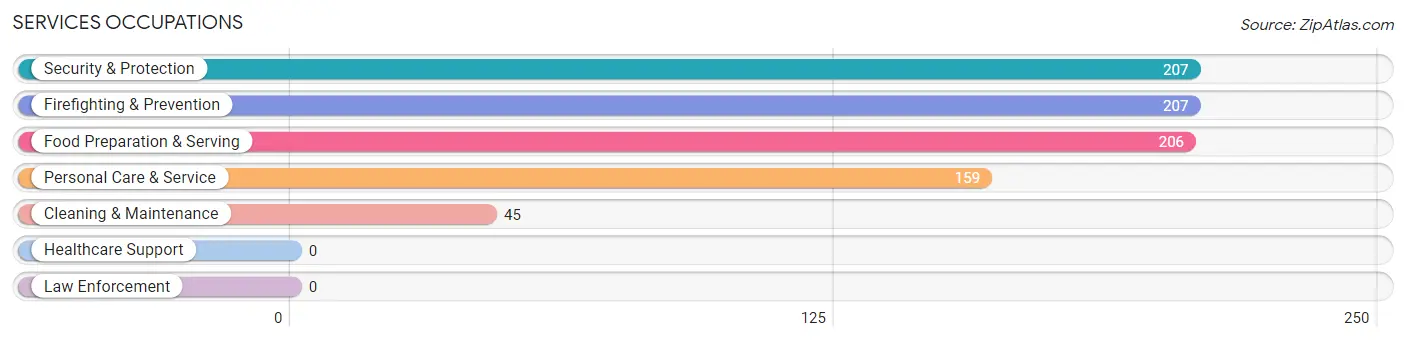
Services Occupations
The most common Services occupations in Binghamton University are Security & Protection (207 | 16.9%), Firefighting & Prevention (207 | 16.9%), Food Preparation & Serving (206 | 16.8%), Personal Care & Service (159 | 13.0%), and Cleaning & Maintenance (45 | 3.7%).
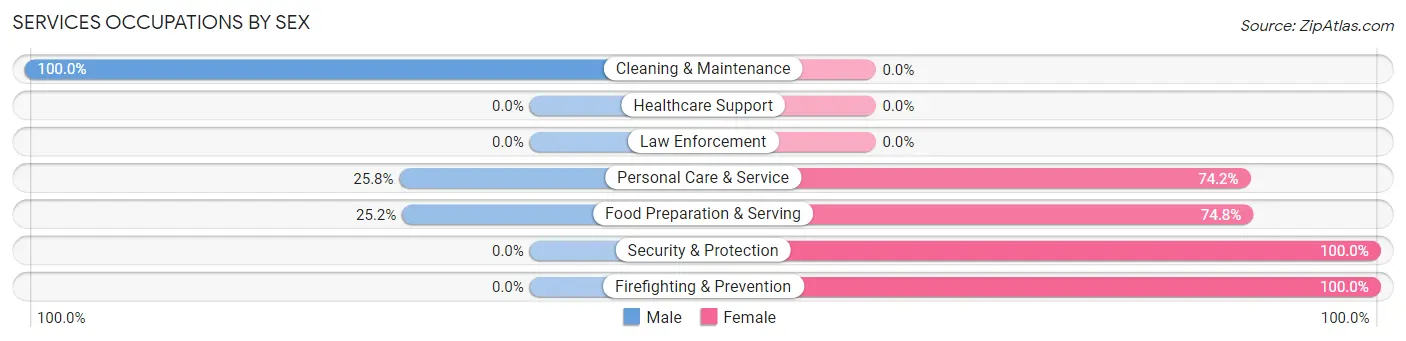
Services Occupations by Sex
Within the Services occupations in Binghamton University, the most male-oriented occupations are Cleaning & Maintenance (100.0%), Personal Care & Service (25.8%), and Food Preparation & Serving (25.2%), while the most female-oriented occupations are Security & Protection (100.0%), Firefighting & Prevention (100.0%), and Food Preparation & Serving (74.8%).
| Occupation | Male | Female |
| Healthcare Support | 0 (0.0%) | 0 (0.0%) |
| Security & Protection | 0 (0.0%) | 207 (100.0%) |
| Firefighting & Prevention | 0 (0.0%) | 207 (100.0%) |
| Law Enforcement | 0 (0.0%) | 0 (0.0%) |
| Food Preparation & Serving | 52 (25.2%) | 154 (74.8%) |
| Cleaning & Maintenance | 45 (100.0%) | 0 (0.0%) |
| Personal Care & Service | 41 (25.8%) | 118 (74.2%) |
| Total (Category) | 138 (22.4%) | 479 (77.6%) |
| Total (Overall) | 466 (38.0%) | 761 (62.0%) |
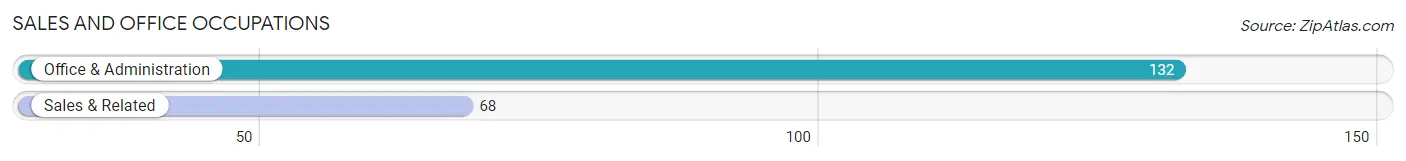
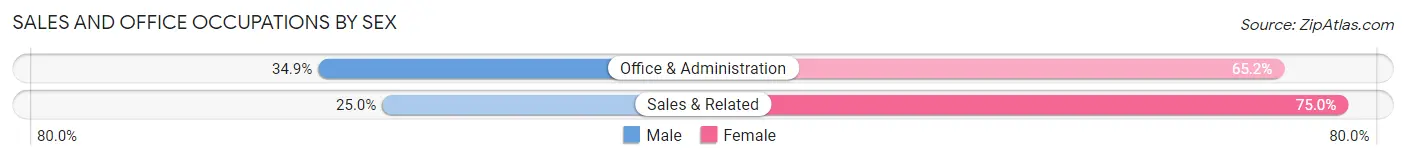
Sales and Office Occupations
The most common Sales and Office occupations in Binghamton University are Office & Administration (132 | 10.8%), and Sales & Related (68 | 5.5%).
Sales and Office Occupations by Sex
| Occupation | Male | Female |
| Sales & Related | 17 (25.0%) | 51 (75.0%) |
| Office & Administration | 46 (34.8%) | 86 (65.1%) |
| Total (Category) | 63 (31.5%) | 137 (68.5%) |
| Total (Overall) | 466 (38.0%) | 761 (62.0%) |
Natural Resources, Construction and Maintenance Occupations
Natural Resources, Construction and Maintenance Occupations by Sex
| Occupation | Male | Female |
| Farming, Fishing & Forestry | 0 (0.0%) | 0 (0.0%) |
| Construction & Extraction | 0 (0.0%) | 0 (0.0%) |
| Installation, Maintenance & Repair | 0 (0.0%) | 0 (0.0%) |
| Total (Category) | 0 (0.0%) | 0 (0.0%) |
| Total (Overall) | 466 (38.0%) | 761 (62.0%) |
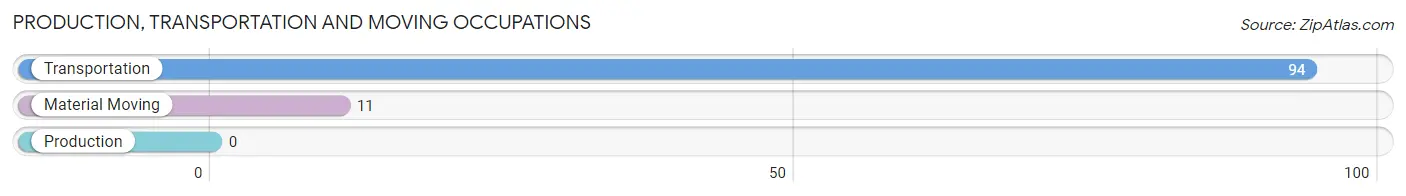
Production, Transportation and Moving Occupations
The most common Production, Transportation and Moving occupations in Binghamton University are Transportation (94 | 7.7%), and Material Moving (11 | 0.9%).
Production, Transportation and Moving Occupations by Sex
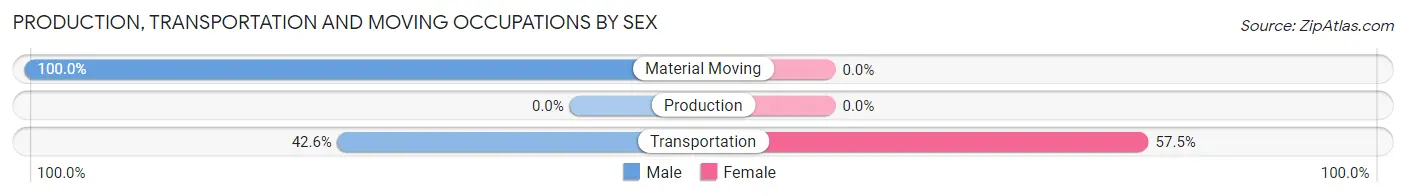
| Occupation | Male | Female |
| Production | 0 (0.0%) | 0 (0.0%) |
| Transportation | 40 (42.5%) | 54 (57.5%) |
| Material Moving | 11 (100.0%) | 0 (0.0%) |
| Total (Category) | 51 (48.6%) | 54 (51.4%) |
| Total (Overall) | 466 (38.0%) | 761 (62.0%) |
Employment Industries by Sex in Binghamton University
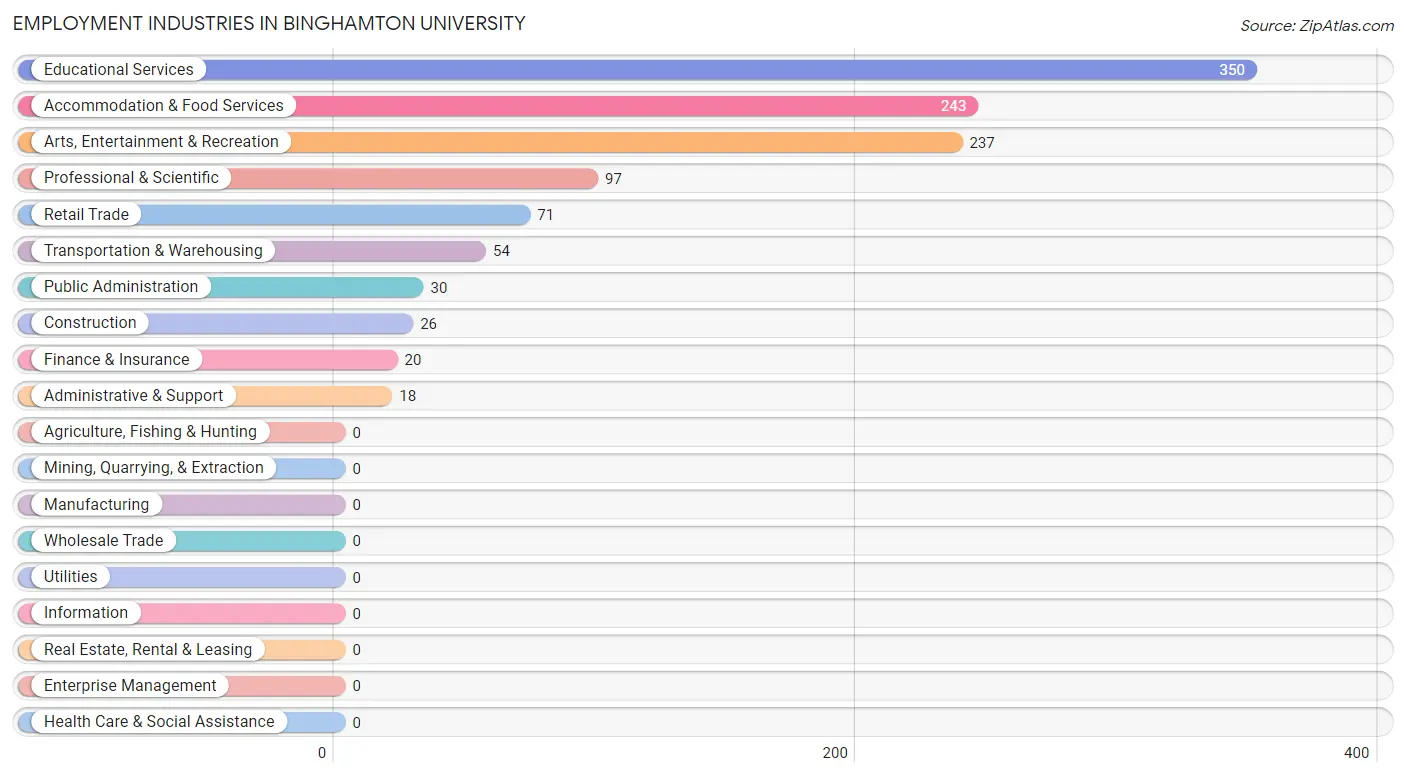
Employment Industries in Binghamton University
The major employment industries in Binghamton University include Educational Services (350 | 28.5%), Accommodation & Food Services (243 | 19.8%), Arts, Entertainment & Recreation (237 | 19.3%), Professional & Scientific (97 | 7.9%), and Retail Trade (71 | 5.8%).
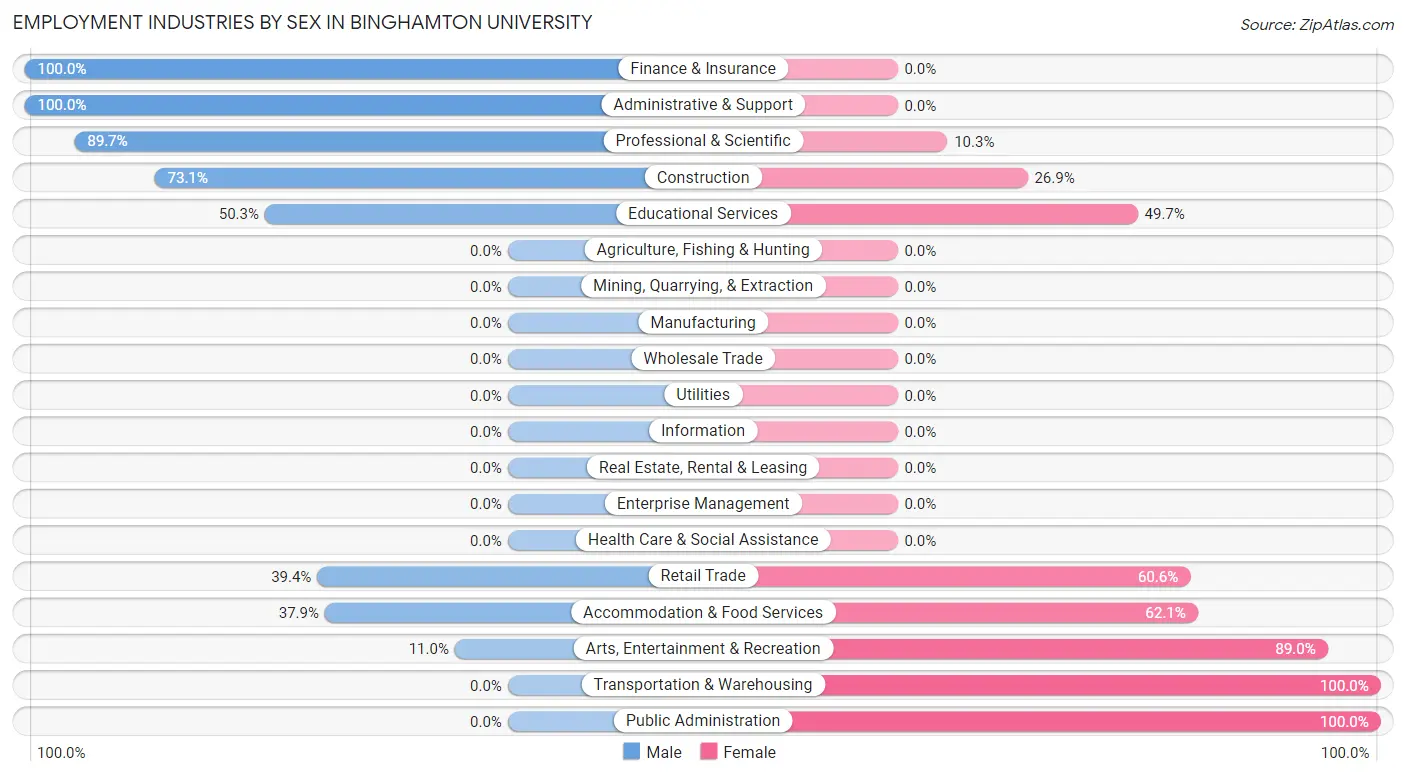
Employment Industries by Sex in Binghamton University
The Binghamton University industries that see more men than women are Finance & Insurance (100.0%), Administrative & Support (100.0%), and Professional & Scientific (89.7%), whereas the industries that tend to have a higher number of women are Transportation & Warehousing (100.0%), Public Administration (100.0%), and Arts, Entertainment & Recreation (89.0%).
| Industry | Male | Female |
| Agriculture, Fishing & Hunting | 0 (0.0%) | 0 (0.0%) |
| Mining, Quarrying, & Extraction | 0 (0.0%) | 0 (0.0%) |
| Construction | 19 (73.1%) | 7 (26.9%) |
| Manufacturing | 0 (0.0%) | 0 (0.0%) |
| Wholesale Trade | 0 (0.0%) | 0 (0.0%) |
| Retail Trade | 28 (39.4%) | 43 (60.6%) |
| Transportation & Warehousing | 0 (0.0%) | 54 (100.0%) |
| Utilities | 0 (0.0%) | 0 (0.0%) |
| Information | 0 (0.0%) | 0 (0.0%) |
| Finance & Insurance | 20 (100.0%) | 0 (0.0%) |
| Real Estate, Rental & Leasing | 0 (0.0%) | 0 (0.0%) |
| Professional & Scientific | 87 (89.7%) | 10 (10.3%) |
| Enterprise Management | 0 (0.0%) | 0 (0.0%) |
| Administrative & Support | 18 (100.0%) | 0 (0.0%) |
| Educational Services | 176 (50.3%) | 174 (49.7%) |
| Health Care & Social Assistance | 0 (0.0%) | 0 (0.0%) |
| Arts, Entertainment & Recreation | 26 (11.0%) | 211 (89.0%) |
| Accommodation & Food Services | 92 (37.9%) | 151 (62.1%) |
| Public Administration | 0 (0.0%) | 30 (100.0%) |
| Total | 466 (38.0%) | 761 (62.0%) |
Education in Binghamton University
School Enrollment in Binghamton University
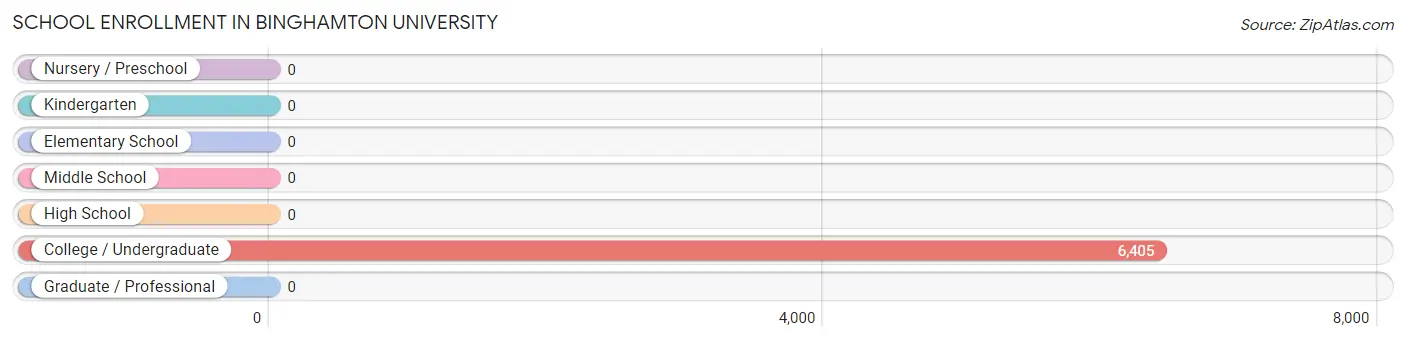
| School Level | # Students | % Students |
| Nursery / Preschool | 0 | 0.0% |
| Kindergarten | 0 | 0.0% |
| Elementary School | 0 | 0.0% |
| Middle School | 0 | 0.0% |
| High School | 0 | 0.0% |
| College / Undergraduate | 6,405 | 100.0% |
| Graduate / Professional | 0 | 0.0% |
| Total | 6,405 | 100.0% |
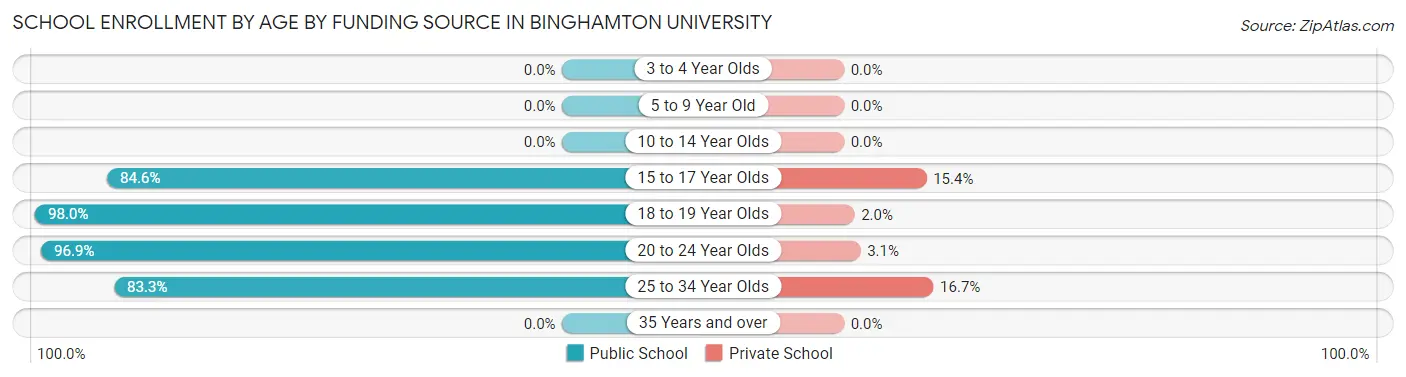
School Enrollment by Age by Funding Source in Binghamton University
Out of a total of 6,405 students who are enrolled in schools in Binghamton University, 160 (2.5%) attend a private institution, while the remaining 6,245 (97.5%) are enrolled in public schools. The age group of 25 to 34 year olds has the highest likelihood of being enrolled in private schools, with 5 (16.7% in the age bracket) enrolled. Conversely, the age group of 18 to 19 year olds has the lowest likelihood of being enrolled in a private school, with 4,200 (98.0% in the age bracket) attending a public institution.
| Age Bracket | Public School | Private School |
| 3 to 4 Year Olds | 0 (0.0%) | 0 (0.0%) |
| 5 to 9 Year Old | 0 (0.0%) | 0 (0.0%) |
| 10 to 14 Year Olds | 0 (0.0%) | 0 (0.0%) |
| 15 to 17 Year Olds | 66 (84.6%) | 12 (15.4%) |
| 18 to 19 Year Olds | 4,200 (98.0%) | 84 (2.0%) |
| 20 to 24 Year Olds | 1,951 (96.9%) | 62 (3.1%) |
| 25 to 34 Year Olds | 25 (83.3%) | 5 (16.7%) |
| 35 Years and over | 0 (0.0%) | 0 (0.0%) |
| Total | 6,245 (97.5%) | 160 (2.5%) |
Educational Attainment by Field of Study in Binghamton University
| Field of Study | # Graduates | % Graduates |
| Computers & Mathematics | 0 | 0.0% |
| Bio, Nature & Agricultural | 0 | 0.0% |
| Physical & Health Sciences | 0 | 0.0% |
| Psychology | 0 | 0.0% |
| Social Sciences | 0 | 0.0% |
| Engineering | 0 | 0.0% |
| Multidisciplinary Studies | 0 | 0.0% |
| Science & Technology | 0 | 0.0% |
| Business | 0 | 0.0% |
| Education | 0 | 0.0% |
| Literature & Languages | 0 | 0.0% |
| Liberal Arts & History | 0 | 0.0% |
| Visual & Performing Arts | 0 | 0.0% |
| Communications | 0 | 0.0% |
| Arts & Humanities | 0 | 0.0% |
| Total | 0 | 0.0% |
Transportation & Commute in Binghamton University
Vehicle Availability by Sex in Binghamton University
| Vehicles Available | Male | Female |
| No Vehicle | 0 (0.0%) | 0 (0.0%) |
| 1 Vehicle | 0 (0.0%) | 0 (0.0%) |
| 2 Vehicles | 0 (0.0%) | 0 (0.0%) |
| 3 Vehicles | 0 (0.0%) | 0 (0.0%) |
| 4 Vehicles | 0 (0.0%) | 0 (0.0%) |
| 5 or more Vehicles | 0 (0.0%) | 0 (0.0%) |
| Total | 0 (0.0%) | 0 (0.0%) |
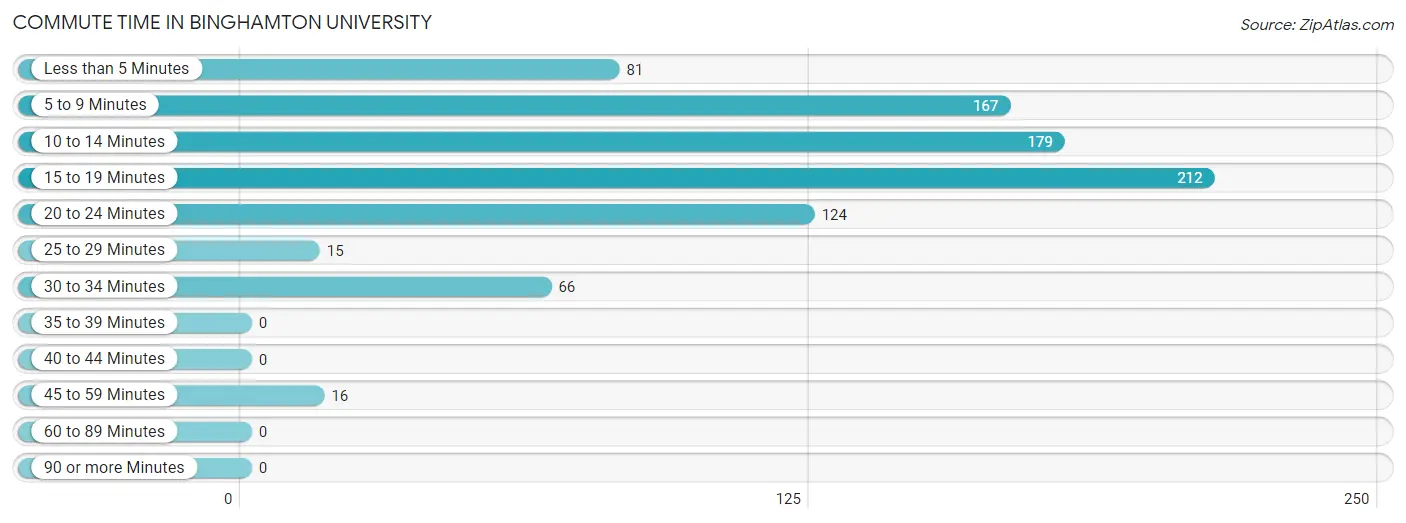
Commute Time in Binghamton University
The most frequently occuring commute durations in Binghamton University are 15 to 19 minutes (212 commuters, 24.6%), 10 to 14 minutes (179 commuters, 20.8%), and 5 to 9 minutes (167 commuters, 19.4%).
| Commute Time | # Commuters | % Commuters |
| Less than 5 Minutes | 81 | 9.4% |
| 5 to 9 Minutes | 167 | 19.4% |
| 10 to 14 Minutes | 179 | 20.8% |
| 15 to 19 Minutes | 212 | 24.6% |
| 20 to 24 Minutes | 124 | 14.4% |
| 25 to 29 Minutes | 15 | 1.7% |
| 30 to 34 Minutes | 66 | 7.7% |
| 35 to 39 Minutes | 0 | 0.0% |
| 40 to 44 Minutes | 0 | 0.0% |
| 45 to 59 Minutes | 16 | 1.9% |
| 60 to 89 Minutes | 0 | 0.0% |
| 90 or more Minutes | 0 | 0.0% |
Commute Time by Sex in Binghamton University
The most common commute times in Binghamton University are 15 to 19 minutes (97 commuters, 35.1%) for males and 10 to 14 minutes (158 commuters, 27.1%) for females.
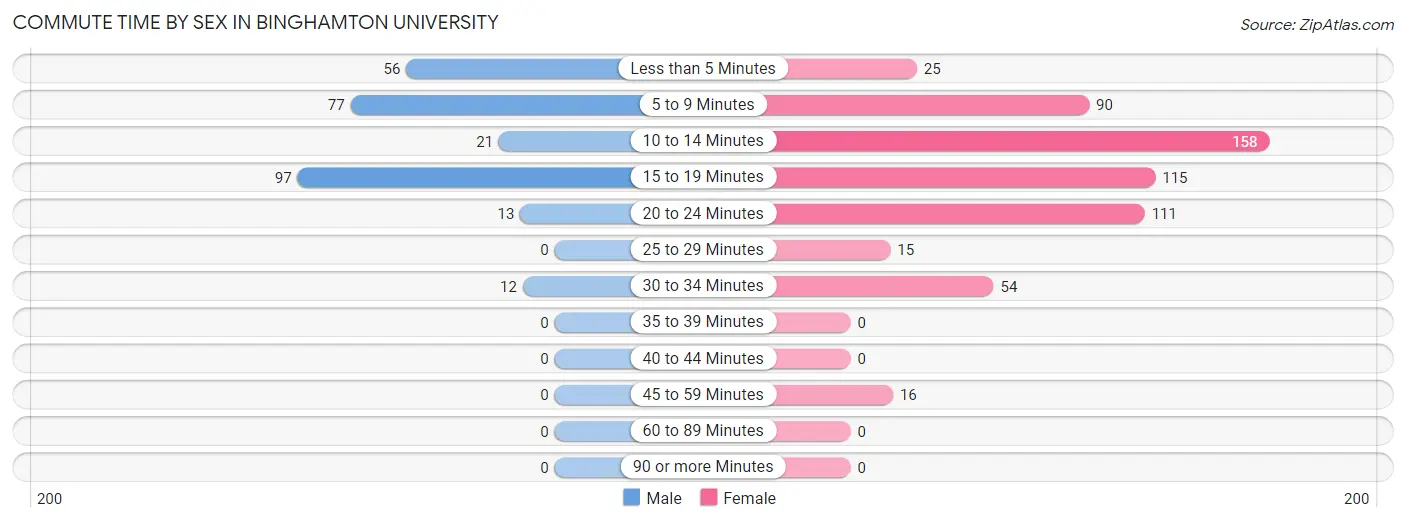
| Commute Time | Male | Female |
| Less than 5 Minutes | 56 (20.3%) | 25 (4.3%) |
| 5 to 9 Minutes | 77 (27.9%) | 90 (15.4%) |
| 10 to 14 Minutes | 21 (7.6%) | 158 (27.1%) |
| 15 to 19 Minutes | 97 (35.1%) | 115 (19.7%) |
| 20 to 24 Minutes | 13 (4.7%) | 111 (19.0%) |
| 25 to 29 Minutes | 0 (0.0%) | 15 (2.6%) |
| 30 to 34 Minutes | 12 (4.3%) | 54 (9.2%) |
| 35 to 39 Minutes | 0 (0.0%) | 0 (0.0%) |
| 40 to 44 Minutes | 0 (0.0%) | 0 (0.0%) |
| 45 to 59 Minutes | 0 (0.0%) | 16 (2.7%) |
| 60 to 89 Minutes | 0 (0.0%) | 0 (0.0%) |
| 90 or more Minutes | 0 (0.0%) | 0 (0.0%) |
Time of Departure to Work by Sex in Binghamton University
The most frequent times of departure to work in Binghamton University are 10:00 AM to 10:59 AM (81, 29.3%) for males and 12:00 PM to 3:59 PM (197, 33.7%) for females.
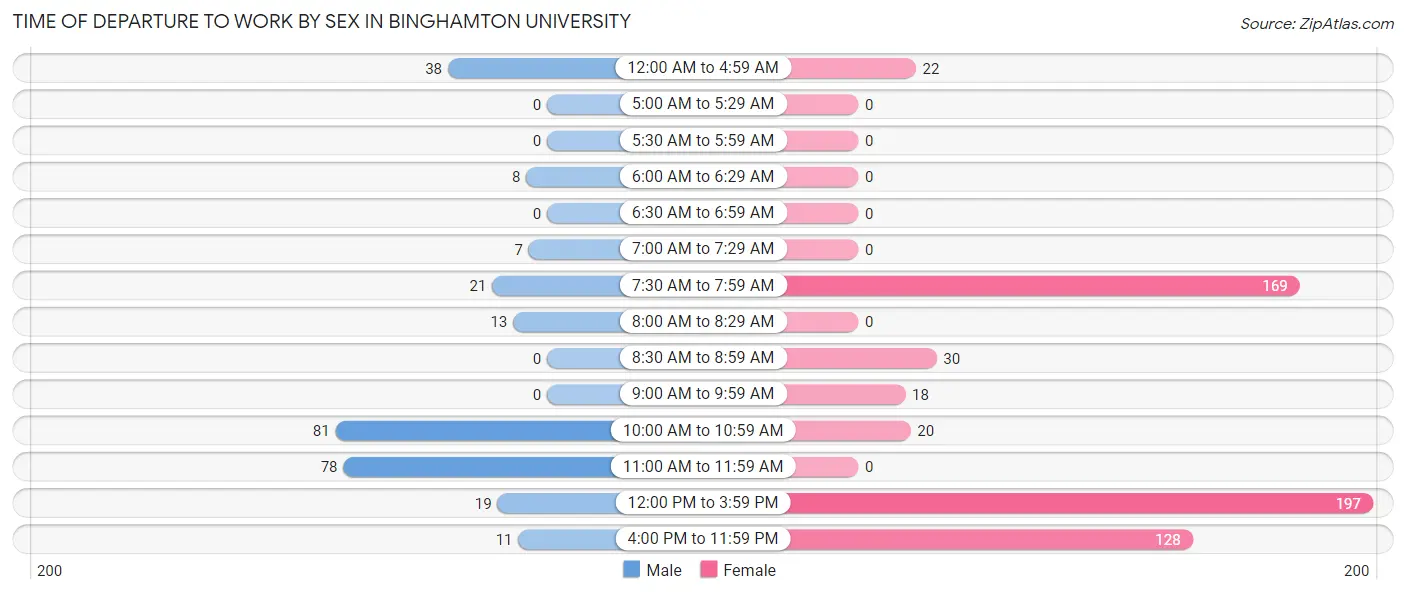
| Time of Departure | Male | Female |
| 12:00 AM to 4:59 AM | 38 (13.8%) | 22 (3.8%) |
| 5:00 AM to 5:29 AM | 0 (0.0%) | 0 (0.0%) |
| 5:30 AM to 5:59 AM | 0 (0.0%) | 0 (0.0%) |
| 6:00 AM to 6:29 AM | 8 (2.9%) | 0 (0.0%) |
| 6:30 AM to 6:59 AM | 0 (0.0%) | 0 (0.0%) |
| 7:00 AM to 7:29 AM | 7 (2.5%) | 0 (0.0%) |
| 7:30 AM to 7:59 AM | 21 (7.6%) | 169 (28.9%) |
| 8:00 AM to 8:29 AM | 13 (4.7%) | 0 (0.0%) |
| 8:30 AM to 8:59 AM | 0 (0.0%) | 30 (5.1%) |
| 9:00 AM to 9:59 AM | 0 (0.0%) | 18 (3.1%) |
| 10:00 AM to 10:59 AM | 81 (29.3%) | 20 (3.4%) |
| 11:00 AM to 11:59 AM | 78 (28.3%) | 0 (0.0%) |
| 12:00 PM to 3:59 PM | 19 (6.9%) | 197 (33.7%) |
| 4:00 PM to 11:59 PM | 11 (4.0%) | 128 (21.9%) |
| Total | 276 (100.0%) | 584 (100.0%) |
Housing Occupancy in Binghamton University
Occupancy by Ownership in Binghamton University
| Occupancy | # Housing Units | % Housing Units |
| Owner Occupied Housing Units | 0 | 0.0% |
| Renter-Occupied Housing Units | 0 | 0.0% |
| Total Occupied Housing Units | 0 | 0.0% |
Occupancy by Household Size in Binghamton University
| Household Size | # Housing Units | % Housing Units |
| 1-Person Household | 0 | 0.0% |
| 2-Person Household | 0 | 0.0% |
| 3-Person Household | 0 | 0.0% |
| 4+ Person Household | 0 | 0.0% |
| Total Housing Units | 0 | 0.0% |
Occupancy by Ownership by Household Size in Binghamton University
| Household Size | Owner-occupied | Renter-occupied |
| 1-Person Household | 0 (0.0%) | 0 (0.0%) |
| 2-Person Household | 0 (0.0%) | 0 (0.0%) |
| 3-Person Household | 0 (0.0%) | 0 (0.0%) |
| 4+ Person Household | 0 (0.0%) | 0 (0.0%) |
| Total Housing Units | 0 (0.0%) | 0 (0.0%) |
Occupancy by Educational Attainment in Binghamton University
| Household Size | Owner-occupied | Renter-occupied |
| Less than High School | 0 (0.0%) | 0 (0.0%) |
| High School Diploma | 0 (0.0%) | 0 (0.0%) |
| College/Associate Degree | 0 (0.0%) | 0 (0.0%) |
| Bachelor's Degree or higher | 0 (0.0%) | 0 (0.0%) |
Occupancy by Age of Householder in Binghamton University
| Age Bracket | # Households | % Households |
| Under 35 Years | 0 | 0.0% |
| 35 to 44 Years | 0 | 0.0% |
| 45 to 54 Years | 0 | 0.0% |
| 55 to 64 Years | 0 | 0.0% |
| 65 to 74 Years | 0 | 0.0% |
| 75 to 84 Years | 0 | 0.0% |
| 85 Years and Over | 0 | 0.0% |
| Total | 0 | 0.0% |
Housing Finances in Binghamton University
Median Income by Occupancy in Binghamton University
| Occupancy Type | # Households | Median Income |
| Owner-Occupied | 0 (0.0%) | $0 |
| Renter-Occupied | 0 (0.0%) | $0 |
| Average | 0 (0.0%) | $0 |
Occupancy by Householder Income Bracket in Binghamton University
| Income Bracket | Owner-occupied | Renter-occupied |
| Less than $5,000 | 0 (0.0%) | 0 (0.0%) |
| $5,000 to $9,999 | 0 (0.0%) | 0 (0.0%) |
| $10,000 to $14,999 | 0 (0.0%) | 0 (0.0%) |
| $15,000 to $19,999 | 0 (0.0%) | 0 (0.0%) |
| $20,000 to $24,999 | 0 (0.0%) | 0 (0.0%) |
| $25,000 to $34,999 | 0 (0.0%) | 0 (0.0%) |
| $35,000 to $49,999 | 0 (0.0%) | 0 (0.0%) |
| $50,000 to $74,999 | 0 (0.0%) | 0 (0.0%) |
| $75,000 to $99,999 | 0 (0.0%) | 0 (0.0%) |
| $100,000 to $149,999 | 0 (0.0%) | 0 (0.0%) |
| $150,000 or more | 0 (0.0%) | 0 (0.0%) |
| Total | 0 (0.0%) | 0 (0.0%) |
Monthly Housing Cost Tiers in Binghamton University
| Monthly Cost | Owner-occupied | Renter-occupied |
| Less than $300 | 0 (0.0%) | 0 (0.0%) |
| $300 to $499 | 0 (0.0%) | 0 (0.0%) |
| $500 to $799 | 0 (0.0%) | 0 (0.0%) |
| $800 to $999 | 0 (0.0%) | 0 (0.0%) |
| $1,000 to $1,499 | 0 (0.0%) | 0 (0.0%) |
| $1,500 to $1,999 | 0 (0.0%) | 0 (0.0%) |
| $2,000 to $2,499 | 0 (0.0%) | 0 (0.0%) |
| $2,500 to $2,999 | 0 (0.0%) | 0 (0.0%) |
| $3,000 or more | 0 (0.0%) | 0 (0.0%) |
| Total | 0 (0.0%) | 0 (0.0%) |
Physical Housing Characteristics in Binghamton University
Housing Structures in Binghamton University
| Structure Type | # Housing Units | % Housing Units |
| Single Unit, Detached | 0 | 0.0% |
| Single Unit, Attached | 0 | 0.0% |
| 2 Unit Apartments | 0 | 0.0% |
| 3 or 4 Unit Apartments | 0 | 0.0% |
| 5 to 9 Unit Apartments | 0 | 0.0% |
| 10 or more Apartments | 0 | 0.0% |
| Mobile Home / Other | 0 | 0.0% |
| Total | 0 | 0.0% |
Housing Structures by Occupancy in Binghamton University
| Structure Type | Owner-occupied | Renter-occupied |
| Single Unit, Detached | 0 (0.0%) | 0 (0.0%) |
| Single Unit, Attached | 0 (0.0%) | 0 (0.0%) |
| 2 Unit Apartments | 0 (0.0%) | 0 (0.0%) |
| 3 or 4 Unit Apartments | 0 (0.0%) | 0 (0.0%) |
| 5 to 9 Unit Apartments | 0 (0.0%) | 0 (0.0%) |
| 10 or more Apartments | 0 (0.0%) | 0 (0.0%) |
| Mobile Home / Other | 0 (0.0%) | 0 (0.0%) |
| Total | 0 (0.0%) | 0 (0.0%) |
Housing Structures by Number of Rooms in Binghamton University
| Number of Rooms | Owner-occupied | Renter-occupied |
| 1 Room | 0 (0.0%) | 0 (0.0%) |
| 2 or 3 Rooms | 0 (0.0%) | 0 (0.0%) |
| 4 or 5 Rooms | 0 (0.0%) | 0 (0.0%) |
| 6 or 7 Rooms | 0 (0.0%) | 0 (0.0%) |
| 8 or more Rooms | 0 (0.0%) | 0 (0.0%) |
| Total | 0 (0.0%) | 0 (0.0%) |
Housing Structure by Heating Type in Binghamton University
| Heating Type | Owner-occupied | Renter-occupied |
| Utility Gas | 0 (0.0%) | 0 (0.0%) |
| Bottled, Tank, or LP Gas | 0 (0.0%) | 0 (0.0%) |
| Electricity | 0 (0.0%) | 0 (0.0%) |
| Fuel Oil or Kerosene | 0 (0.0%) | 0 (0.0%) |
| Coal or Coke | 0 (0.0%) | 0 (0.0%) |
| All other Fuels | 0 (0.0%) | 0 (0.0%) |
| No Fuel Used | 0 (0.0%) | 0 (0.0%) |
| Total | 0 (0.0%) | 0 (0.0%) |
Household Vehicle Usage in Binghamton University
| Vehicles per Household | Owner-occupied | Renter-occupied |
| No Vehicle | 0 (0.0%) | 0 (0.0%) |
| 1 Vehicle | 0 (0.0%) | 0 (0.0%) |
| 2 Vehicles | 0 (0.0%) | 0 (0.0%) |
| 3 or more Vehicles | 0 (0.0%) | 0 (0.0%) |
| Total | 0 (0.0%) | 0 (0.0%) |
Real Estate & Mortgages in Binghamton University
Real Estate and Mortgage Overview in Binghamton University
| Characteristic | Without Mortgage | With Mortgage |
| Housing Units | 0 | 0 |
| Median Property Value | - | - |
| Median Household Income | - | - |
| Monthly Housing Costs | - | - |
| Real Estate Taxes | - | - |
Property Value by Mortgage Status in Binghamton University
| Property Value | Without Mortgage | With Mortgage |
| Less than $50,000 | 0 (0.0%) | 0 (0.0%) |
| $50,000 to $99,999 | 0 (0.0%) | 0 (0.0%) |
| $100,000 to $299,999 | 0 (0.0%) | 0 (0.0%) |
| $300,000 to $499,999 | 0 (0.0%) | 0 (0.0%) |
| $500,000 to $749,999 | 0 (0.0%) | 0 (0.0%) |
| $750,000 to $999,999 | 0 (0.0%) | 0 (0.0%) |
| $1,000,000 or more | 0 (0.0%) | 0 (0.0%) |
| Total | 0 (0.0%) | 0 (0.0%) |
Household Income by Mortgage Status in Binghamton University
| Household Income | Without Mortgage | With Mortgage |
| Less than $10,000 | 0 (0.0%) | 0 (0.0%) |
| $10,000 to $24,999 | 0 (0.0%) | 0 (0.0%) |
| $25,000 to $34,999 | 0 (0.0%) | 0 (0.0%) |
| $35,000 to $49,999 | 0 (0.0%) | 0 (0.0%) |
| $50,000 to $74,999 | 0 (0.0%) | 0 (0.0%) |
| $75,000 to $99,999 | 0 (0.0%) | 0 (0.0%) |
| $100,000 to $149,999 | 0 (0.0%) | 0 (0.0%) |
| $150,000 or more | 0 (0.0%) | 0 (0.0%) |
| Total | 0 (0.0%) | 0 (0.0%) |
Property Value to Household Income Ratio in Binghamton University
| Value-to-Income Ratio | Without Mortgage | With Mortgage |
| Less than 2.0x | 0 (0.0%) | 0 (0.0%) |
| 2.0x to 2.9x | 0 (0.0%) | 0 (0.0%) |
| 3.0x to 3.9x | 0 (0.0%) | 0 (0.0%) |
| 4.0x or more | 0 (0.0%) | 0 (0.0%) |
| Total | 0 (0.0%) | 0 (0.0%) |
Real Estate Taxes by Mortgage Status in Binghamton University
| Property Taxes | Without Mortgage | With Mortgage |
| Less than $800 | 0 (0.0%) | 0 (0.0%) |
| $800 to $1,499 | 0 (0.0%) | 0 (0.0%) |
| $800 to $1,499 | 0 (0.0%) | 0 (0.0%) |
| Total | 0 (0.0%) | 0 (0.0%) |
Health & Disability in Binghamton University
Health Insurance Coverage by Age in Binghamton University
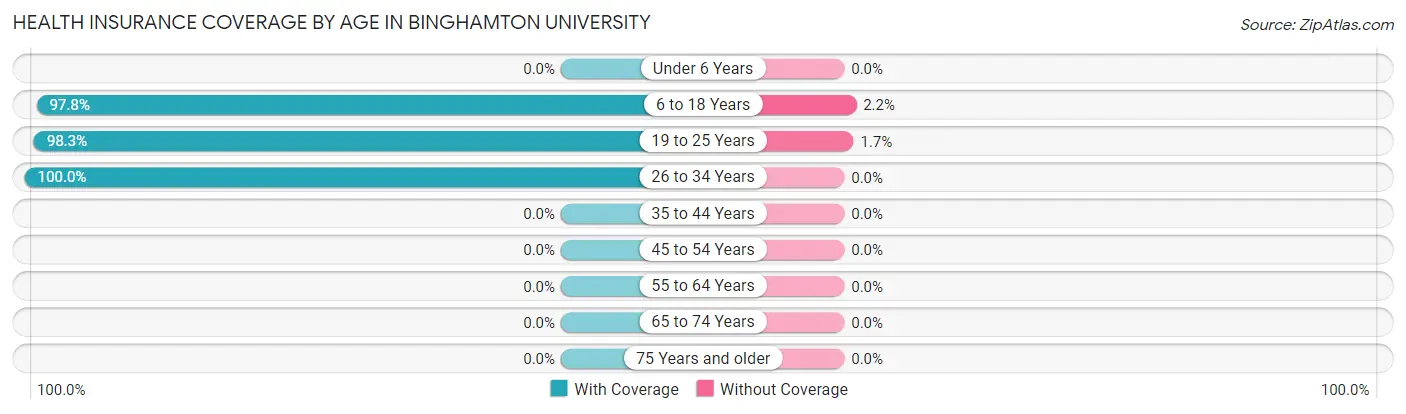
| Age Bracket | With Coverage | Without Coverage |
| Under 6 Years | 0 (0.0%) | 0 (0.0%) |
| 6 to 18 Years | 2,330 (97.8%) | 53 (2.2%) |
| 19 to 25 Years | 3,935 (98.3%) | 69 (1.7%) |
| 26 to 34 Years | 18 (100.0%) | 0 (0.0%) |
| 35 to 44 Years | 0 (0.0%) | 0 (0.0%) |
| 45 to 54 Years | 0 (0.0%) | 0 (0.0%) |
| 55 to 64 Years | 0 (0.0%) | 0 (0.0%) |
| 65 to 74 Years | 0 (0.0%) | 0 (0.0%) |
| 75 Years and older | 0 (0.0%) | 0 (0.0%) |
| Total | 6,283 (98.1%) | 122 (1.9%) |
Health Insurance Coverage by Citizenship Status in Binghamton University
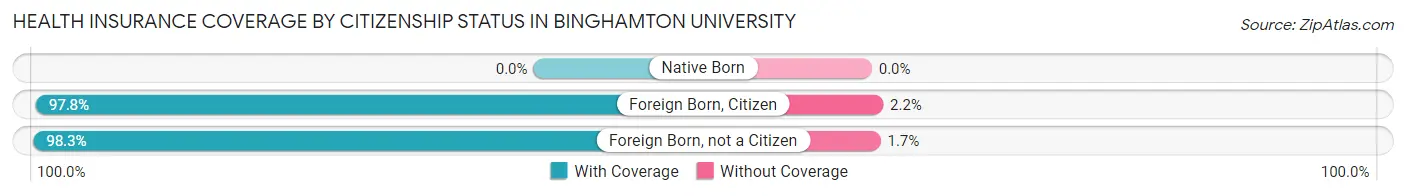
| Citizenship Status | With Coverage | Without Coverage |
| Native Born | 0 (0.0%) | 0 (0.0%) |
| Foreign Born, Citizen | 2,330 (97.8%) | 53 (2.2%) |
| Foreign Born, not a Citizen | 3,935 (98.3%) | 69 (1.7%) |
Health Insurance Coverage by Household Income in Binghamton University
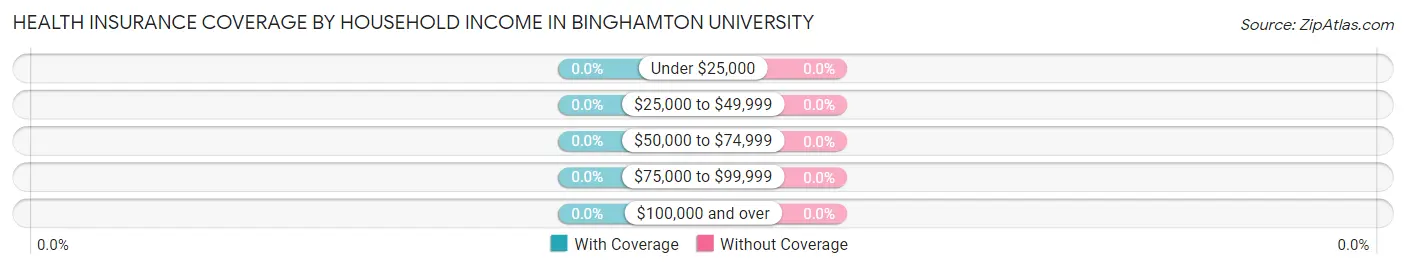
| Household Income | With Coverage | Without Coverage |
| Under $25,000 | 0 (0.0%) | 0 (0.0%) |
| $25,000 to $49,999 | 0 (0.0%) | 0 (0.0%) |
| $50,000 to $74,999 | 0 (0.0%) | 0 (0.0%) |
| $75,000 to $99,999 | 0 (0.0%) | 0 (0.0%) |
| $100,000 and over | 0 (0.0%) | 0 (0.0%) |
Public vs Private Health Insurance Coverage by Age in Binghamton University
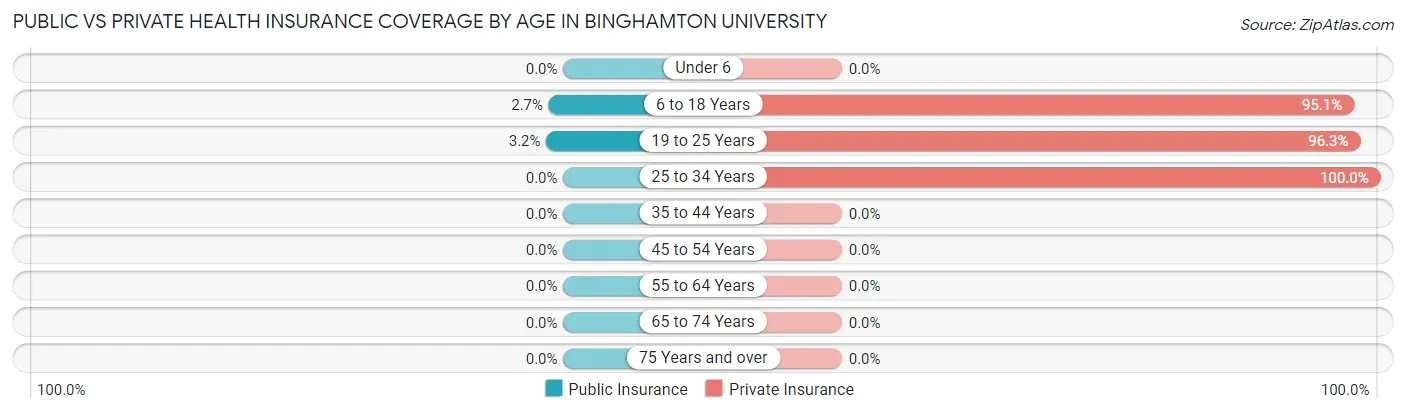
| Age Bracket | Public Insurance | Private Insurance |
| Under 6 | 0 (0.0%) | 0 (0.0%) |
| 6 to 18 Years | 64 (2.7%) | 2,266 (95.1%) |
| 19 to 25 Years | 126 (3.2%) | 3,854 (96.3%) |
| 25 to 34 Years | 0 (0.0%) | 18 (100.0%) |
| 35 to 44 Years | 0 (0.0%) | 0 (0.0%) |
| 45 to 54 Years | 0 (0.0%) | 0 (0.0%) |
| 55 to 64 Years | 0 (0.0%) | 0 (0.0%) |
| 65 to 74 Years | 0 (0.0%) | 0 (0.0%) |
| 75 Years and over | 0 (0.0%) | 0 (0.0%) |
| Total | 190 (3.0%) | 6,138 (95.8%) |
Disability Status by Sex by Age in Binghamton University
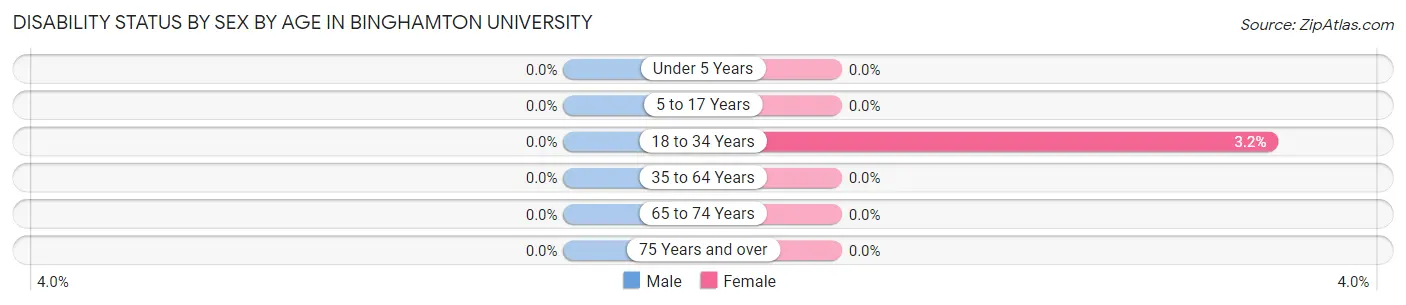
| Age Bracket | Male | Female |
| Under 5 Years | 0 (0.0%) | 0 (0.0%) |
| 5 to 17 Years | 0 (0.0%) | 0 (0.0%) |
| 18 to 34 Years | 0 (0.0%) | 107 (3.2%) |
| 35 to 64 Years | 0 (0.0%) | 0 (0.0%) |
| 65 to 74 Years | 0 (0.0%) | 0 (0.0%) |
| 75 Years and over | 0 (0.0%) | 0 (0.0%) |
Disability Class by Sex by Age in Binghamton University
Disability Class: Hearing Difficulty
| Age Bracket | Male | Female |
| Under 5 Years | 0 (0.0%) | 0 (0.0%) |
| 5 to 17 Years | 0 (0.0%) | 0 (0.0%) |
| 18 to 34 Years | 0 (0.0%) | 0 (0.0%) |
| 35 to 64 Years | 0 (0.0%) | 0 (0.0%) |
| 65 to 74 Years | 0 (0.0%) | 0 (0.0%) |
| 75 Years and over | 0 (0.0%) | 0 (0.0%) |
Disability Class: Vision Difficulty
| Age Bracket | Male | Female |
| Under 5 Years | 0 (0.0%) | 0 (0.0%) |
| 5 to 17 Years | 0 (0.0%) | 0 (0.0%) |
| 18 to 34 Years | 0 (0.0%) | 0 (0.0%) |
| 35 to 64 Years | 0 (0.0%) | 0 (0.0%) |
| 65 to 74 Years | 0 (0.0%) | 0 (0.0%) |
| 75 Years and over | 0 (0.0%) | 0 (0.0%) |
Disability Class: Cognitive Difficulty
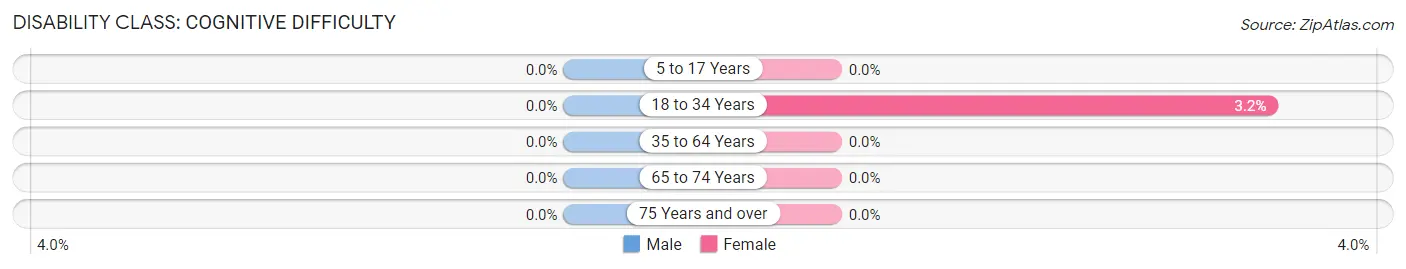
| Age Bracket | Male | Female |
| 5 to 17 Years | 0 (0.0%) | 0 (0.0%) |
| 18 to 34 Years | 0 (0.0%) | 107 (3.2%) |
| 35 to 64 Years | 0 (0.0%) | 0 (0.0%) |
| 65 to 74 Years | 0 (0.0%) | 0 (0.0%) |
| 75 Years and over | 0 (0.0%) | 0 (0.0%) |
Disability Class: Ambulatory Difficulty
| Age Bracket | Male | Female |
| 5 to 17 Years | 0 (0.0%) | 0 (0.0%) |
| 18 to 34 Years | 0 (0.0%) | 0 (0.0%) |
| 35 to 64 Years | 0 (0.0%) | 0 (0.0%) |
| 65 to 74 Years | 0 (0.0%) | 0 (0.0%) |
| 75 Years and over | 0 (0.0%) | 0 (0.0%) |
Disability Class: Self-Care Difficulty
| Age Bracket | Male | Female |
| 5 to 17 Years | 0 (0.0%) | 0 (0.0%) |
| 18 to 34 Years | 0 (0.0%) | 0 (0.0%) |
| 35 to 64 Years | 0 (0.0%) | 0 (0.0%) |
| 65 to 74 Years | 0 (0.0%) | 0 (0.0%) |
| 75 Years and over | 0 (0.0%) | 0 (0.0%) |
Technology Access in Binghamton University
Computing Device Access in Binghamton University
| Device Type | # Households | % Households |
| Desktop or Laptop | 0 | 0.0% |
| Smartphone | 0 | 0.0% |
| Tablet | 0 | 0.0% |
| No Computing Device | 0 | 0.0% |
| Total | 0 | 0.0% |
Internet Access in Binghamton University
| Internet Type | # Households | % Households |
| Dial-Up Internet | 0 | 0.0% |
| Broadband Home | 0 | 0.0% |
| Cellular Data Only | 0 | 0.0% |
| Satellite Internet | 0 | 0.0% |
| No Internet | 0 | 0.0% |
| Total | 0 | 0.0% |
Binghamton University Summary
Binghamton University, located in Binghamton, New York, is a public research university and part of the State University of New York (SUNY) system. Founded in 1946, the university has grown to become one of the largest universities in the state, with an enrollment of over 17,000 students. Binghamton University is known for its strong academic programs, particularly in the sciences, and its commitment to research and innovation.
History
Binghamton University was founded in 1946 as Triple Cities College, a private, non-sectarian institution. The college was established to serve the educational needs of the local community, which was then composed of the cities of Binghamton, Endicott, and Johnson City. In 1950, the college was renamed Harpur College, in honor of Robert Harpur, an early settler of the area. In 1965, the college became part of the State University of New York (SUNY) system and was renamed the State University of New York at Binghamton. In 1967, the university was officially designated a doctoral-granting institution.
Geography
Binghamton University is located in the city of Binghamton, New York, in the Southern Tier region of the state. The city is situated on the Susquehanna River, near the Pennsylvania border. Binghamton is approximately two hours from both New York City and Buffalo, and is within a day’s drive of several major cities, including Toronto, Philadelphia, and Washington, D.C.
The university campus is located on a hill overlooking the city of Binghamton. The campus is composed of over 200 acres of land, and includes several academic buildings, residence halls, and recreational facilities.
Economy
Binghamton University is a major economic driver in the region. The university has an annual economic impact of over $1 billion, and is the largest employer in the city of Binghamton. The university also serves as a hub for research and innovation, and is home to several research centers and institutes, including the Center for Advanced Microelectronics and the Institute for Advanced Manufacturing.
Demographics
As of 2020, Binghamton University had an enrollment of over 17,000 students. The student body is diverse, with students from all 50 states and over 100 countries. The university is also home to a large international student population, with over 1,000 international students enrolled.
The university faculty is also diverse, with over 1,000 faculty members from around the world. The faculty is composed of scholars from a variety of disciplines, including the sciences, humanities, and social sciences.
Conclusion
Binghamton University is a public research university located in Binghamton, New York. Founded in 1946, the university has grown to become one of the largest universities in the state, with an enrollment of over 17,000 students. Binghamton University is known for its strong academic programs, particularly in the sciences, and its commitment to research and innovation. The university is a major economic driver in the region, with an annual economic impact of over $1 billion, and is home to a diverse student and faculty population.
Common Questions
What is Per Capita Income in Binghamton University?
Per Capita income in Binghamton University is $2,714.
What is Income or Wage Gap in Binghamton University?
Income or Wage Gap in Binghamton University is 18.9%.
Women in Binghamton University earn 81.1 cents for every dollar earned by a man.
What is the Total Population of Binghamton University?
Total Population of Binghamton University is 6,405.
What is the Total Male Population of Binghamton University?
Total Male Population of Binghamton University is 3,052.
What is the Total Female Population of Binghamton University?
Total Female Population of Binghamton University is 3,353.
What is the Ratio of Males per 100 Females in Binghamton University?
There are 91.02 Males per 100 Females in Binghamton University.
What is the Ratio of Females per 100 Males in Binghamton University?
There are 109.86 Females per 100 Males in Binghamton University.
What is the Median Population Age in Binghamton University?
Median Population Age in Binghamton University is 19.4 Years.
How Large is the Labor Force in Binghamton University?
There are 1,646 People in the Labor Forcein in Binghamton University.
What is the Percentage of People in the Labor Force in Binghamton University?
25.7% of People are in the Labor Force in Binghamton University.
What is the Unemployment Rate in Binghamton University?
Unemployment Rate in Binghamton University is 25.3%.