Cities with the Largest Romanian Community in New York
RELATED REPORTS & OPTIONS
Romanian
New York
Compare Cities
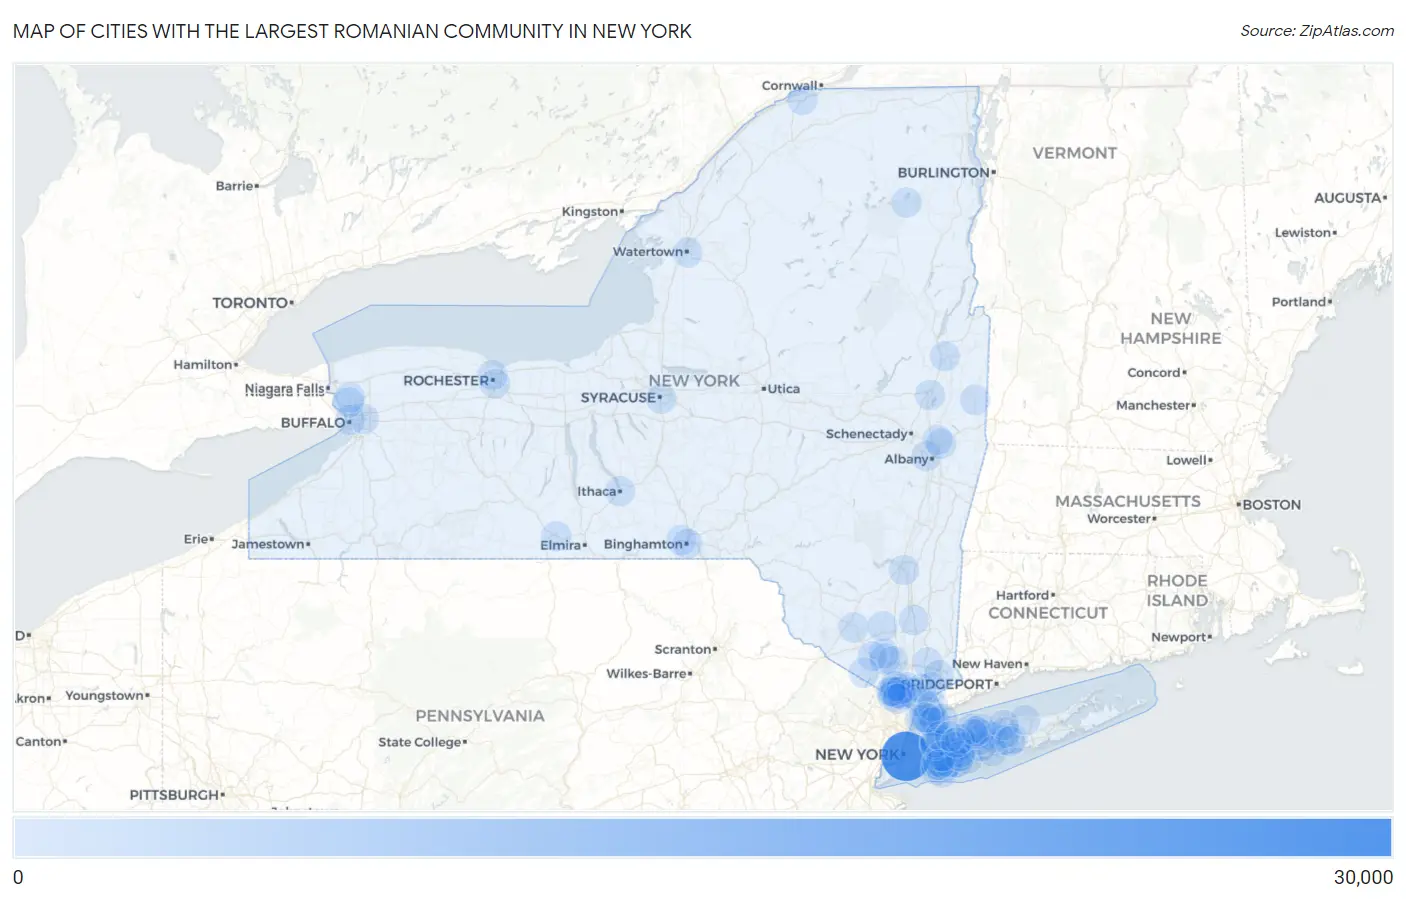
Map of Cities with the Largest Romanian Community in New York
0
30,000
Cities with the Largest Romanian Community in New York
| City | Romanian | vs State | vs National | |
| 1. | New York | 28,008 | 52,315(53.54%)#1 | 458,947(6.10%)#1 |
| 2. | Kiryas Joel | 1,203 | 52,315(2.30%)#2 | 458,947(0.26%)#23 |
| 3. | Monsey | 929 | 52,315(1.78%)#3 | 458,947(0.20%)#34 |
| 4. | Kaser | 636 | 52,315(1.22%)#4 | 458,947(0.14%)#67 |
| 5. | Yonkers | 469 | 52,315(0.90%)#5 | 458,947(0.10%)#102 |
| 6. | Spring Valley | 463 | 52,315(0.89%)#6 | 458,947(0.10%)#105 |
| 7. | New Rochelle | 359 | 52,315(0.69%)#7 | 458,947(0.08%)#154 |
| 8. | New City | 316 | 52,315(0.60%)#8 | 458,947(0.07%)#189 |
| 9. | Viola | 296 | 52,315(0.57%)#9 | 458,947(0.06%)#208 |
| 10. | Scarsdale | 266 | 52,315(0.51%)#10 | 458,947(0.06%)#242 |
| 11. | South Blooming Grove | 264 | 52,315(0.50%)#11 | 458,947(0.06%)#246 |
| 12. | Plainview | 253 | 52,315(0.48%)#12 | 458,947(0.06%)#256 |
| 13. | Buffalo | 251 | 52,315(0.48%)#13 | 458,947(0.05%)#258 |
| 14. | Cheektowaga | 227 | 52,315(0.43%)#14 | 458,947(0.05%)#292 |
| 15. | Bloomingburg | 223 | 52,315(0.43%)#15 | 458,947(0.05%)#300 |
| 16. | Tarrytown | 213 | 52,315(0.41%)#16 | 458,947(0.05%)#321 |
| 17. | Kingston | 208 | 52,315(0.40%)#17 | 458,947(0.05%)#331 |
| 18. | Valley Cottage | 206 | 52,315(0.39%)#18 | 458,947(0.04%)#335 |
| 19. | Commack | 203 | 52,315(0.39%)#19 | 458,947(0.04%)#340 |
| 20. | Great Neck | 195 | 52,315(0.37%)#20 | 458,947(0.04%)#348 |
| 21. | Ithaca | 193 | 52,315(0.37%)#21 | 458,947(0.04%)#352 |
| 22. | Merrick | 183 | 52,315(0.35%)#22 | 458,947(0.04%)#375 |
| 23. | Lawrence | 183 | 52,315(0.35%)#23 | 458,947(0.04%)#377 |
| 24. | East Meadow | 181 | 52,315(0.35%)#24 | 458,947(0.04%)#379 |
| 25. | Wesley Hills | 177 | 52,315(0.34%)#25 | 458,947(0.04%)#393 |
| 26. | Oceanside | 165 | 52,315(0.32%)#26 | 458,947(0.04%)#417 |
| 27. | Syracuse | 164 | 52,315(0.31%)#27 | 458,947(0.04%)#420 |
| 28. | Jefferson Valley Yorktown | 159 | 52,315(0.30%)#28 | 458,947(0.03%)#438 |
| 29. | Cambridge | 156 | 52,315(0.30%)#29 | 458,947(0.03%)#450 |
| 30. | Corning | 147 | 52,315(0.28%)#30 | 458,947(0.03%)#492 |
| 31. | Tuckahoe | 139 | 52,315(0.27%)#31 | 458,947(0.03%)#516 |
| 32. | Airmont | 138 | 52,315(0.26%)#32 | 458,947(0.03%)#521 |
| 33. | New Square | 137 | 52,315(0.26%)#33 | 458,947(0.03%)#525 |
| 34. | Rochester | 134 | 52,315(0.26%)#34 | 458,947(0.03%)#533 |
| 35. | Valley Stream | 133 | 52,315(0.25%)#35 | 458,947(0.03%)#538 |
| 36. | Tonawanda | 132 | 52,315(0.25%)#36 | 458,947(0.03%)#546 |
| 37. | Hicksville | 131 | 52,315(0.25%)#37 | 458,947(0.03%)#553 |
| 38. | Old Bethpage | 131 | 52,315(0.25%)#38 | 458,947(0.03%)#554 |
| 39. | Long Beach | 129 | 52,315(0.25%)#39 | 458,947(0.03%)#558 |
| 40. | Bellmore | 129 | 52,315(0.25%)#40 | 458,947(0.03%)#559 |
| 41. | East Massapequa | 126 | 52,315(0.24%)#41 | 458,947(0.03%)#570 |
| 42. | Levittown | 123 | 52,315(0.24%)#42 | 458,947(0.03%)#582 |
| 43. | Woodmere | 119 | 52,315(0.23%)#43 | 458,947(0.03%)#613 |
| 44. | Woodbury | 117 | 52,315(0.22%)#44 | 458,947(0.03%)#630 |
| 45. | Nanuet | 116 | 52,315(0.22%)#45 | 458,947(0.03%)#631 |
| 46. | Larchmont | 116 | 52,315(0.22%)#46 | 458,947(0.03%)#632 |
| 47. | Lynbrook | 115 | 52,315(0.22%)#47 | 458,947(0.03%)#637 |
| 48. | Chester | 111 | 52,315(0.21%)#48 | 458,947(0.02%)#668 |
| 49. | West Hempstead | 110 | 52,315(0.21%)#49 | 458,947(0.02%)#675 |
| 50. | Dix Hills | 108 | 52,315(0.21%)#50 | 458,947(0.02%)#692 |
| 51. | Chappaqua | 106 | 52,315(0.20%)#51 | 458,947(0.02%)#710 |
| 52. | East Hills | 103 | 52,315(0.20%)#52 | 458,947(0.02%)#735 |
| 53. | Mamaroneck | 102 | 52,315(0.19%)#53 | 458,947(0.02%)#737 |
| 54. | Ronkonkoma | 98 | 52,315(0.19%)#54 | 458,947(0.02%)#767 |
| 55. | Elwood | 95 | 52,315(0.18%)#55 | 458,947(0.02%)#787 |
| 56. | Flower Hill | 95 | 52,315(0.18%)#56 | 458,947(0.02%)#789 |
| 57. | Baldwin | 94 | 52,315(0.18%)#57 | 458,947(0.02%)#796 |
| 58. | Watertown | 94 | 52,315(0.18%)#58 | 458,947(0.02%)#797 |
| 59. | Albany | 93 | 52,315(0.18%)#59 | 458,947(0.02%)#801 |
| 60. | White Plains | 93 | 52,315(0.18%)#60 | 458,947(0.02%)#803 |
| 61. | Great Neck Plaza | 92 | 52,315(0.18%)#61 | 458,947(0.02%)#816 |
| 62. | University Gardens | 92 | 52,315(0.18%)#62 | 458,947(0.02%)#817 |
| 63. | Franklin Square | 91 | 52,315(0.17%)#63 | 458,947(0.02%)#819 |
| 64. | Hauppauge | 91 | 52,315(0.17%)#64 | 458,947(0.02%)#820 |
| 65. | Deer Park | 89 | 52,315(0.17%)#65 | 458,947(0.02%)#839 |
| 66. | Johnson City | 87 | 52,315(0.17%)#66 | 458,947(0.02%)#860 |
| 67. | Port Washington | 82 | 52,315(0.16%)#67 | 458,947(0.02%)#920 |
| 68. | Briarcliff Manor | 82 | 52,315(0.16%)#68 | 458,947(0.02%)#923 |
| 69. | Massena | 79 | 52,315(0.15%)#69 | 458,947(0.02%)#961 |
| 70. | North Tonawanda | 78 | 52,315(0.15%)#70 | 458,947(0.02%)#967 |
| 71. | Huntington | 77 | 52,315(0.15%)#71 | 458,947(0.02%)#981 |
| 72. | Rye | 76 | 52,315(0.15%)#72 | 458,947(0.02%)#994 |
| 73. | Holtsville | 75 | 52,315(0.14%)#73 | 458,947(0.02%)#1,002 |
| 74. | North Wantagh | 75 | 52,315(0.14%)#74 | 458,947(0.02%)#1,004 |
| 75. | Wappingers Falls | 75 | 52,315(0.14%)#75 | 458,947(0.02%)#1,006 |
| 76. | East Northport | 74 | 52,315(0.14%)#76 | 458,947(0.02%)#1,011 |
| 77. | Troy | 73 | 52,315(0.14%)#77 | 458,947(0.02%)#1,019 |
| 78. | Binghamton | 71 | 52,315(0.14%)#78 | 458,947(0.02%)#1,040 |
| 79. | Lake Grove | 71 | 52,315(0.14%)#79 | 458,947(0.02%)#1,050 |
| 80. | Huntington Station | 69 | 52,315(0.13%)#80 | 458,947(0.02%)#1,067 |
| 81. | Walden | 68 | 52,315(0.13%)#81 | 458,947(0.01%)#1,087 |
| 82. | Montebello | 68 | 52,315(0.13%)#82 | 458,947(0.01%)#1,089 |
| 83. | Syosset | 67 | 52,315(0.13%)#83 | 458,947(0.01%)#1,097 |
| 84. | Stony Brook | 67 | 52,315(0.13%)#84 | 458,947(0.01%)#1,100 |
| 85. | Warwick | 66 | 52,315(0.13%)#85 | 458,947(0.01%)#1,119 |
| 86. | Brighton | 65 | 52,315(0.12%)#86 | 458,947(0.01%)#1,131 |
| 87. | Eastchester | 65 | 52,315(0.12%)#87 | 458,947(0.01%)#1,132 |
| 88. | Islip | 65 | 52,315(0.12%)#88 | 458,947(0.01%)#1,134 |
| 89. | Chestnut Ridge | 64 | 52,315(0.12%)#89 | 458,947(0.01%)#1,144 |
| 90. | Lake Placid | 64 | 52,315(0.12%)#90 | 458,947(0.01%)#1,146 |
| 91. | Old Brookville | 63 | 52,315(0.12%)#91 | 458,947(0.01%)#1,159 |
| 92. | Glens Falls | 62 | 52,315(0.12%)#92 | 458,947(0.01%)#1,169 |
| 93. | Holbrook | 61 | 52,315(0.12%)#93 | 458,947(0.01%)#1,181 |
| 94. | Greenlawn | 61 | 52,315(0.12%)#94 | 458,947(0.01%)#1,183 |
| 95. | Hewlett | 61 | 52,315(0.12%)#95 | 458,947(0.01%)#1,186 |
| 96. | Cohoes | 60 | 52,315(0.11%)#96 | 458,947(0.01%)#1,206 |
| 97. | Saratoga Springs | 59 | 52,315(0.11%)#97 | 458,947(0.01%)#1,219 |
| 98. | Rocky Point | 59 | 52,315(0.11%)#98 | 458,947(0.01%)#1,228 |
| 99. | Bedford Hills | 59 | 52,315(0.11%)#99 | 458,947(0.01%)#1,236 |
| 100. | Jericho | 58 | 52,315(0.11%)#100 | 458,947(0.01%)#1,245 |
Common Questions
What are the Top 10 Cities with the Largest Romanian Community in New York?
Top 10 Cities with the Largest Romanian Community in New York are:
#1
28,008
#2
1,203
#3
929
#4
636
#5
469
#6
463
#7
359
#8
316
#9
296
#10
266
What city has the Largest Romanian Community in New York?
New York has the Largest Romanian Community in New York with 28,008.
What is the Total Romanian Population in the State of New York?
Total Romanian Population in New York is 52,315.
What is the Total Romanian Population in the United States?
Total Romanian Population in the United States is 458,947.