Phoenicia, NY Map & Demographics
Phoenicia Map
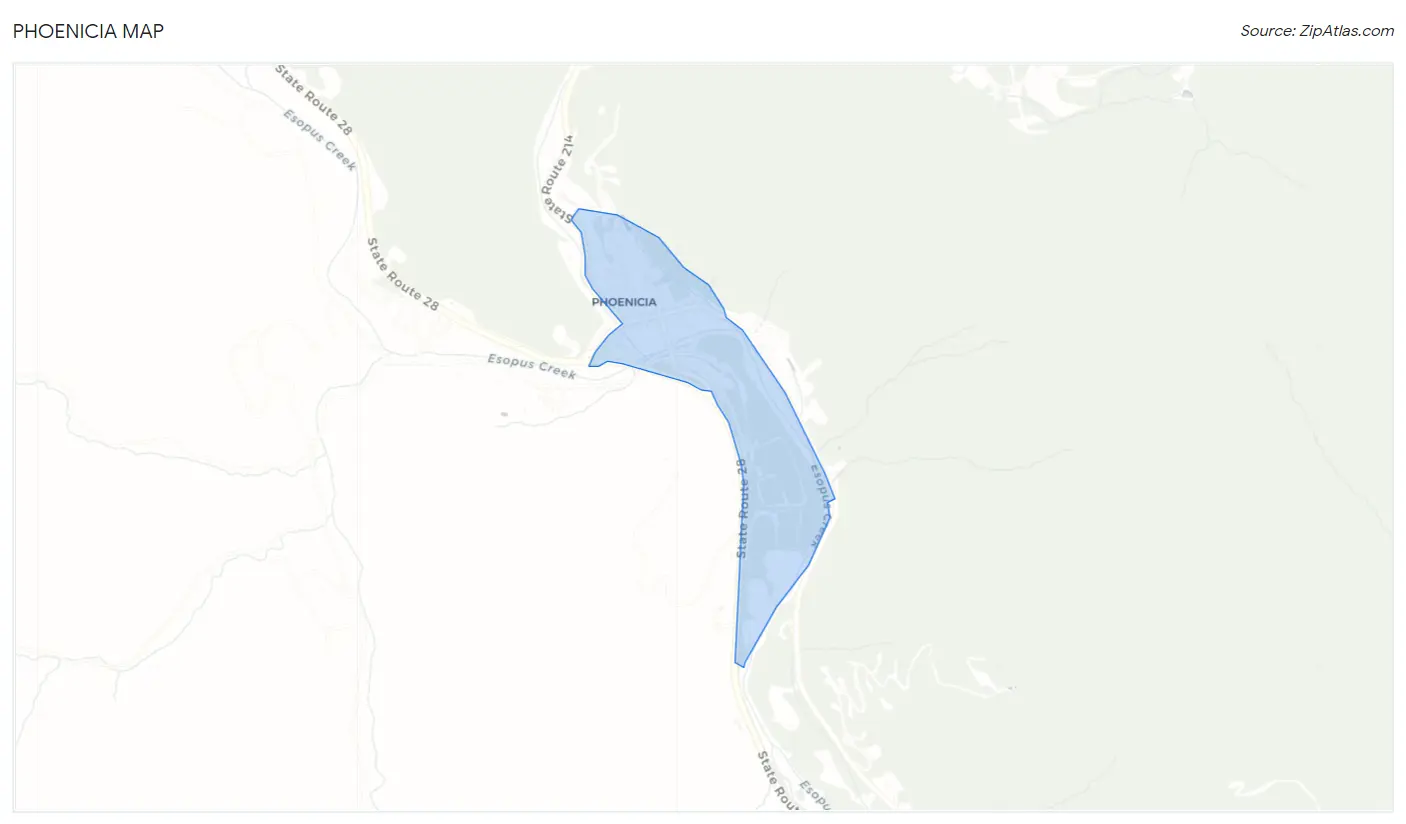
Phoenicia Overview
$26,906
PER CAPITA INCOME
0.53
INEQUALITY / GINI INDEX
266
TOTAL POPULATION
167
MALE POPULATION
99
FEMALE POPULATION
168.69
MALES / 100 FEMALES
59.28
FEMALES / 100 MALES
54.8
MEDIAN AGE
2.2
AVG FAMILY SIZE
1.9
AVG HOUSEHOLD SIZE
142
LABOR FORCE [ PEOPLE ]
53.4%
PERCENT IN LABOR FORCE
Phoenicia Zip Codes
Phoenicia Area Codes
Income in Phoenicia
Income Overview in Phoenicia
| Characteristic | Number | Measure |
| Per Capita Income | 266 | $26,906 |
| Median Family Income | 100 | $0 |
| Mean Family Income | 100 | $36,205 |
| Median Household Income | 144 | $0 |
| Mean Household Income | 144 | $48,952 |
| Income Deficit | 100 | $0 |
| Wage / Income Gap (%) | 266 | 0.00% |
| Wage / Income Gap ($) | 266 | 100.00¢ per $1 |
| Gini / Inequality Index | 266 | 0.53 |
Earnings by Sex in Phoenicia
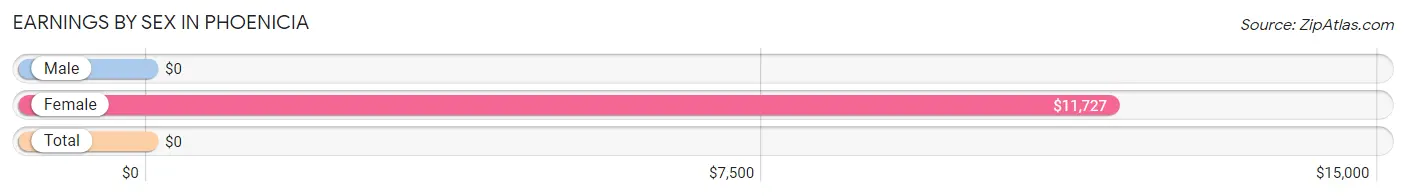
| Sex | Number | Average Earnings |
| Male | 60 (42.2%) | $0 |
| Female | 82 (57.8%) | $11,727 |
| Total | 142 (100.0%) | $0 |
Earnings by Sex by Income Bracket in Phoenicia
The most common earnings brackets in Phoenicia are $100,000+ for men (23 | 38.3%) and $10,000 to $12,499 for women (55 | 67.1%).
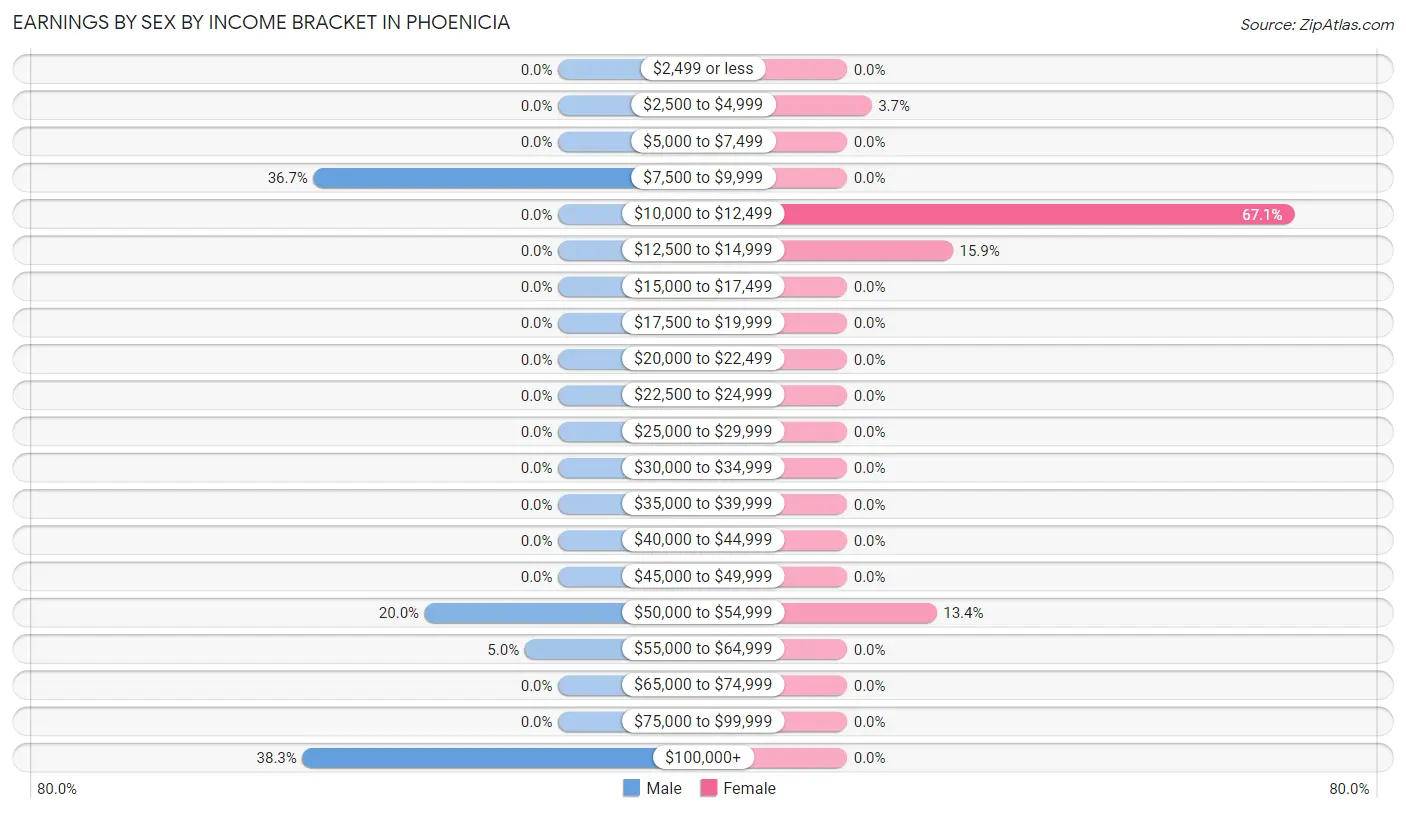
| Income | Male | Female |
| $2,499 or less | 0 (0.0%) | 0 (0.0%) |
| $2,500 to $4,999 | 0 (0.0%) | 3 (3.7%) |
| $5,000 to $7,499 | 0 (0.0%) | 0 (0.0%) |
| $7,500 to $9,999 | 22 (36.7%) | 0 (0.0%) |
| $10,000 to $12,499 | 0 (0.0%) | 55 (67.1%) |
| $12,500 to $14,999 | 0 (0.0%) | 13 (15.9%) |
| $15,000 to $17,499 | 0 (0.0%) | 0 (0.0%) |
| $17,500 to $19,999 | 0 (0.0%) | 0 (0.0%) |
| $20,000 to $22,499 | 0 (0.0%) | 0 (0.0%) |
| $22,500 to $24,999 | 0 (0.0%) | 0 (0.0%) |
| $25,000 to $29,999 | 0 (0.0%) | 0 (0.0%) |
| $30,000 to $34,999 | 0 (0.0%) | 0 (0.0%) |
| $35,000 to $39,999 | 0 (0.0%) | 0 (0.0%) |
| $40,000 to $44,999 | 0 (0.0%) | 0 (0.0%) |
| $45,000 to $49,999 | 0 (0.0%) | 0 (0.0%) |
| $50,000 to $54,999 | 12 (20.0%) | 11 (13.4%) |
| $55,000 to $64,999 | 3 (5.0%) | 0 (0.0%) |
| $65,000 to $74,999 | 0 (0.0%) | 0 (0.0%) |
| $75,000 to $99,999 | 0 (0.0%) | 0 (0.0%) |
| $100,000+ | 23 (38.3%) | 0 (0.0%) |
| Total | 60 (100.0%) | 82 (100.0%) |
Earnings by Sex by Educational Attainment in Phoenicia
| Educational Attainment | Male Income | Female Income |
| Less than High School | - | - |
| High School Diploma | - | - |
| College or Associate's Degree | - | - |
| Bachelor's Degree | - | - |
| Graduate Degree | - | - |
| Total | - | - |
Family Income in Phoenicia
Family Income Brackets in Phoenicia
According to the Phoenicia family income data, there are 65 families falling into the $10,000 to $14,999 income range, which is the most common income bracket and makes up 65.0% of all families.
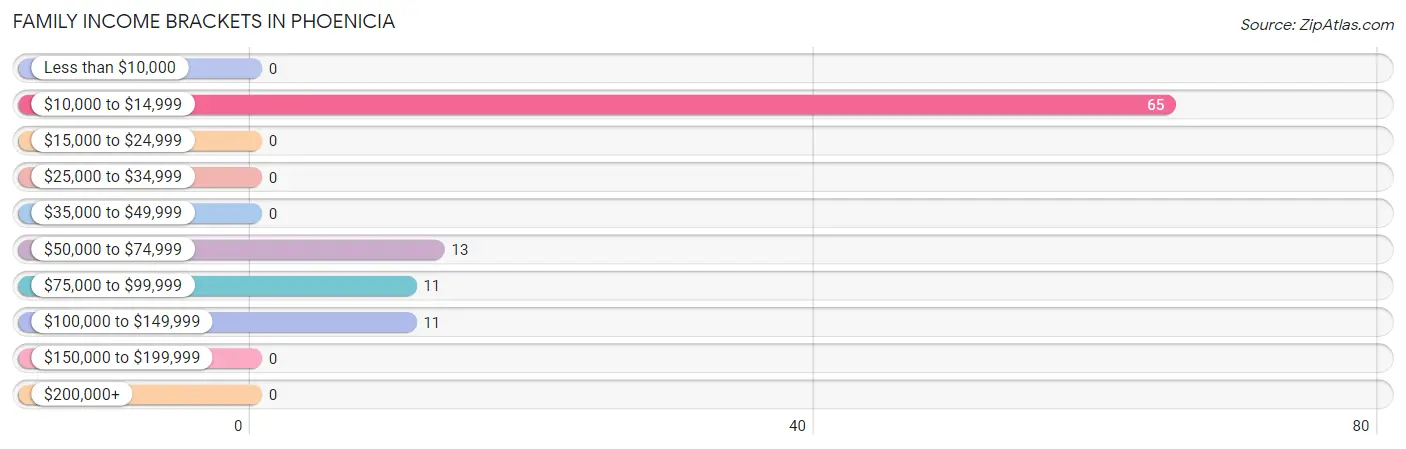
| Income Bracket | # Families | % Families |
| Less than $10,000 | 0 | 0.0% |
| $10,000 to $14,999 | 65 | 65.0% |
| $15,000 to $24,999 | 0 | 0.0% |
| $25,000 to $34,999 | 0 | 0.0% |
| $35,000 to $49,999 | 0 | 0.0% |
| $50,000 to $74,999 | 13 | 13.0% |
| $75,000 to $99,999 | 11 | 11.0% |
| $100,000 to $149,999 | 11 | 11.0% |
| $150,000 to $199,999 | 0 | 0.0% |
| $200,000+ | 0 | 0.0% |
Family Income by Famaliy Size in Phoenicia
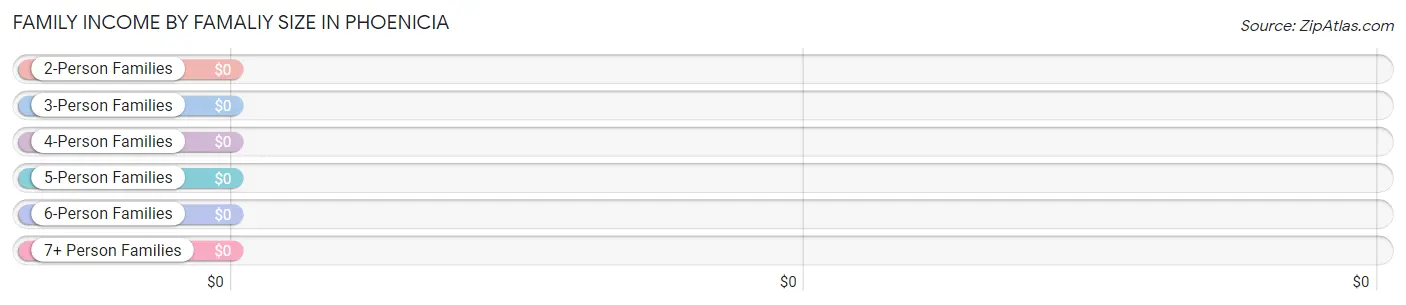
| Income Bracket | # Families | Median Income |
| 2-Person Families | 89 (89.0%) | $0 |
| 3-Person Families | 11 (11.0%) | $0 |
| 4-Person Families | 0 (0.0%) | $0 |
| 5-Person Families | 0 (0.0%) | $0 |
| 6-Person Families | 0 (0.0%) | $0 |
| 7+ Person Families | 0 (0.0%) | $0 |
| Total | 100 (100.0%) | $0 |
Family Income by Number of Earners in Phoenicia
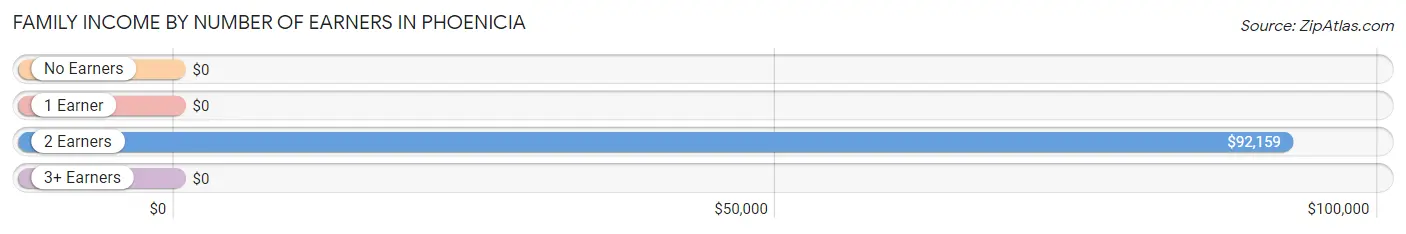
| Number of Earners | # Families | Median Income |
| No Earners | 10 (10.0%) | $0 |
| 1 Earner | 65 (65.0%) | $0 |
| 2 Earners | 25 (25.0%) | $92,159 |
| 3+ Earners | 0 (0.0%) | $0 |
| Total | 100 (100.0%) | $0 |
Household Income in Phoenicia
Household Income Brackets in Phoenicia
With 65 households falling in the category, the $10,000 to $14,999 income range is the most frequent in Phoenicia, accounting for 45.1% of all households.
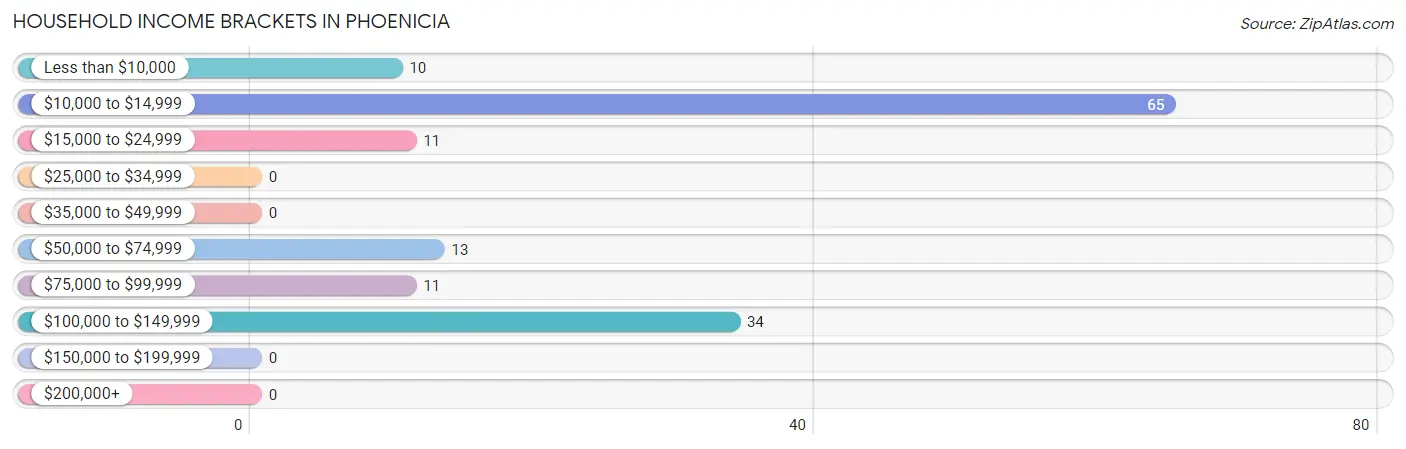
| Income Bracket | # Households | % Households |
| Less than $10,000 | 10 | 6.9% |
| $10,000 to $14,999 | 65 | 45.1% |
| $15,000 to $24,999 | 11 | 7.6% |
| $25,000 to $34,999 | 0 | 0.0% |
| $35,000 to $49,999 | 0 | 0.0% |
| $50,000 to $74,999 | 13 | 9.0% |
| $75,000 to $99,999 | 11 | 7.6% |
| $100,000 to $149,999 | 34 | 23.6% |
| $150,000 to $199,999 | 0 | 0.0% |
| $200,000+ | 0 | 0.0% |
Household Income by Householder Age in Phoenicia
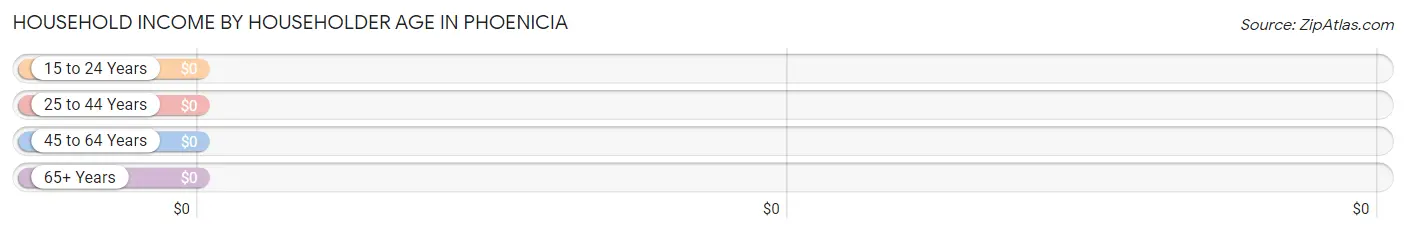
| Income Bracket | # Households | Median Income |
| 15 to 24 Years | 0 (0.0%) | $0 |
| 25 to 44 Years | 0 (0.0%) | $0 |
| 45 to 64 Years | 123 (85.4%) | $0 |
| 65+ Years | 21 (14.6%) | $0 |
| Total | 144 (100.0%) | $0 |
Poverty in Phoenicia
Income Below Poverty by Sex and Age in Phoenicia
With 44.9% poverty level for males and 55.6% for females among the residents of Phoenicia, 45 to 54 year old males and 45 to 54 year old females are the most vulnerable to poverty, with 65 males (100.0%) and 55 females (100.0%) in their respective age groups living below the poverty level.
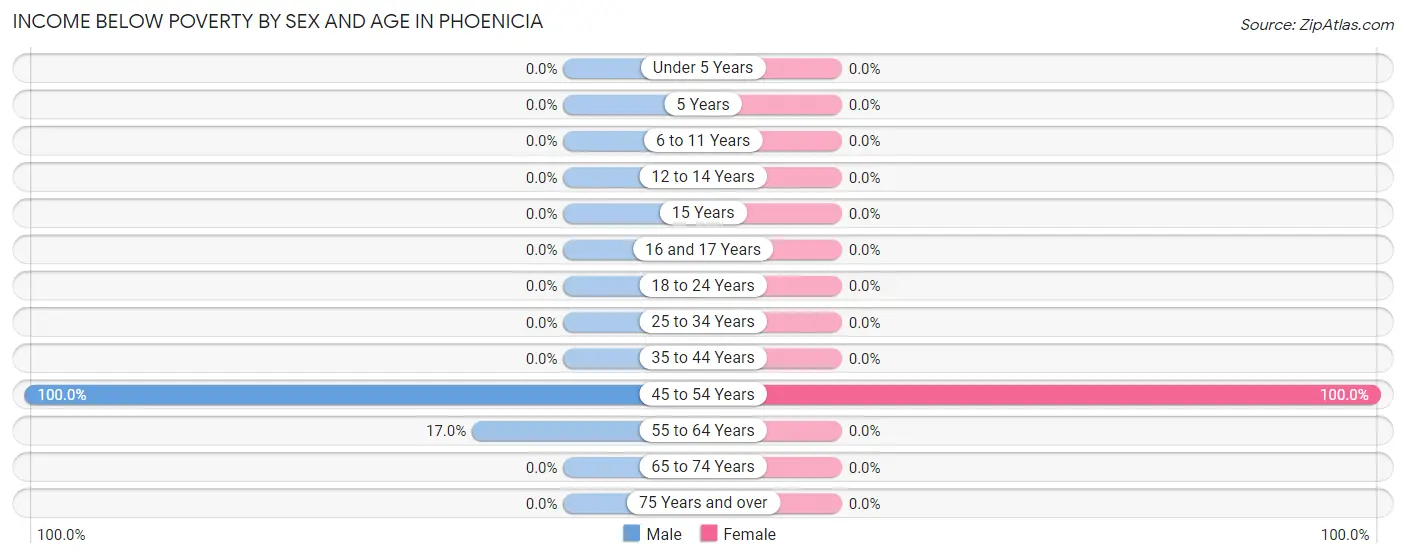
| Age Bracket | Male | Female |
| Under 5 Years | 0 (0.0%) | 0 (0.0%) |
| 5 Years | 0 (0.0%) | 0 (0.0%) |
| 6 to 11 Years | 0 (0.0%) | 0 (0.0%) |
| 12 to 14 Years | 0 (0.0%) | 0 (0.0%) |
| 15 Years | 0 (0.0%) | 0 (0.0%) |
| 16 and 17 Years | 0 (0.0%) | 0 (0.0%) |
| 18 to 24 Years | 0 (0.0%) | 0 (0.0%) |
| 25 to 34 Years | 0 (0.0%) | 0 (0.0%) |
| 35 to 44 Years | 0 (0.0%) | 0 (0.0%) |
| 45 to 54 Years | 65 (100.0%) | 55 (100.0%) |
| 55 to 64 Years | 10 (17.0%) | 0 (0.0%) |
| 65 to 74 Years | 0 (0.0%) | 0 (0.0%) |
| 75 Years and over | 0 (0.0%) | 0 (0.0%) |
| Total | 75 (44.9%) | 55 (55.6%) |
Income Above Poverty by Sex and Age in Phoenicia
According to the poverty statistics in Phoenicia, males aged 18 to 24 years and females aged 55 to 64 years are the age groups that are most secure financially, with 100.0% of males and 100.0% of females in these age groups living above the poverty line.
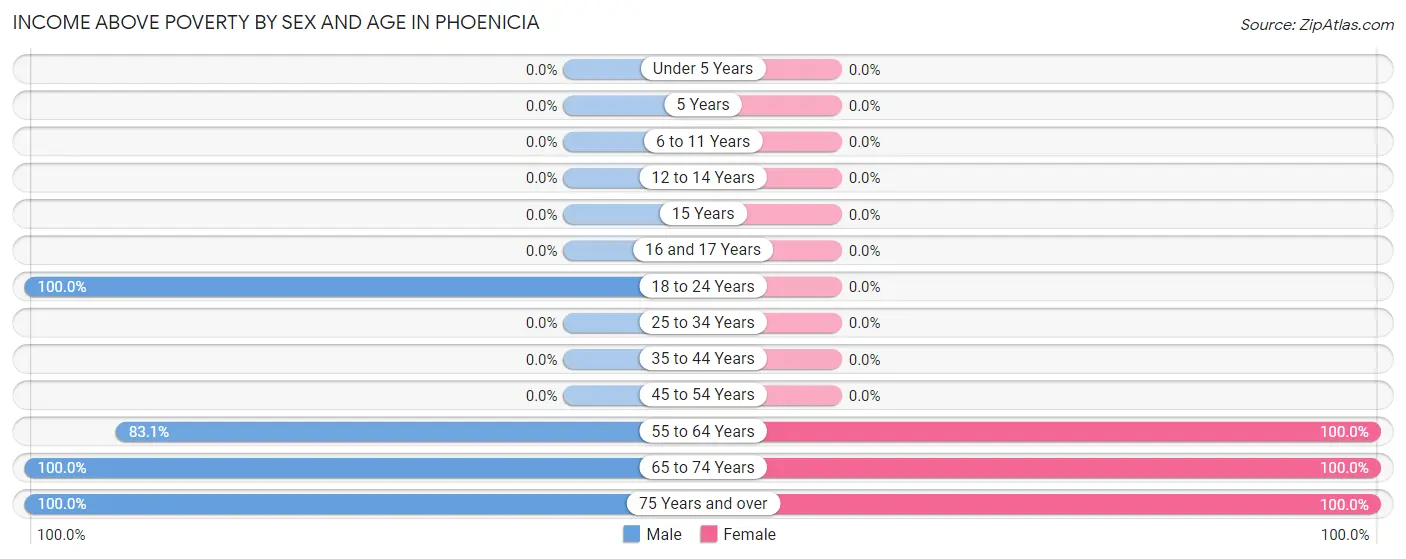
| Age Bracket | Male | Female |
| Under 5 Years | 0 (0.0%) | 0 (0.0%) |
| 5 Years | 0 (0.0%) | 0 (0.0%) |
| 6 to 11 Years | 0 (0.0%) | 0 (0.0%) |
| 12 to 14 Years | 0 (0.0%) | 0 (0.0%) |
| 15 Years | 0 (0.0%) | 0 (0.0%) |
| 16 and 17 Years | 0 (0.0%) | 0 (0.0%) |
| 18 to 24 Years | 22 (100.0%) | 0 (0.0%) |
| 25 to 34 Years | 0 (0.0%) | 0 (0.0%) |
| 35 to 44 Years | 0 (0.0%) | 0 (0.0%) |
| 45 to 54 Years | 0 (0.0%) | 0 (0.0%) |
| 55 to 64 Years | 49 (83.1%) | 14 (100.0%) |
| 65 to 74 Years | 11 (100.0%) | 13 (100.0%) |
| 75 Years and over | 10 (100.0%) | 17 (100.0%) |
| Total | 92 (55.1%) | 44 (44.4%) |
Income Below Poverty Among Married-Couple Families in Phoenicia
The poverty statistics for married-couple families in Phoenicia show that 65.0% or 65 of the total 100 families live below the poverty line. Families with no children have the highest poverty rate of 65.0%, comprising of 65 families. On the other hand, families with no children have the lowest poverty rate of 65.0%, which includes 65 families.
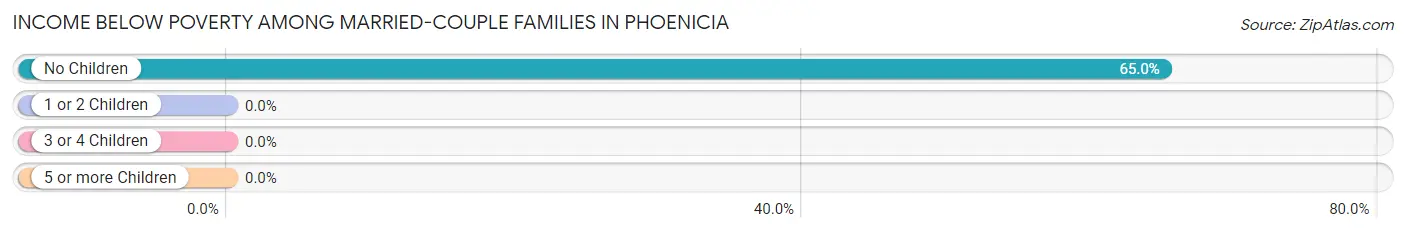
| Children | Above Poverty | Below Poverty |
| No Children | 35 (35.0%) | 65 (65.0%) |
| 1 or 2 Children | 0 (0.0%) | 0 (0.0%) |
| 3 or 4 Children | 0 (0.0%) | 0 (0.0%) |
| 5 or more Children | 0 (0.0%) | 0 (0.0%) |
| Total | 35 (35.0%) | 65 (65.0%) |
Income Below Poverty Among Single-Parent Households in Phoenicia
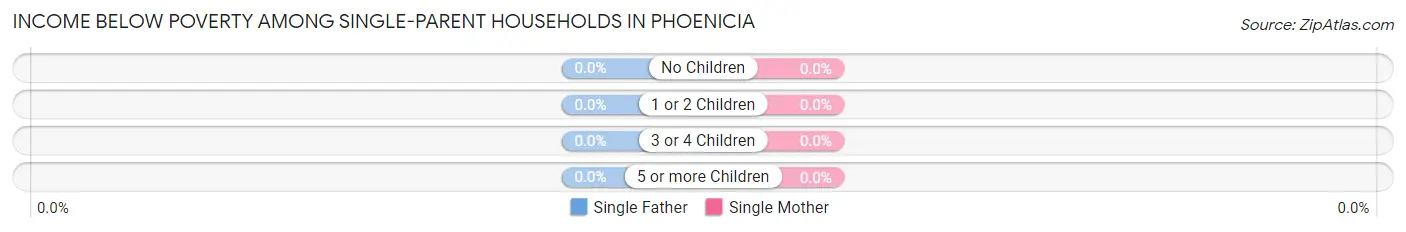
| Children | Single Father | Single Mother |
| No Children | 0 (0.0%) | 0 (0.0%) |
| 1 or 2 Children | 0 (0.0%) | 0 (0.0%) |
| 3 or 4 Children | 0 (0.0%) | 0 (0.0%) |
| 5 or more Children | 0 (0.0%) | 0 (0.0%) |
| Total | 0 (0.0%) | 0 (0.0%) |
Income Below Poverty Among Married-Couple vs Single-Parent Households in Phoenicia
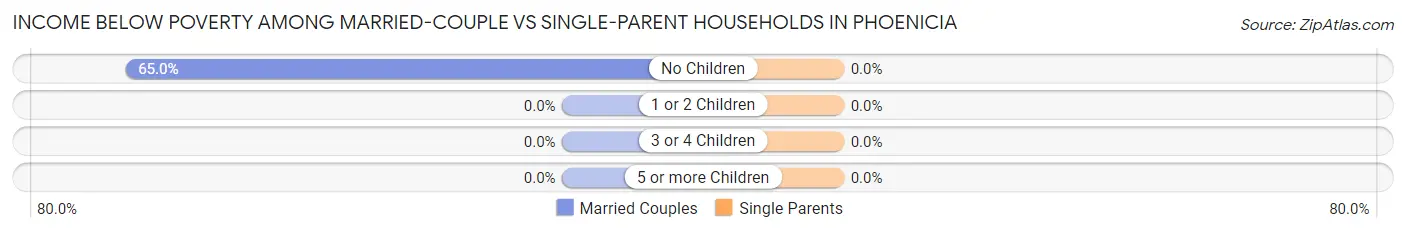
| Children | Married-Couple Families | Single-Parent Households |
| No Children | 65 (65.0%) | 0 (0.0%) |
| 1 or 2 Children | 0 (0.0%) | 0 (0.0%) |
| 3 or 4 Children | 0 (0.0%) | 0 (0.0%) |
| 5 or more Children | 0 (0.0%) | 0 (0.0%) |
| Total | 65 (65.0%) | 0 (0.0%) |
Race in Phoenicia
The most populous races in Phoenicia are White / Caucasian (146 | 54.9%), Two or more Races (120 | 45.1%), and Hispanic or Latino (65 | 24.4%).
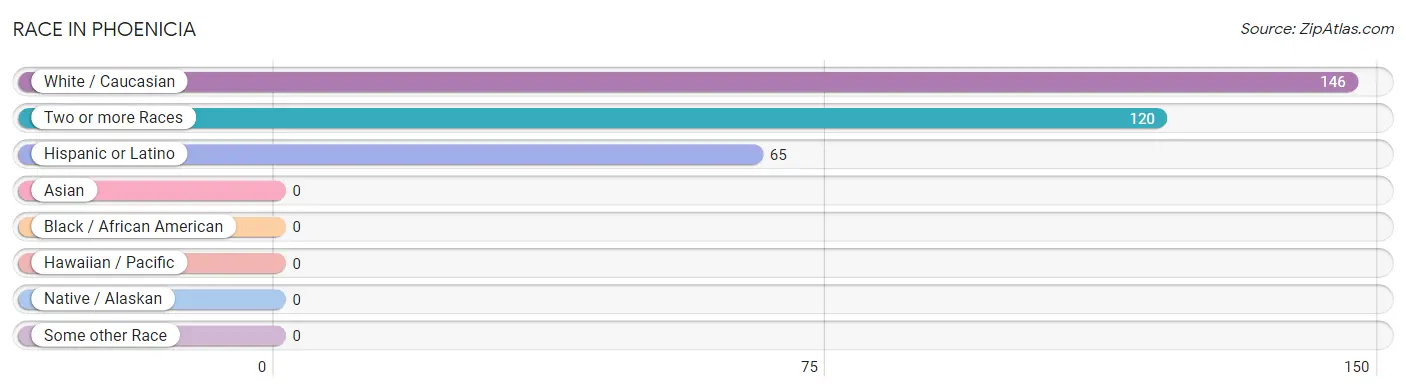
| Race | # Population | % Population |
| Asian | 0 | 0.0% |
| Black / African American | 0 | 0.0% |
| Hawaiian / Pacific | 0 | 0.0% |
| Hispanic or Latino | 65 | 24.4% |
| Native / Alaskan | 0 | 0.0% |
| White / Caucasian | 146 | 54.9% |
| Two or more Races | 120 | 45.1% |
| Some other Race | 0 | 0.0% |
| Total | 266 | 100.0% |
Ancestry in Phoenicia
The most populous ancestries reported in Phoenicia are Puerto Rican (65 | 24.4%), Italian (55 | 20.7%), English (44 | 16.5%), Swiss (23 | 8.6%), and Irish (22 | 8.3%), together accounting for 78.6% of all Phoenicia residents.
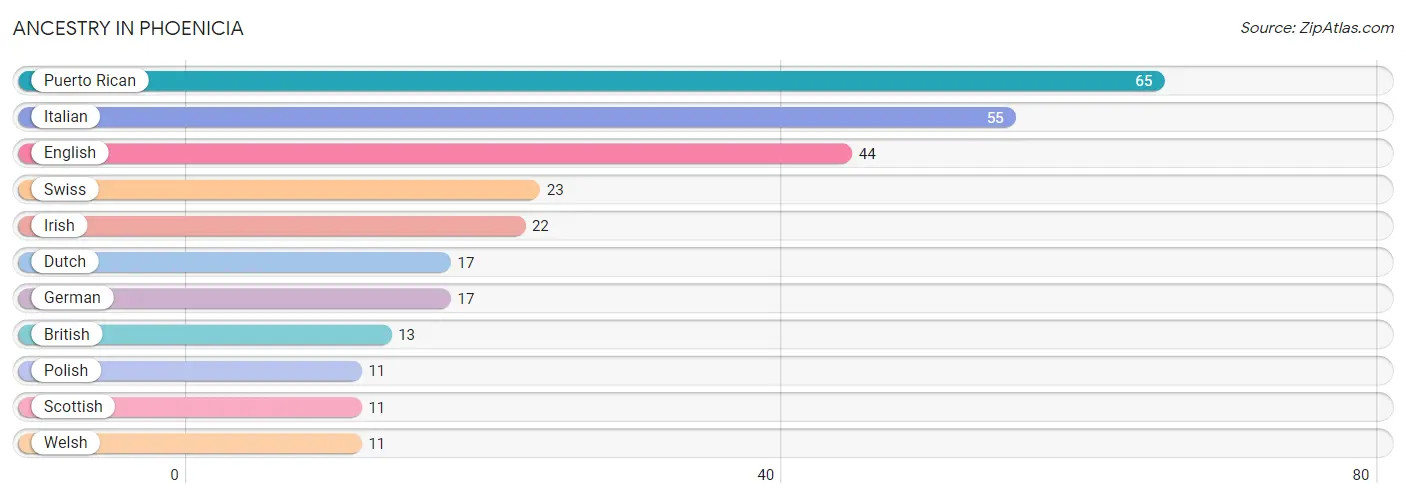
| Ancestry | # Population | % Population |
| British | 13 | 4.9% |
| Dutch | 17 | 6.4% |
| English | 44 | 16.5% |
| German | 17 | 6.4% |
| Irish | 22 | 8.3% |
| Italian | 55 | 20.7% |
| Polish | 11 | 4.1% |
| Puerto Rican | 65 | 24.4% |
| Scottish | 11 | 4.1% |
| Swiss | 23 | 8.6% |
| Welsh | 11 | 4.1% | View All 11 Rows |
Immigrants in Phoenicia

| Immigration Origin | # Population | % Population | View All 0 Rows |
Sex and Age in Phoenicia
Sex and Age in Phoenicia
The most populous age groups in Phoenicia are 50 to 54 Years (65 | 38.9%) for men and 50 to 54 Years (55 | 55.6%) for women.
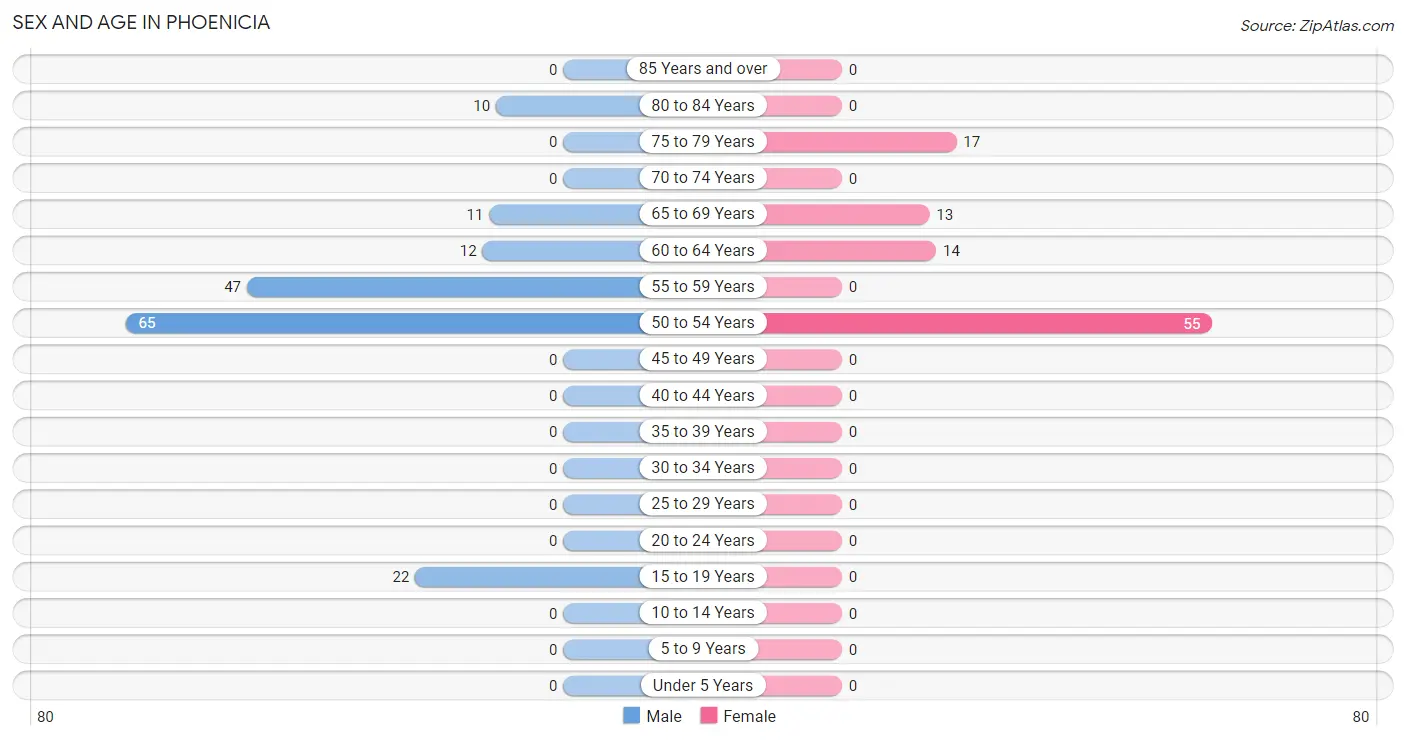
| Age Bracket | Male | Female |
| Under 5 Years | 0 (0.0%) | 0 (0.0%) |
| 5 to 9 Years | 0 (0.0%) | 0 (0.0%) |
| 10 to 14 Years | 0 (0.0%) | 0 (0.0%) |
| 15 to 19 Years | 22 (13.2%) | 0 (0.0%) |
| 20 to 24 Years | 0 (0.0%) | 0 (0.0%) |
| 25 to 29 Years | 0 (0.0%) | 0 (0.0%) |
| 30 to 34 Years | 0 (0.0%) | 0 (0.0%) |
| 35 to 39 Years | 0 (0.0%) | 0 (0.0%) |
| 40 to 44 Years | 0 (0.0%) | 0 (0.0%) |
| 45 to 49 Years | 0 (0.0%) | 0 (0.0%) |
| 50 to 54 Years | 65 (38.9%) | 55 (55.6%) |
| 55 to 59 Years | 47 (28.1%) | 0 (0.0%) |
| 60 to 64 Years | 12 (7.2%) | 14 (14.1%) |
| 65 to 69 Years | 11 (6.6%) | 13 (13.1%) |
| 70 to 74 Years | 0 (0.0%) | 0 (0.0%) |
| 75 to 79 Years | 0 (0.0%) | 17 (17.2%) |
| 80 to 84 Years | 10 (6.0%) | 0 (0.0%) |
| 85 Years and over | 0 (0.0%) | 0 (0.0%) |
| Total | 167 (100.0%) | 99 (100.0%) |
Families and Households in Phoenicia
Median Family Size in Phoenicia
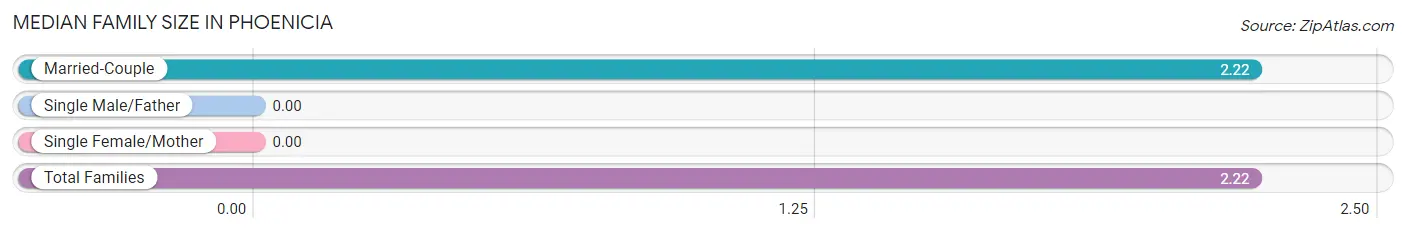
| Family Type | # Families | Family Size |
| Married-Couple | 100 (100.0%) | 2.22 |
| Single Male/Father | 0 (0.0%) | - |
| Single Female/Mother | 0 (0.0%) | - |
| Total Families | 100 (100.0%) | 2.22 |
Median Household Size in Phoenicia
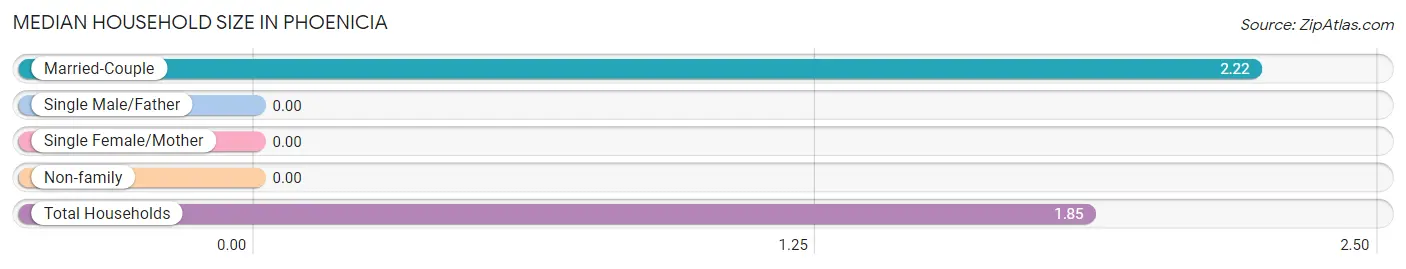
| Household Type | # Households | Household Size |
| Married-Couple | 100 (69.4%) | 2.22 |
| Single Male/Father | 0 (0.0%) | - |
| Single Female/Mother | 0 (0.0%) | - |
| Non-family | 44 (30.6%) | - |
| Total Households | 144 (100.0%) | 1.85 |
Household Size by Marriage Status in Phoenicia
Out of a total of 144 households in Phoenicia, 100 (69.4%) are family households, while 44 (30.6%) are nonfamily households. The most numerous type of family households are 2-person households, comprising 89, and the most common type of nonfamily households are 1-person households, comprising 44.
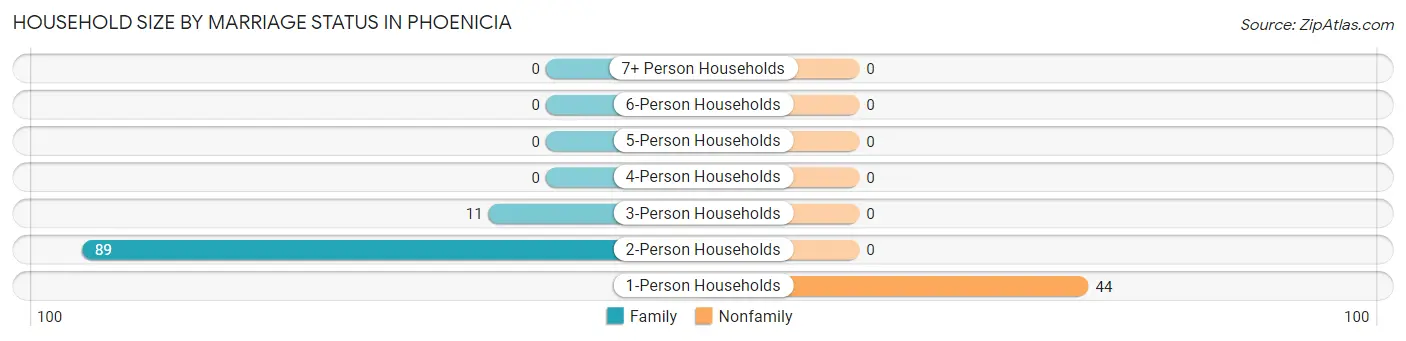
| Household Size | Family Households | Nonfamily Households |
| 1-Person Households | - | 44 (30.6%) |
| 2-Person Households | 89 (61.8%) | 0 (0.0%) |
| 3-Person Households | 11 (7.6%) | 0 (0.0%) |
| 4-Person Households | 0 (0.0%) | 0 (0.0%) |
| 5-Person Households | 0 (0.0%) | 0 (0.0%) |
| 6-Person Households | 0 (0.0%) | 0 (0.0%) |
| 7+ Person Households | 0 (0.0%) | 0 (0.0%) |
| Total | 100 (69.4%) | 44 (30.6%) |
Female Fertility in Phoenicia
Fertility by Age in Phoenicia
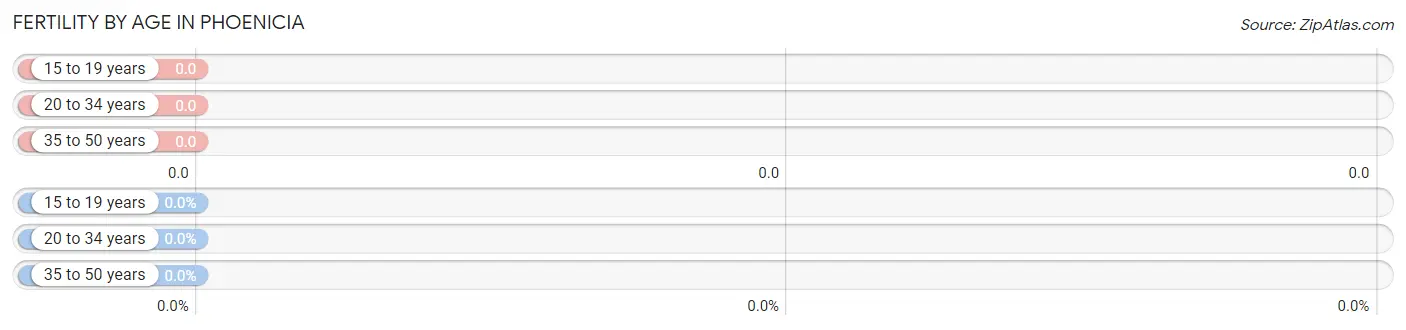
| Age Bracket | Women with Births | Births / 1,000 Women |
| 15 to 19 years | 0 (0.0%) | 0.0 |
| 20 to 34 years | 0 (0.0%) | 0.0 |
| 35 to 50 years | 0 (0.0%) | 0.0 |
| Total | 0 (0.0%) | 0.0 |
Fertility by Age by Marriage Status in Phoenicia
| Age Bracket | Married | Unmarried |
| 15 to 19 years | 0 (0.0%) | 0 (0.0%) |
| 20 to 34 years | 0 (0.0%) | 0 (0.0%) |
| 35 to 50 years | 0 (0.0%) | 0 (0.0%) |
| Total | 0 (0.0%) | 0 (0.0%) |
Fertility by Education in Phoenicia
| Educational Attainment | Women with Births | Births / 1,000 Women |
| Less than High School | 0 (0.0%) | 0.0 |
| High School Diploma | 0 (0.0%) | 0.0 |
| College or Associate's Degree | 0 (0.0%) | 0.0 |
| Bachelor's Degree | 0 (0.0%) | 0.0 |
| Graduate Degree | 0 (0.0%) | 0.0 |
| Total | 0 (0.0%) | 0.0 |
Fertility by Education by Marriage Status in Phoenicia
| Educational Attainment | Married | Unmarried |
| Less than High School | 0 (0.0%) | 0 (0.0%) |
| High School Diploma | 0 (0.0%) | 0 (0.0%) |
| College or Associate's Degree | 0 (0.0%) | 0 (0.0%) |
| Bachelor's Degree | 0 (0.0%) | 0 (0.0%) |
| Graduate Degree | 0 (0.0%) | 0 (0.0%) |
| Total | 0 (0.0%) | 0 (0.0%) |
Employment Characteristics in Phoenicia
Employment by Class of Employer in Phoenicia
Among the 142 employed individuals in Phoenicia, private company employees (128 | 90.1%), state government employees (11 | 7.7%), and self-employed (incorporated) (3 | 2.1%) make up the most common classes of employment.
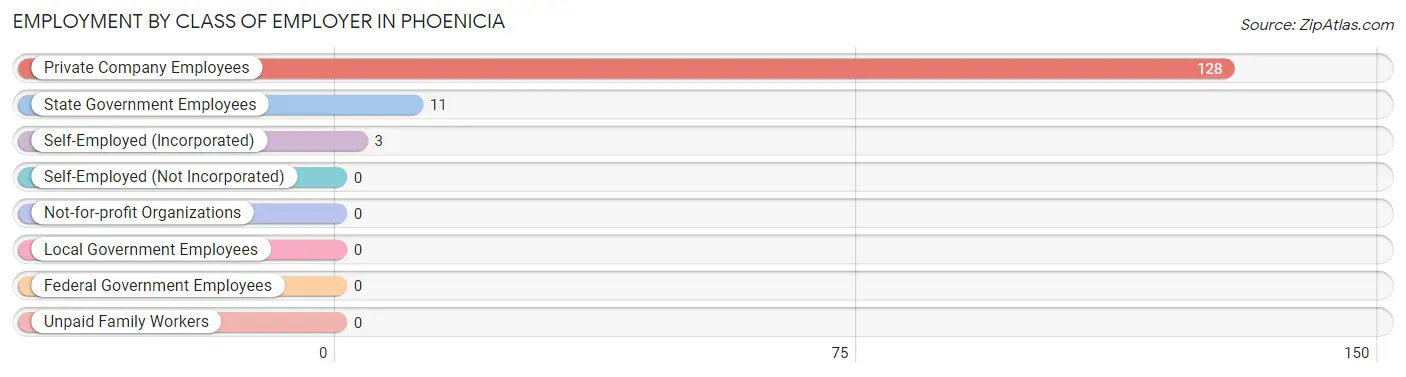
| Employer Class | # Employees | % Employees |
| Private Company Employees | 128 | 90.1% |
| Self-Employed (Incorporated) | 3 | 2.1% |
| Self-Employed (Not Incorporated) | 0 | 0.0% |
| Not-for-profit Organizations | 0 | 0.0% |
| Local Government Employees | 0 | 0.0% |
| State Government Employees | 11 | 7.7% |
| Federal Government Employees | 0 | 0.0% |
| Unpaid Family Workers | 0 | 0.0% |
| Total | 142 | 100.0% |
Employment Status by Age in Phoenicia
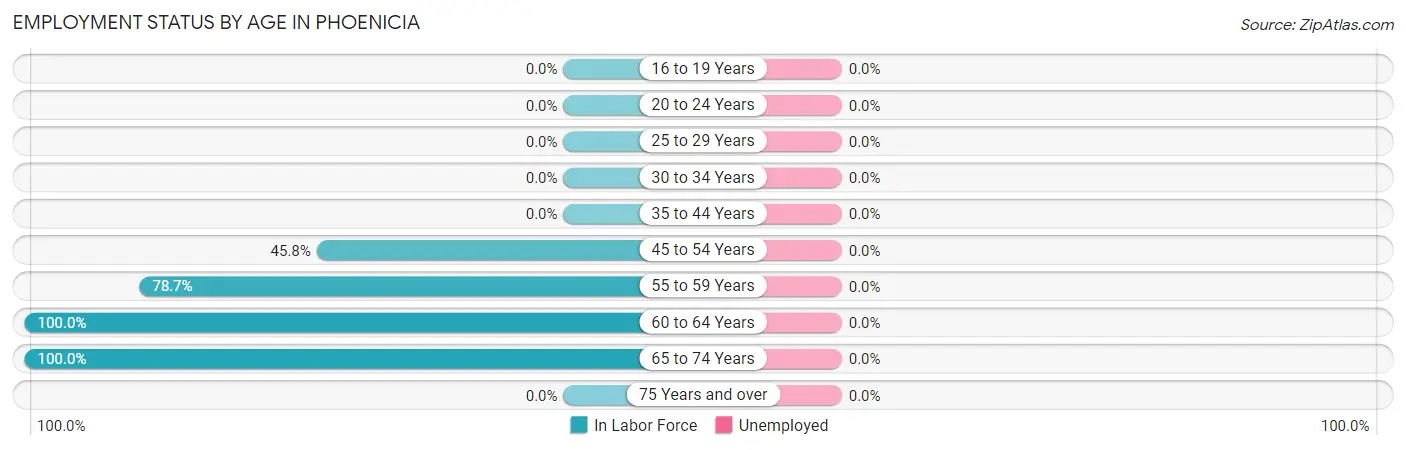
| Age Bracket | In Labor Force | Unemployed |
| 16 to 19 Years | 0 (0.0%) | 0 (0.0%) |
| 20 to 24 Years | 0 (0.0%) | 0 (0.0%) |
| 25 to 29 Years | 0 (0.0%) | 0 (0.0%) |
| 30 to 34 Years | 0 (0.0%) | 0 (0.0%) |
| 35 to 44 Years | 0 (0.0%) | 0 (0.0%) |
| 45 to 54 Years | 55 (45.8%) | 0 (0.0%) |
| 55 to 59 Years | 37 (78.7%) | 0 (0.0%) |
| 60 to 64 Years | 26 (100.0%) | 0 (0.0%) |
| 65 to 74 Years | 24 (100.0%) | 0 (0.0%) |
| 75 Years and over | 0 (0.0%) | 0 (0.0%) |
| Total | 142 (53.4%) | 0 (0.0%) |
Employment Status by Educational Attainment in Phoenicia
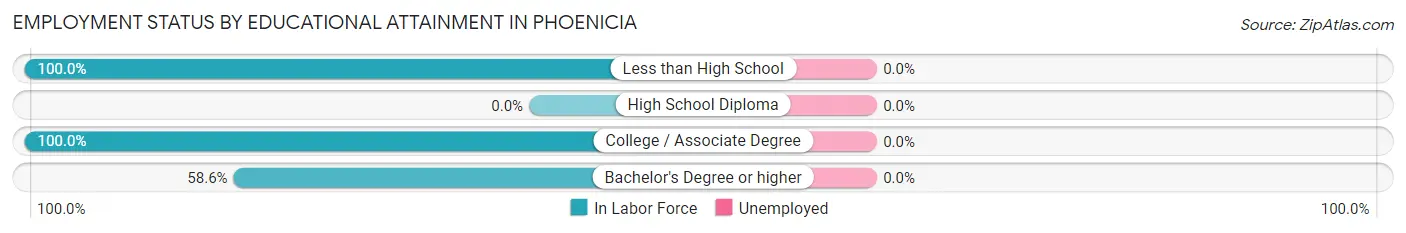
| Educational Attainment | In Labor Force | Unemployed |
| Less than High School | 3 (100.0%) | 0 (0.0%) |
| High School Diploma | 0 (0.0%) | 0 (0.0%) |
| College / Associate Degree | 23 (100.0%) | 0 (0.0%) |
| Bachelor's Degree or higher | 92 (58.6%) | 0 (0.0%) |
| Total | 118 (61.1%) | 0 (0.0%) |
Employment Occupations by Sex in Phoenicia
Management, Business, Science and Arts Occupations
The most common Management, Business, Science and Arts occupations in Phoenicia are Community & Social Service (23 | 16.2%), Arts, Media & Entertainment (23 | 16.2%), Health Diagnosing & Treating (13 | 9.1%), Health Technologists (13 | 9.1%), and Management (11 | 7.7%).
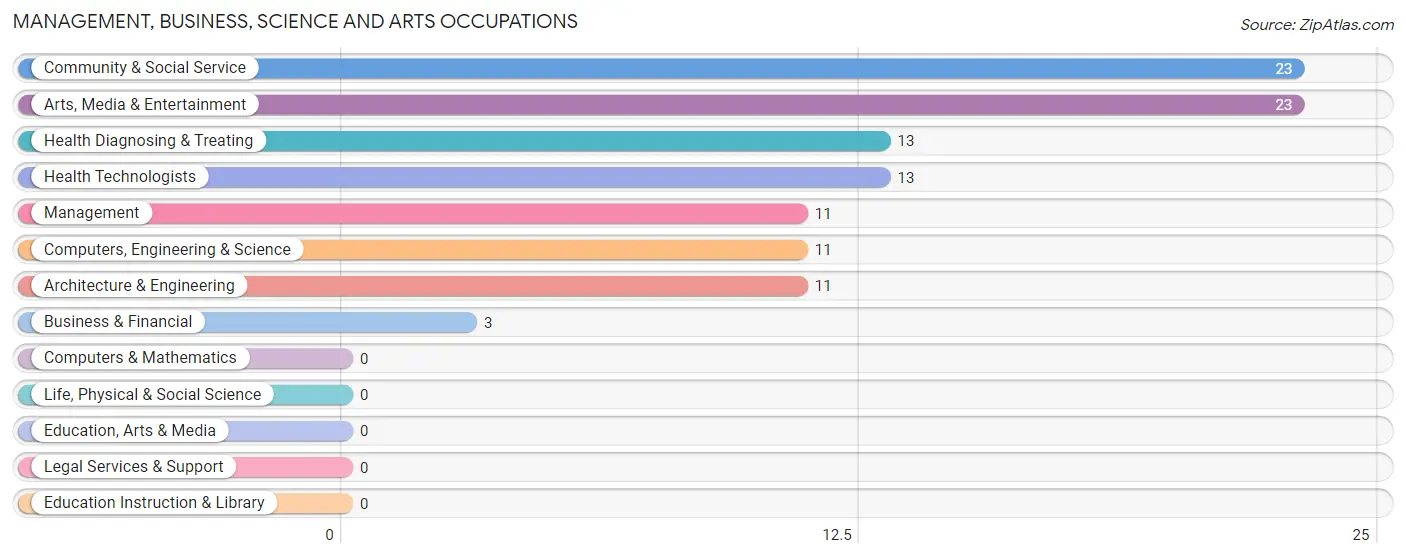
Management, Business, Science and Arts Occupations by Sex
Within the Management, Business, Science and Arts occupations in Phoenicia, the most male-oriented occupations are Management (100.0%), Business & Financial (100.0%), and Computers, Engineering & Science (100.0%), while the most female-oriented occupations are Health Diagnosing & Treating (100.0%), and Health Technologists (100.0%).
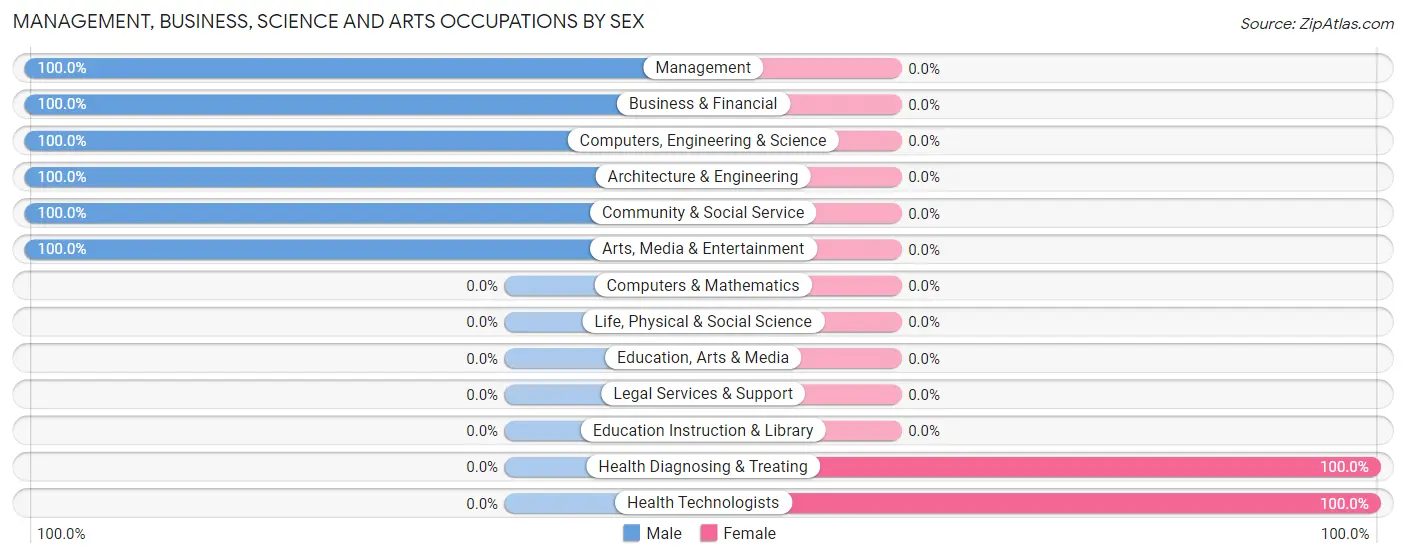
| Occupation | Male | Female |
| Management | 11 (100.0%) | 0 (0.0%) |
| Business & Financial | 3 (100.0%) | 0 (0.0%) |
| Computers, Engineering & Science | 11 (100.0%) | 0 (0.0%) |
| Computers & Mathematics | 0 (0.0%) | 0 (0.0%) |
| Architecture & Engineering | 11 (100.0%) | 0 (0.0%) |
| Life, Physical & Social Science | 0 (0.0%) | 0 (0.0%) |
| Community & Social Service | 23 (100.0%) | 0 (0.0%) |
| Education, Arts & Media | 0 (0.0%) | 0 (0.0%) |
| Legal Services & Support | 0 (0.0%) | 0 (0.0%) |
| Education Instruction & Library | 0 (0.0%) | 0 (0.0%) |
| Arts, Media & Entertainment | 23 (100.0%) | 0 (0.0%) |
| Health Diagnosing & Treating | 0 (0.0%) | 13 (100.0%) |
| Health Technologists | 0 (0.0%) | 13 (100.0%) |
| Total (Category) | 48 (78.7%) | 13 (21.3%) |
| Total (Overall) | 60 (42.2%) | 82 (57.8%) |
Services Occupations
The most common Services occupations in Phoenicia are Food Preparation & Serving (55 | 38.7%), Cleaning & Maintenance (12 | 8.5%), and Personal Care & Service (3 | 2.1%).
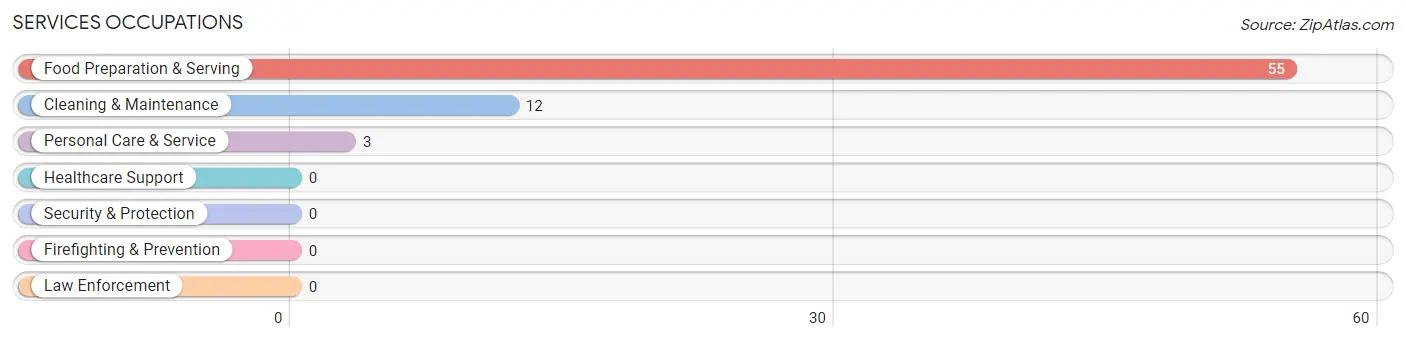
Services Occupations by Sex
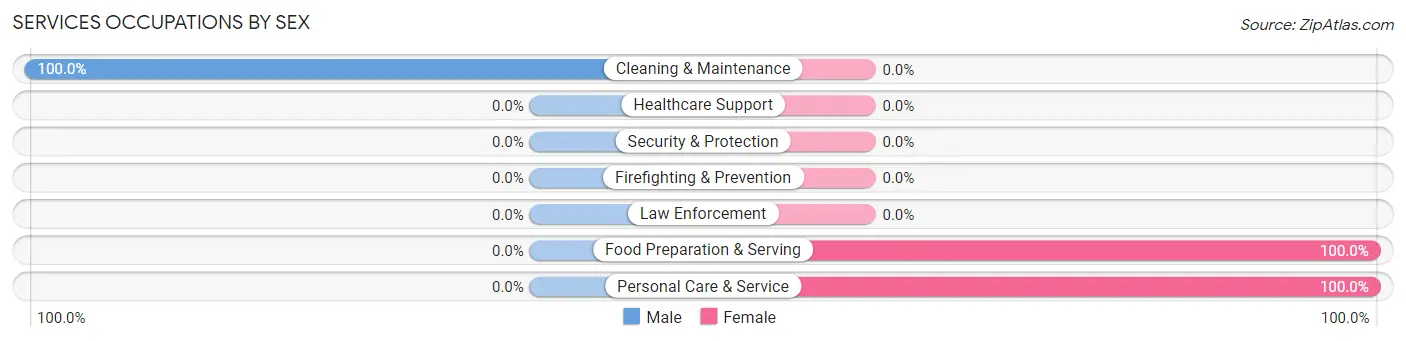
| Occupation | Male | Female |
| Healthcare Support | 0 (0.0%) | 0 (0.0%) |
| Security & Protection | 0 (0.0%) | 0 (0.0%) |
| Firefighting & Prevention | 0 (0.0%) | 0 (0.0%) |
| Law Enforcement | 0 (0.0%) | 0 (0.0%) |
| Food Preparation & Serving | 0 (0.0%) | 55 (100.0%) |
| Cleaning & Maintenance | 12 (100.0%) | 0 (0.0%) |
| Personal Care & Service | 0 (0.0%) | 3 (100.0%) |
| Total (Category) | 12 (17.1%) | 58 (82.9%) |
| Total (Overall) | 60 (42.2%) | 82 (57.8%) |
Sales and Office Occupations
The most common Sales and Office occupations in Phoenicia are , and Office & Administration (11 | 7.7%).
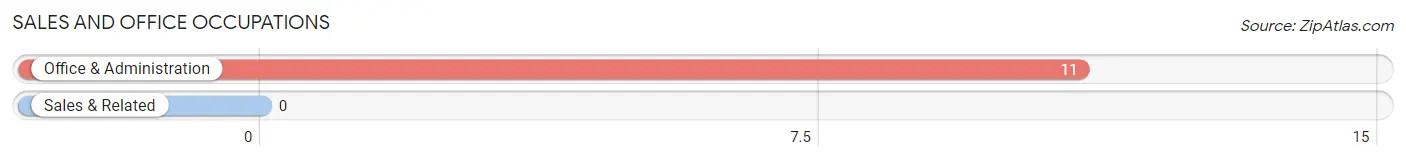
Sales and Office Occupations by Sex
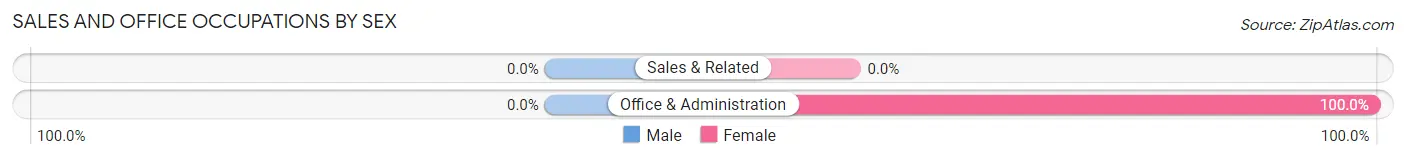
| Occupation | Male | Female |
| Sales & Related | 0 (0.0%) | 0 (0.0%) |
| Office & Administration | 0 (0.0%) | 11 (100.0%) |
| Total (Category) | 0 (0.0%) | 11 (100.0%) |
| Total (Overall) | 60 (42.2%) | 82 (57.8%) |
Natural Resources, Construction and Maintenance Occupations
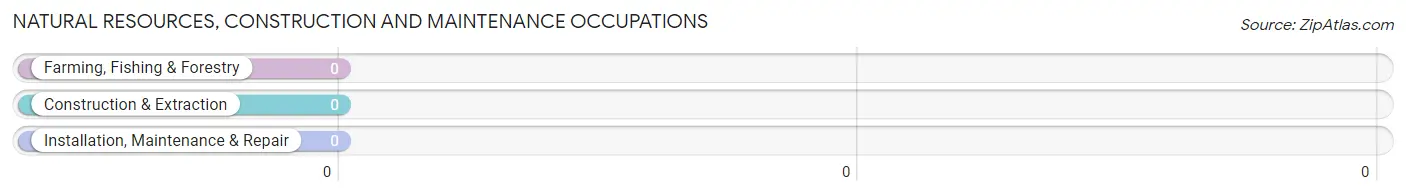
Natural Resources, Construction and Maintenance Occupations by Sex
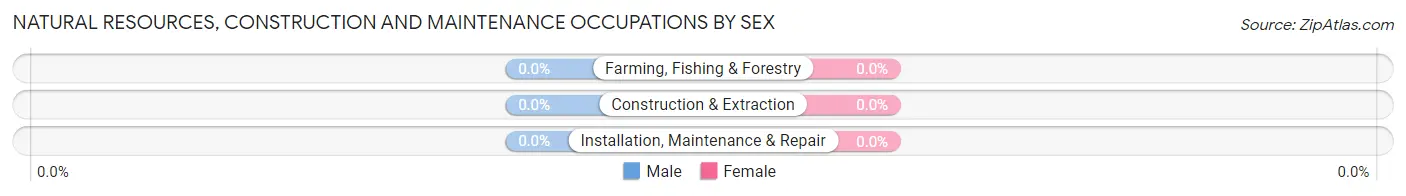
| Occupation | Male | Female |
| Farming, Fishing & Forestry | 0 (0.0%) | 0 (0.0%) |
| Construction & Extraction | 0 (0.0%) | 0 (0.0%) |
| Installation, Maintenance & Repair | 0 (0.0%) | 0 (0.0%) |
| Total (Category) | 0 (0.0%) | 0 (0.0%) |
| Total (Overall) | 60 (42.2%) | 82 (57.8%) |
Production, Transportation and Moving Occupations
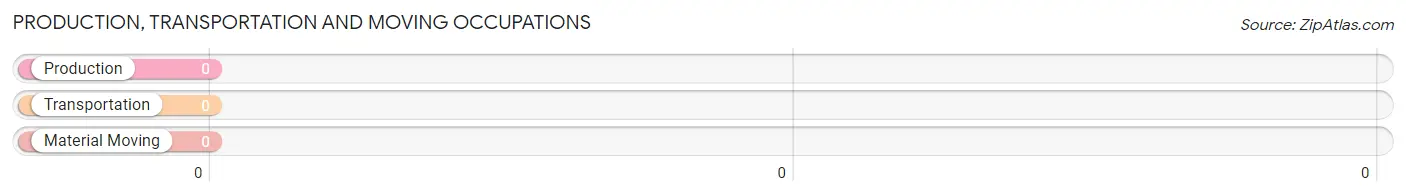
Production, Transportation and Moving Occupations by Sex
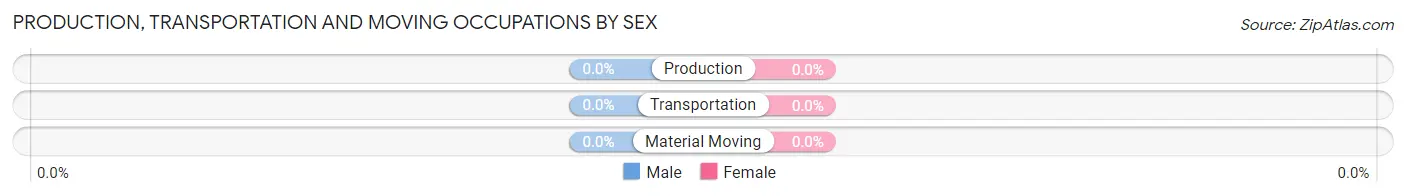
| Occupation | Male | Female |
| Production | 0 (0.0%) | 0 (0.0%) |
| Transportation | 0 (0.0%) | 0 (0.0%) |
| Material Moving | 0 (0.0%) | 0 (0.0%) |
| Total (Category) | 0 (0.0%) | 0 (0.0%) |
| Total (Overall) | 60 (42.2%) | 82 (57.8%) |
Employment Industries by Sex in Phoenicia
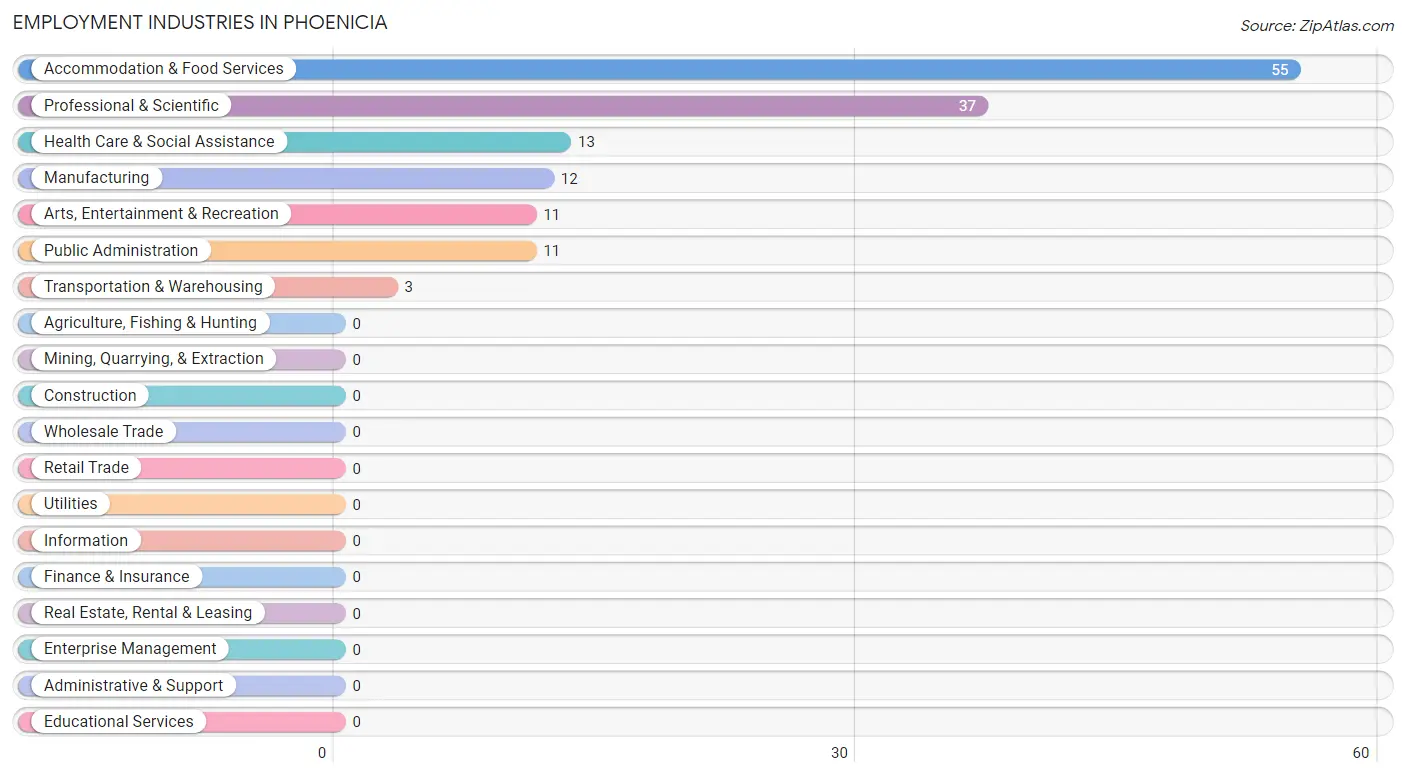
Employment Industries in Phoenicia
The major employment industries in Phoenicia include Accommodation & Food Services (55 | 38.7%), Professional & Scientific (37 | 26.1%), Health Care & Social Assistance (13 | 9.1%), Manufacturing (12 | 8.5%), and Arts, Entertainment & Recreation (11 | 7.7%).
Employment Industries by Sex in Phoenicia
The Phoenicia industries that see more men than women are Manufacturing (100.0%), Professional & Scientific (100.0%), and Arts, Entertainment & Recreation (100.0%), whereas the industries that tend to have a higher number of women are Transportation & Warehousing (100.0%), Health Care & Social Assistance (100.0%), and Accommodation & Food Services (100.0%).
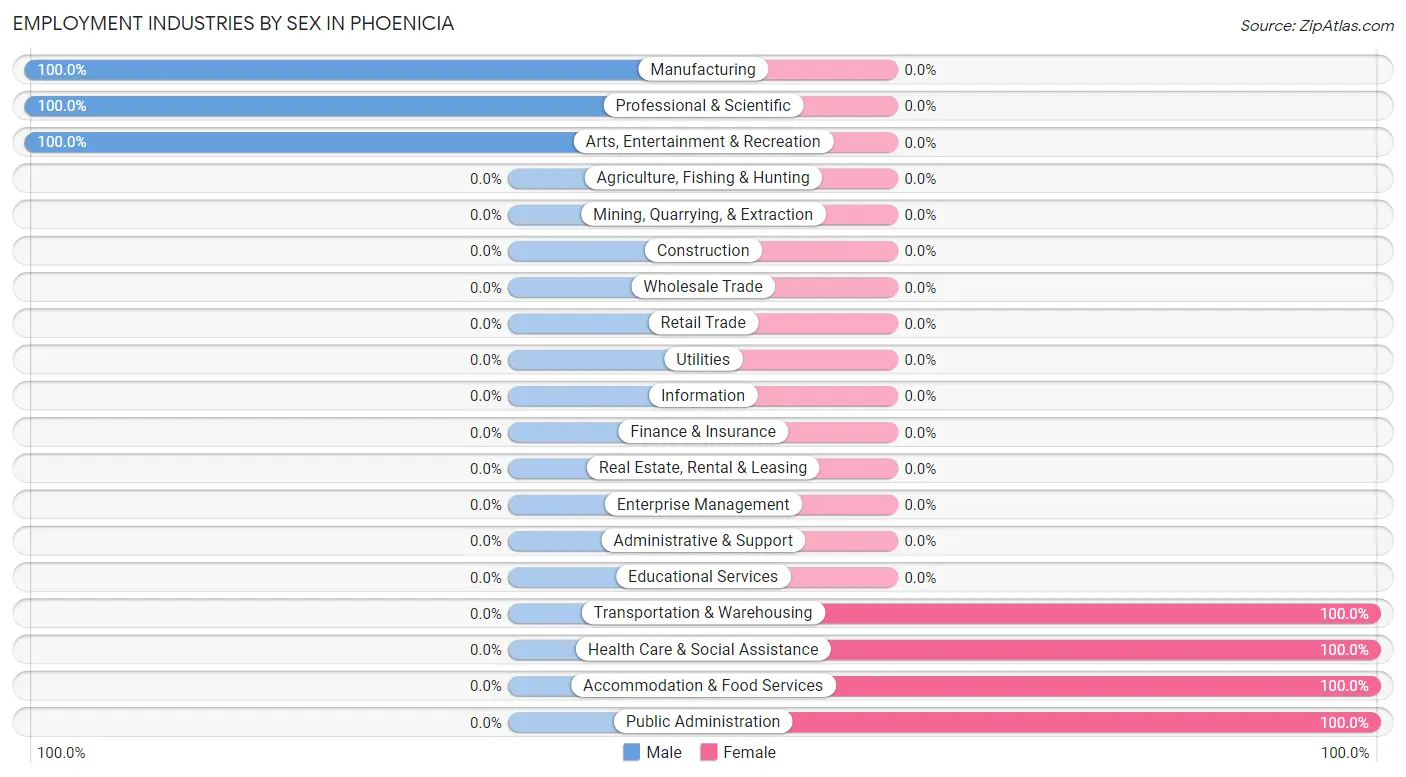
| Industry | Male | Female |
| Agriculture, Fishing & Hunting | 0 (0.0%) | 0 (0.0%) |
| Mining, Quarrying, & Extraction | 0 (0.0%) | 0 (0.0%) |
| Construction | 0 (0.0%) | 0 (0.0%) |
| Manufacturing | 12 (100.0%) | 0 (0.0%) |
| Wholesale Trade | 0 (0.0%) | 0 (0.0%) |
| Retail Trade | 0 (0.0%) | 0 (0.0%) |
| Transportation & Warehousing | 0 (0.0%) | 3 (100.0%) |
| Utilities | 0 (0.0%) | 0 (0.0%) |
| Information | 0 (0.0%) | 0 (0.0%) |
| Finance & Insurance | 0 (0.0%) | 0 (0.0%) |
| Real Estate, Rental & Leasing | 0 (0.0%) | 0 (0.0%) |
| Professional & Scientific | 37 (100.0%) | 0 (0.0%) |
| Enterprise Management | 0 (0.0%) | 0 (0.0%) |
| Administrative & Support | 0 (0.0%) | 0 (0.0%) |
| Educational Services | 0 (0.0%) | 0 (0.0%) |
| Health Care & Social Assistance | 0 (0.0%) | 13 (100.0%) |
| Arts, Entertainment & Recreation | 11 (100.0%) | 0 (0.0%) |
| Accommodation & Food Services | 0 (0.0%) | 55 (100.0%) |
| Public Administration | 0 (0.0%) | 11 (100.0%) |
| Total | 60 (42.2%) | 82 (57.8%) |
Education in Phoenicia
School Enrollment in Phoenicia
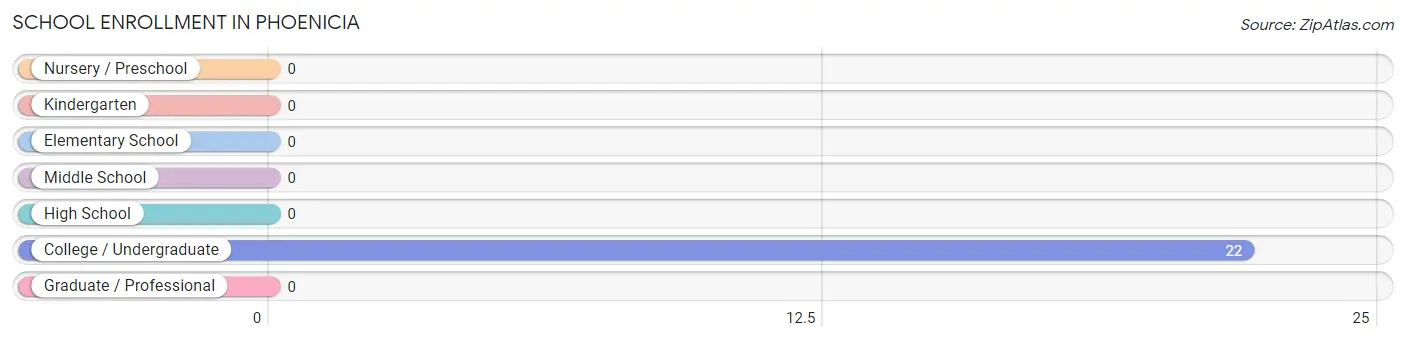
| School Level | # Students | % Students |
| Nursery / Preschool | 0 | 0.0% |
| Kindergarten | 0 | 0.0% |
| Elementary School | 0 | 0.0% |
| Middle School | 0 | 0.0% |
| High School | 0 | 0.0% |
| College / Undergraduate | 22 | 100.0% |
| Graduate / Professional | 0 | 0.0% |
| Total | 22 | 100.0% |
School Enrollment by Age by Funding Source in Phoenicia
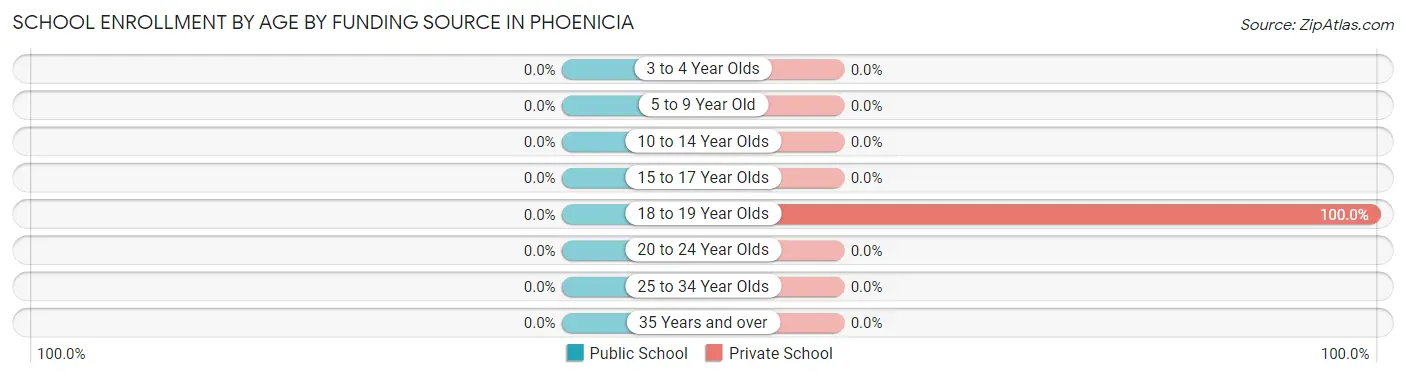
| Age Bracket | Public School | Private School |
| 3 to 4 Year Olds | 0 (0.0%) | 0 (0.0%) |
| 5 to 9 Year Old | 0 (0.0%) | 0 (0.0%) |
| 10 to 14 Year Olds | 0 (0.0%) | 0 (0.0%) |
| 15 to 17 Year Olds | 0 (0.0%) | 0 (0.0%) |
| 18 to 19 Year Olds | 0 (0.0%) | 22 (100.0%) |
| 20 to 24 Year Olds | 0 (0.0%) | 0 (0.0%) |
| 25 to 34 Year Olds | 0 (0.0%) | 0 (0.0%) |
| 35 Years and over | 0 (0.0%) | 0 (0.0%) |
| Total | 0 (0.0%) | 22 (100.0%) |
Educational Attainment by Field of Study in Phoenicia
Business (120 | 66.7%), bio, nature & agricultural (23 | 12.8%), literature & languages (23 | 12.8%), and computers & mathematics (14 | 7.8%) are the most common fields of study among 180 individuals in Phoenicia who have obtained a bachelor's degree or higher.
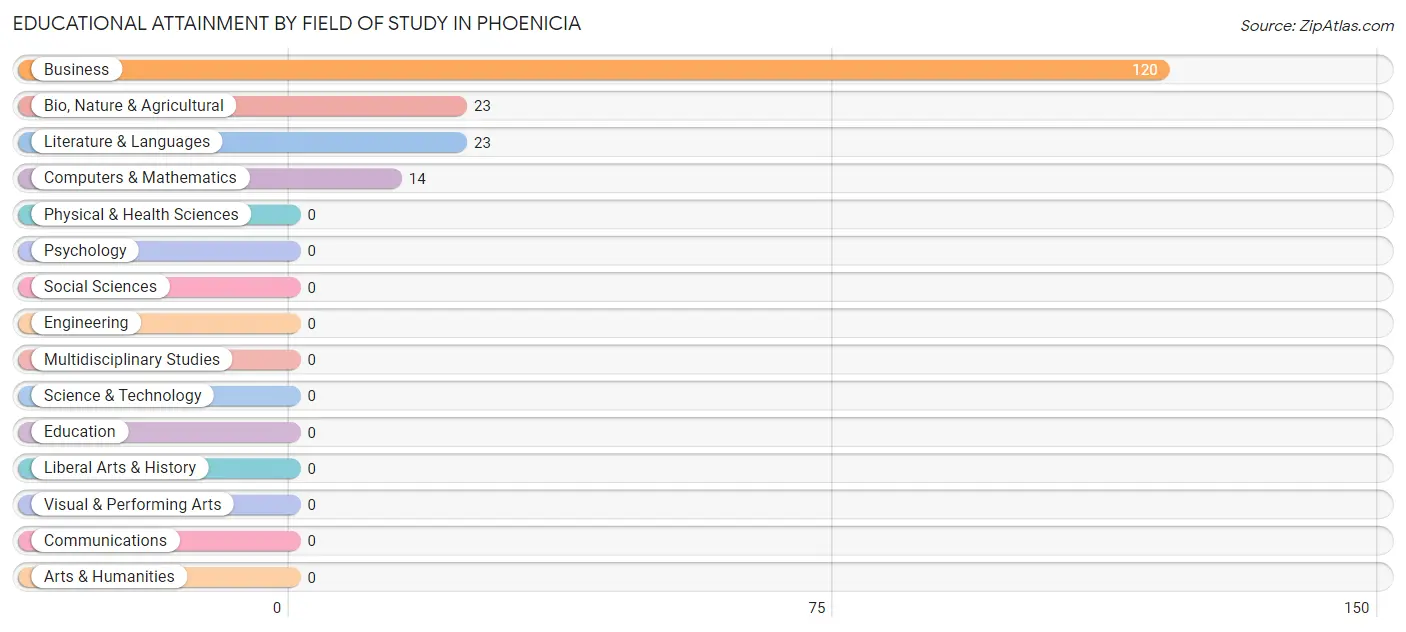
| Field of Study | # Graduates | % Graduates |
| Computers & Mathematics | 14 | 7.8% |
| Bio, Nature & Agricultural | 23 | 12.8% |
| Physical & Health Sciences | 0 | 0.0% |
| Psychology | 0 | 0.0% |
| Social Sciences | 0 | 0.0% |
| Engineering | 0 | 0.0% |
| Multidisciplinary Studies | 0 | 0.0% |
| Science & Technology | 0 | 0.0% |
| Business | 120 | 66.7% |
| Education | 0 | 0.0% |
| Literature & Languages | 23 | 12.8% |
| Liberal Arts & History | 0 | 0.0% |
| Visual & Performing Arts | 0 | 0.0% |
| Communications | 0 | 0.0% |
| Arts & Humanities | 0 | 0.0% |
| Total | 180 | 100.0% |
Transportation & Commute in Phoenicia
Vehicle Availability by Sex in Phoenicia
The most prevalent vehicle ownership categories in Phoenicia are males with 1 vehicle (26, accounting for 43.3%) and females with 1 vehicle (3, making up 31.7%).
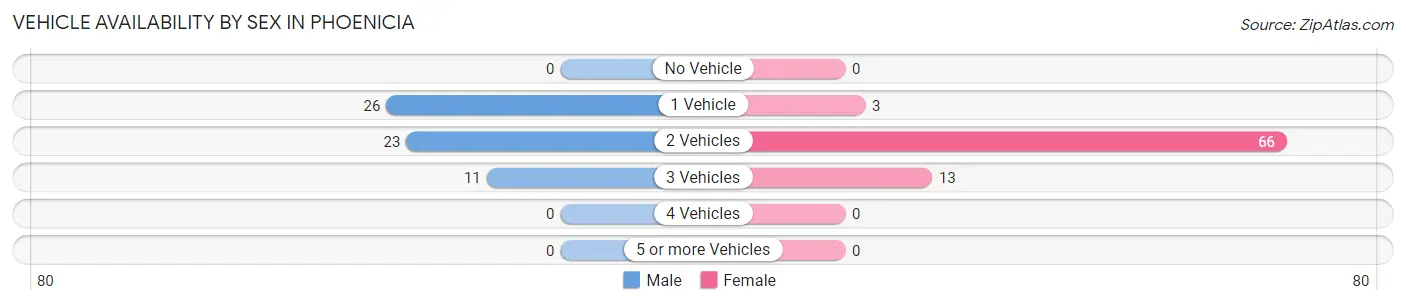
| Vehicles Available | Male | Female |
| No Vehicle | 0 (0.0%) | 0 (0.0%) |
| 1 Vehicle | 26 (43.3%) | 3 (3.7%) |
| 2 Vehicles | 23 (38.3%) | 66 (80.5%) |
| 3 Vehicles | 11 (18.3%) | 13 (15.9%) |
| 4 Vehicles | 0 (0.0%) | 0 (0.0%) |
| 5 or more Vehicles | 0 (0.0%) | 0 (0.0%) |
| Total | 60 (100.0%) | 82 (100.0%) |
Commute Time in Phoenicia
The most frequently occuring commute durations in Phoenicia are 60 to 89 minutes (55 commuters, 47.4%), 20 to 24 minutes (23 commuters, 19.8%), and 30 to 34 minutes (13 commuters, 11.2%).
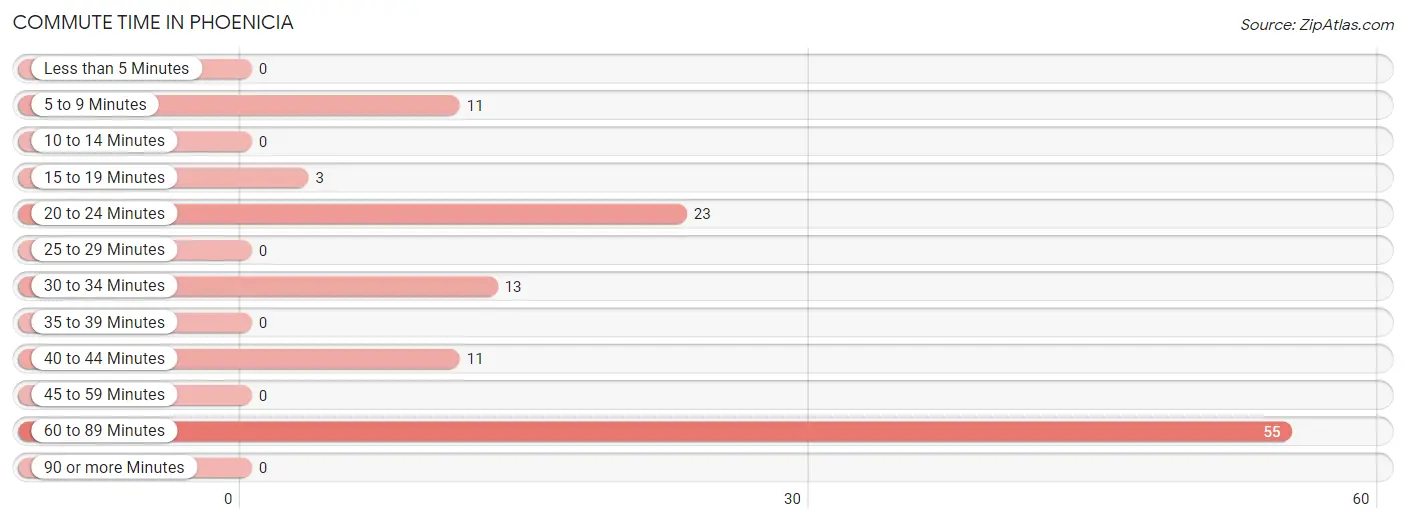
| Commute Time | # Commuters | % Commuters |
| Less than 5 Minutes | 0 | 0.0% |
| 5 to 9 Minutes | 11 | 9.5% |
| 10 to 14 Minutes | 0 | 0.0% |
| 15 to 19 Minutes | 3 | 2.6% |
| 20 to 24 Minutes | 23 | 19.8% |
| 25 to 29 Minutes | 0 | 0.0% |
| 30 to 34 Minutes | 13 | 11.2% |
| 35 to 39 Minutes | 0 | 0.0% |
| 40 to 44 Minutes | 11 | 9.5% |
| 45 to 59 Minutes | 0 | 0.0% |
| 60 to 89 Minutes | 55 | 47.4% |
| 90 or more Minutes | 0 | 0.0% |
Commute Time by Sex in Phoenicia
The most common commute times in Phoenicia are 20 to 24 minutes (23 commuters, 67.6%) for males and 60 to 89 minutes (55 commuters, 67.1%) for females.
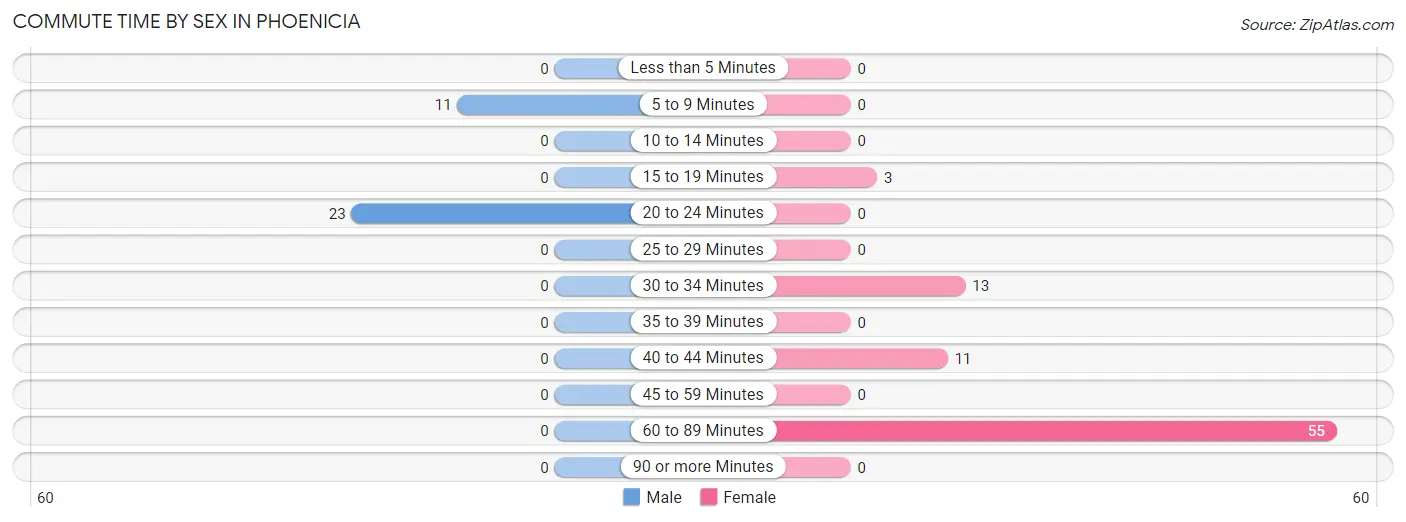
| Commute Time | Male | Female |
| Less than 5 Minutes | 0 (0.0%) | 0 (0.0%) |
| 5 to 9 Minutes | 11 (32.4%) | 0 (0.0%) |
| 10 to 14 Minutes | 0 (0.0%) | 0 (0.0%) |
| 15 to 19 Minutes | 0 (0.0%) | 3 (3.7%) |
| 20 to 24 Minutes | 23 (67.6%) | 0 (0.0%) |
| 25 to 29 Minutes | 0 (0.0%) | 0 (0.0%) |
| 30 to 34 Minutes | 0 (0.0%) | 13 (15.9%) |
| 35 to 39 Minutes | 0 (0.0%) | 0 (0.0%) |
| 40 to 44 Minutes | 0 (0.0%) | 11 (13.4%) |
| 45 to 59 Minutes | 0 (0.0%) | 0 (0.0%) |
| 60 to 89 Minutes | 0 (0.0%) | 55 (67.1%) |
| 90 or more Minutes | 0 (0.0%) | 0 (0.0%) |
Time of Departure to Work by Sex in Phoenicia
The most frequent times of departure to work in Phoenicia are 7:00 AM to 7:29 AM (23, 67.6%) for males and 12:00 PM to 3:59 PM (55, 67.1%) for females.
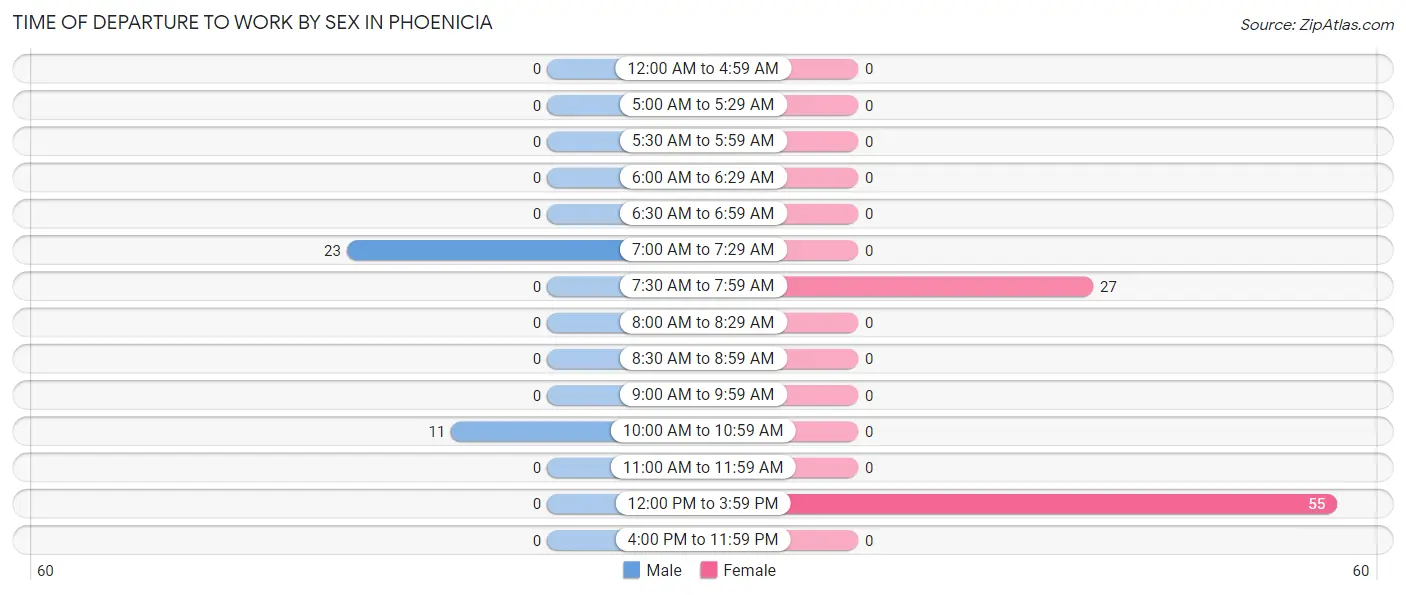
| Time of Departure | Male | Female |
| 12:00 AM to 4:59 AM | 0 (0.0%) | 0 (0.0%) |
| 5:00 AM to 5:29 AM | 0 (0.0%) | 0 (0.0%) |
| 5:30 AM to 5:59 AM | 0 (0.0%) | 0 (0.0%) |
| 6:00 AM to 6:29 AM | 0 (0.0%) | 0 (0.0%) |
| 6:30 AM to 6:59 AM | 0 (0.0%) | 0 (0.0%) |
| 7:00 AM to 7:29 AM | 23 (67.6%) | 0 (0.0%) |
| 7:30 AM to 7:59 AM | 0 (0.0%) | 27 (32.9%) |
| 8:00 AM to 8:29 AM | 0 (0.0%) | 0 (0.0%) |
| 8:30 AM to 8:59 AM | 0 (0.0%) | 0 (0.0%) |
| 9:00 AM to 9:59 AM | 0 (0.0%) | 0 (0.0%) |
| 10:00 AM to 10:59 AM | 11 (32.4%) | 0 (0.0%) |
| 11:00 AM to 11:59 AM | 0 (0.0%) | 0 (0.0%) |
| 12:00 PM to 3:59 PM | 0 (0.0%) | 55 (67.1%) |
| 4:00 PM to 11:59 PM | 0 (0.0%) | 0 (0.0%) |
| Total | 34 (100.0%) | 82 (100.0%) |
Housing Occupancy in Phoenicia
Occupancy by Ownership in Phoenicia
Of the total 144 dwellings in Phoenicia, owner-occupied units account for 90 (62.5%), while renter-occupied units make up 54 (37.5%).
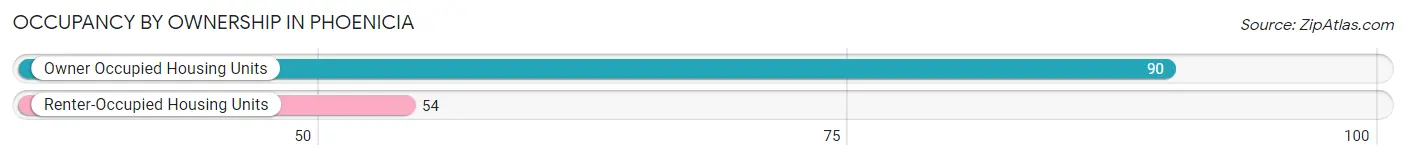
| Occupancy | # Housing Units | % Housing Units |
| Owner Occupied Housing Units | 90 | 62.5% |
| Renter-Occupied Housing Units | 54 | 37.5% |
| Total Occupied Housing Units | 144 | 100.0% |
Occupancy by Household Size in Phoenicia
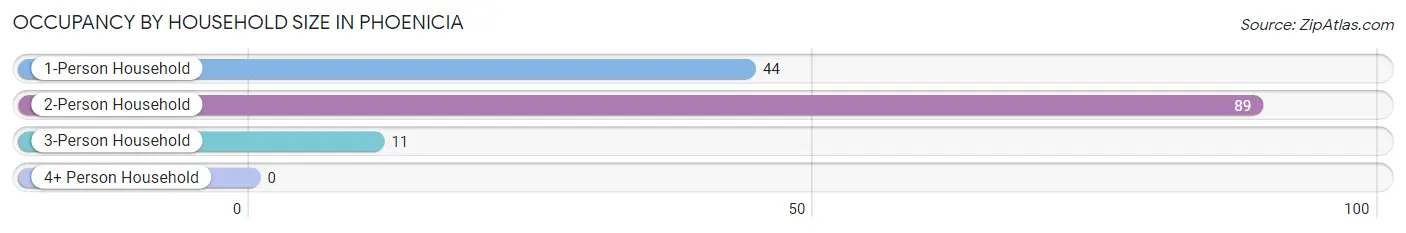
| Household Size | # Housing Units | % Housing Units |
| 1-Person Household | 44 | 30.6% |
| 2-Person Household | 89 | 61.8% |
| 3-Person Household | 11 | 7.6% |
| 4+ Person Household | 0 | 0.0% |
| Total Housing Units | 144 | 100.0% |
Occupancy by Ownership by Household Size in Phoenicia
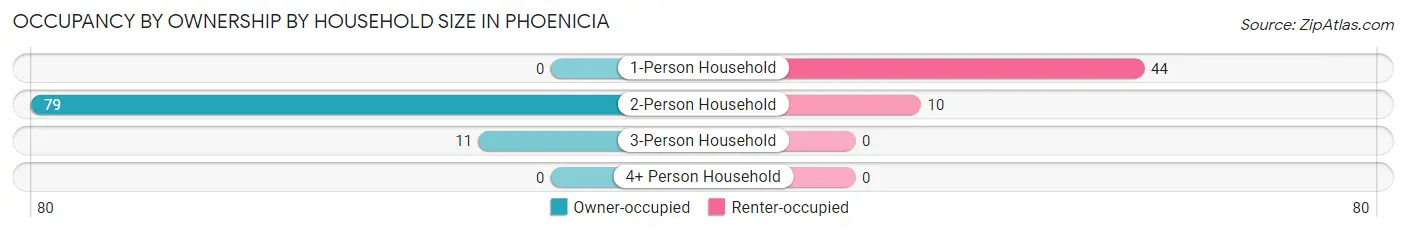
| Household Size | Owner-occupied | Renter-occupied |
| 1-Person Household | 0 (0.0%) | 44 (100.0%) |
| 2-Person Household | 79 (88.8%) | 10 (11.2%) |
| 3-Person Household | 11 (100.0%) | 0 (0.0%) |
| 4+ Person Household | 0 (0.0%) | 0 (0.0%) |
| Total Housing Units | 90 (62.5%) | 54 (37.5%) |
Occupancy by Educational Attainment in Phoenicia
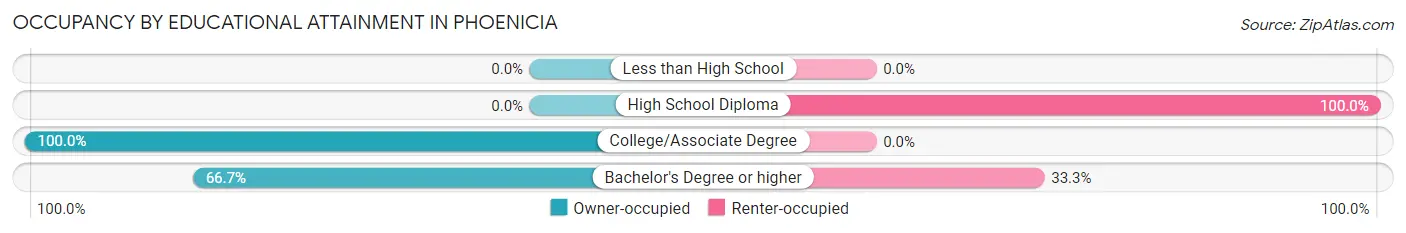
| Household Size | Owner-occupied | Renter-occupied |
| Less than High School | 0 (0.0%) | 0 (0.0%) |
| High School Diploma | 0 (0.0%) | 20 (100.0%) |
| College/Associate Degree | 22 (100.0%) | 0 (0.0%) |
| Bachelor's Degree or higher | 68 (66.7%) | 34 (33.3%) |
Occupancy by Age of Householder in Phoenicia
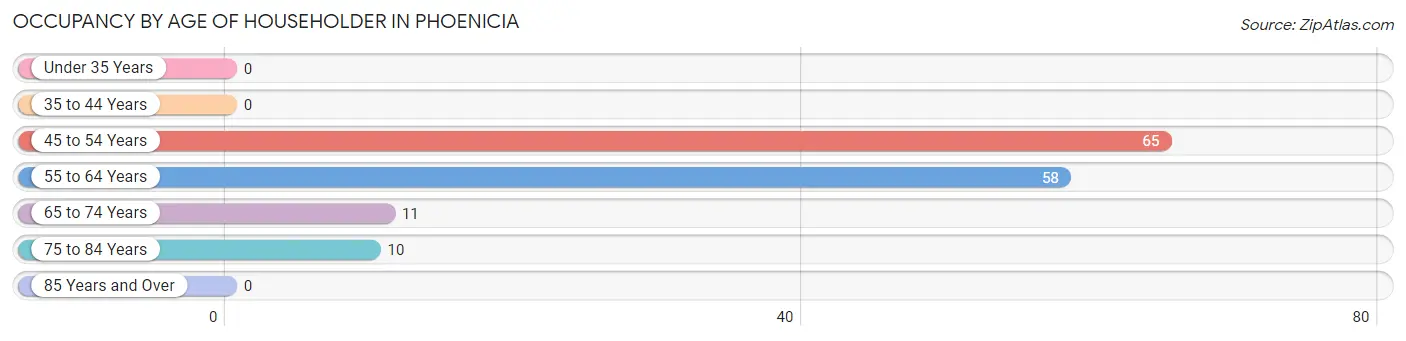
| Age Bracket | # Households | % Households |
| Under 35 Years | 0 | 0.0% |
| 35 to 44 Years | 0 | 0.0% |
| 45 to 54 Years | 65 | 45.1% |
| 55 to 64 Years | 58 | 40.3% |
| 65 to 74 Years | 11 | 7.6% |
| 75 to 84 Years | 10 | 6.9% |
| 85 Years and Over | 0 | 0.0% |
| Total | 144 | 100.0% |
Housing Finances in Phoenicia
Median Income by Occupancy in Phoenicia
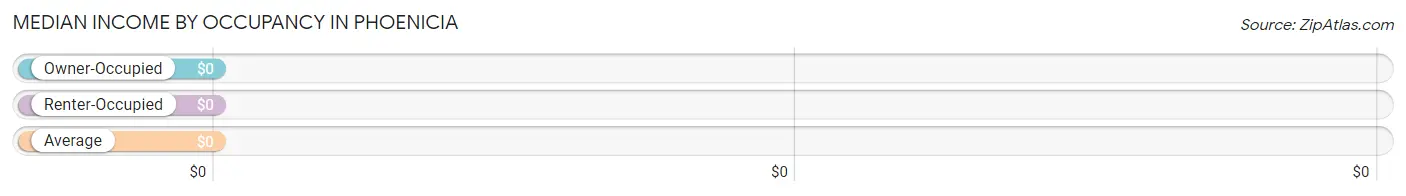
| Occupancy Type | # Households | Median Income |
| Owner-Occupied | 90 (62.5%) | $0 |
| Renter-Occupied | 54 (37.5%) | $0 |
| Average | 144 (100.0%) | $0 |
Occupancy by Householder Income Bracket in Phoenicia
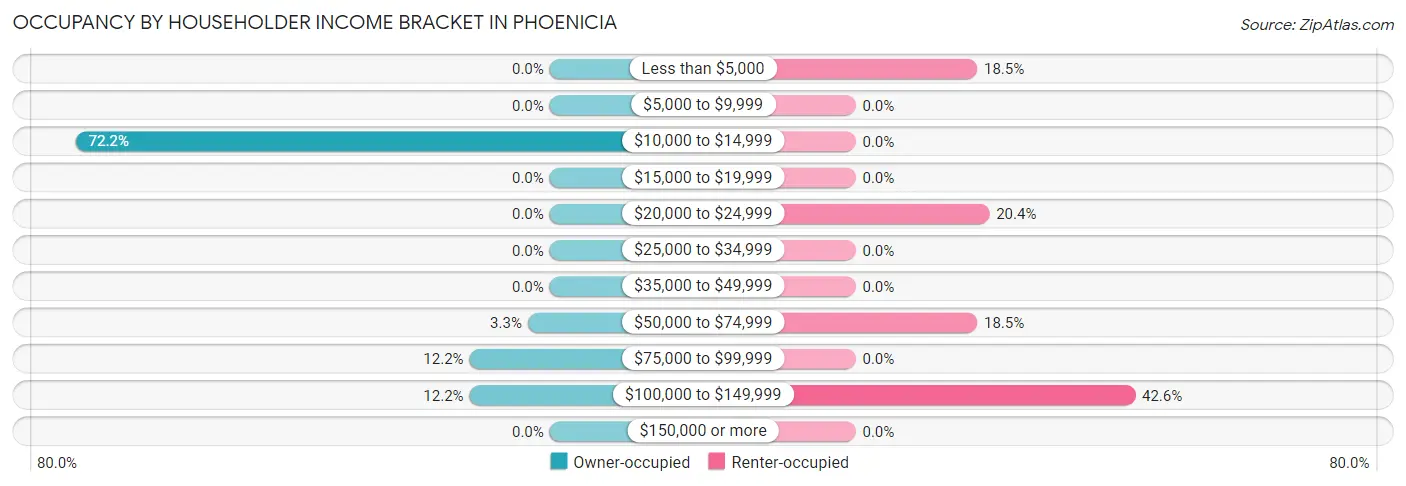
| Income Bracket | Owner-occupied | Renter-occupied |
| Less than $5,000 | 0 (0.0%) | 10 (18.5%) |
| $5,000 to $9,999 | 0 (0.0%) | 0 (0.0%) |
| $10,000 to $14,999 | 65 (72.2%) | 0 (0.0%) |
| $15,000 to $19,999 | 0 (0.0%) | 0 (0.0%) |
| $20,000 to $24,999 | 0 (0.0%) | 11 (20.4%) |
| $25,000 to $34,999 | 0 (0.0%) | 0 (0.0%) |
| $35,000 to $49,999 | 0 (0.0%) | 0 (0.0%) |
| $50,000 to $74,999 | 3 (3.3%) | 10 (18.5%) |
| $75,000 to $99,999 | 11 (12.2%) | 0 (0.0%) |
| $100,000 to $149,999 | 11 (12.2%) | 23 (42.6%) |
| $150,000 or more | 0 (0.0%) | 0 (0.0%) |
| Total | 90 (100.0%) | 54 (100.0%) |
Monthly Housing Cost Tiers in Phoenicia
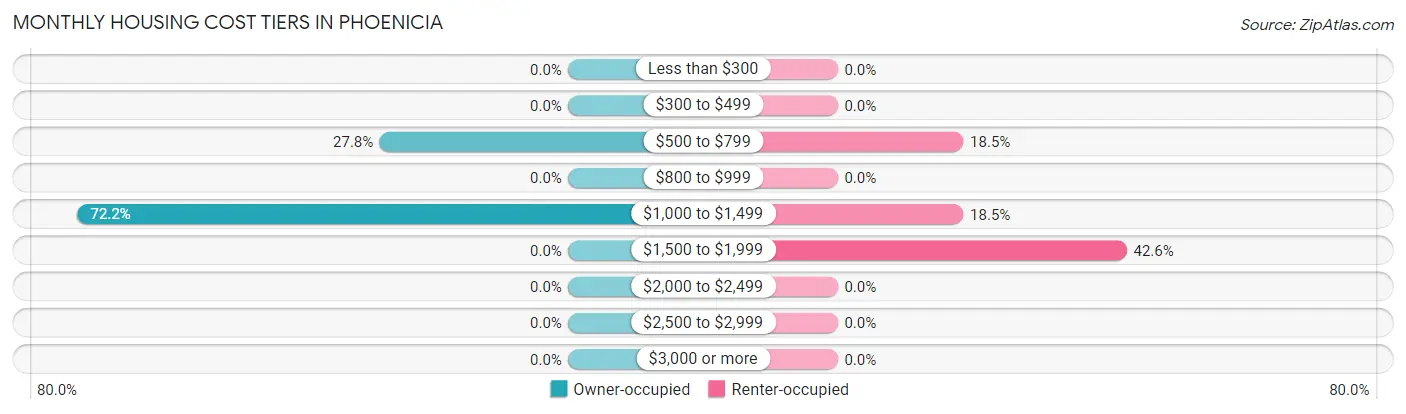
| Monthly Cost | Owner-occupied | Renter-occupied |
| Less than $300 | 0 (0.0%) | 0 (0.0%) |
| $300 to $499 | 0 (0.0%) | 0 (0.0%) |
| $500 to $799 | 25 (27.8%) | 10 (18.5%) |
| $800 to $999 | 0 (0.0%) | 0 (0.0%) |
| $1,000 to $1,499 | 65 (72.2%) | 10 (18.5%) |
| $1,500 to $1,999 | 0 (0.0%) | 23 (42.6%) |
| $2,000 to $2,499 | 0 (0.0%) | 0 (0.0%) |
| $2,500 to $2,999 | 0 (0.0%) | 0 (0.0%) |
| $3,000 or more | 0 (0.0%) | 0 (0.0%) |
| Total | 90 (100.0%) | 54 (100.0%) |
Physical Housing Characteristics in Phoenicia
Housing Structures in Phoenicia
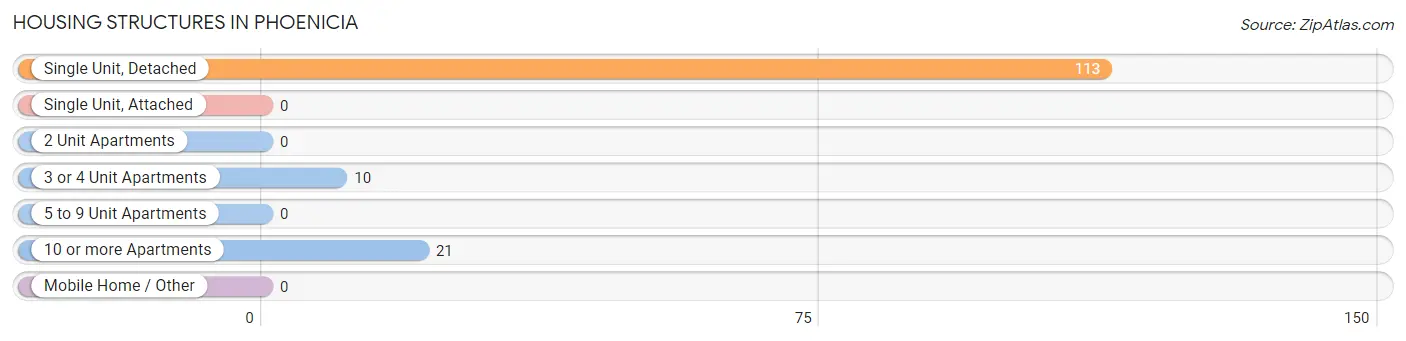
| Structure Type | # Housing Units | % Housing Units |
| Single Unit, Detached | 113 | 78.5% |
| Single Unit, Attached | 0 | 0.0% |
| 2 Unit Apartments | 0 | 0.0% |
| 3 or 4 Unit Apartments | 10 | 6.9% |
| 5 to 9 Unit Apartments | 0 | 0.0% |
| 10 or more Apartments | 21 | 14.6% |
| Mobile Home / Other | 0 | 0.0% |
| Total | 144 | 100.0% |
Housing Structures by Occupancy in Phoenicia
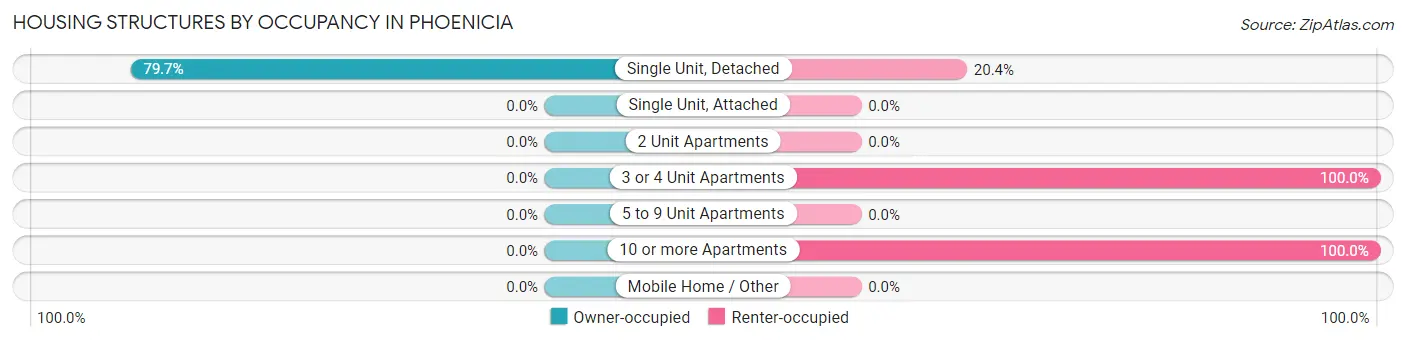
| Structure Type | Owner-occupied | Renter-occupied |
| Single Unit, Detached | 90 (79.6%) | 23 (20.3%) |
| Single Unit, Attached | 0 (0.0%) | 0 (0.0%) |
| 2 Unit Apartments | 0 (0.0%) | 0 (0.0%) |
| 3 or 4 Unit Apartments | 0 (0.0%) | 10 (100.0%) |
| 5 to 9 Unit Apartments | 0 (0.0%) | 0 (0.0%) |
| 10 or more Apartments | 0 (0.0%) | 21 (100.0%) |
| Mobile Home / Other | 0 (0.0%) | 0 (0.0%) |
| Total | 90 (62.5%) | 54 (37.5%) |
Housing Structures by Number of Rooms in Phoenicia
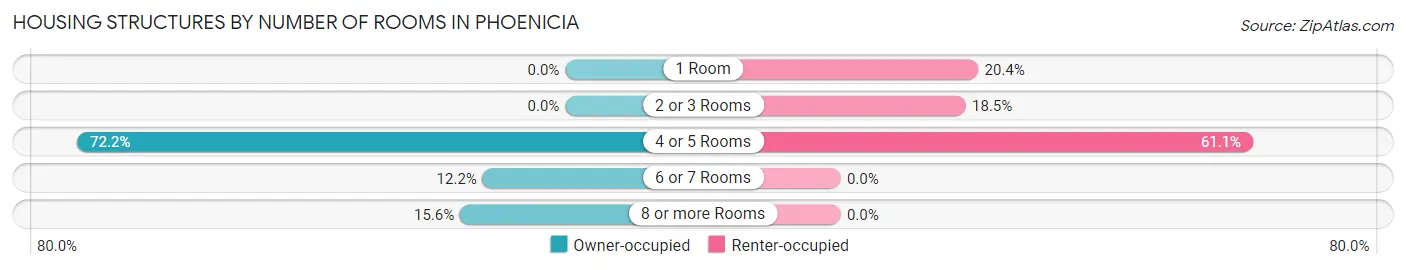
| Number of Rooms | Owner-occupied | Renter-occupied |
| 1 Room | 0 (0.0%) | 11 (20.4%) |
| 2 or 3 Rooms | 0 (0.0%) | 10 (18.5%) |
| 4 or 5 Rooms | 65 (72.2%) | 33 (61.1%) |
| 6 or 7 Rooms | 11 (12.2%) | 0 (0.0%) |
| 8 or more Rooms | 14 (15.6%) | 0 (0.0%) |
| Total | 90 (100.0%) | 54 (100.0%) |
Housing Structure by Heating Type in Phoenicia
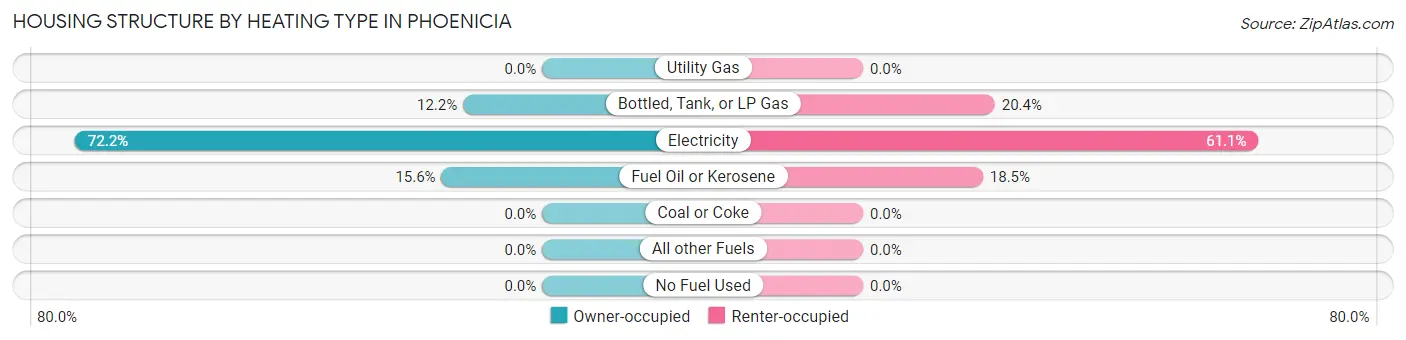
| Heating Type | Owner-occupied | Renter-occupied |
| Utility Gas | 0 (0.0%) | 0 (0.0%) |
| Bottled, Tank, or LP Gas | 11 (12.2%) | 11 (20.4%) |
| Electricity | 65 (72.2%) | 33 (61.1%) |
| Fuel Oil or Kerosene | 14 (15.6%) | 10 (18.5%) |
| Coal or Coke | 0 (0.0%) | 0 (0.0%) |
| All other Fuels | 0 (0.0%) | 0 (0.0%) |
| No Fuel Used | 0 (0.0%) | 0 (0.0%) |
| Total | 90 (100.0%) | 54 (100.0%) |
Household Vehicle Usage in Phoenicia
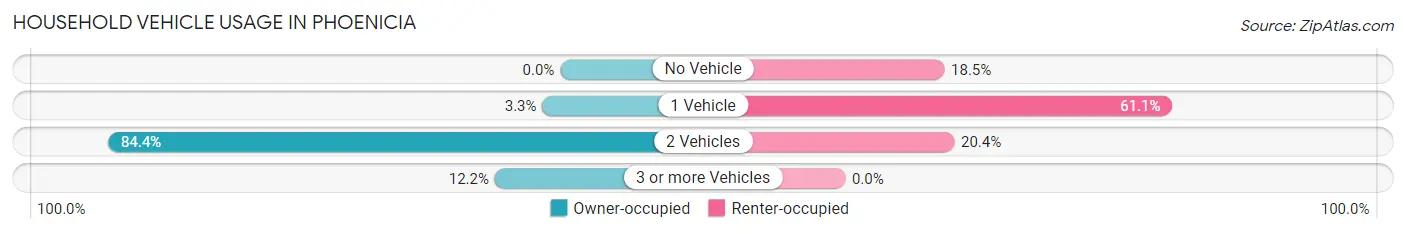
| Vehicles per Household | Owner-occupied | Renter-occupied |
| No Vehicle | 0 (0.0%) | 10 (18.5%) |
| 1 Vehicle | 3 (3.3%) | 33 (61.1%) |
| 2 Vehicles | 76 (84.4%) | 11 (20.4%) |
| 3 or more Vehicles | 11 (12.2%) | 0 (0.0%) |
| Total | 90 (100.0%) | 54 (100.0%) |
Real Estate & Mortgages in Phoenicia
Real Estate and Mortgage Overview in Phoenicia
| Characteristic | Without Mortgage | With Mortgage |
| Housing Units | 90 | 0 |
| Median Property Value | $576,900 | $0 |
| Median Household Income | - | - |
| Monthly Housing Costs | $1,331 | $0 |
| Real Estate Taxes | $5,769 | $0 |
Property Value by Mortgage Status in Phoenicia
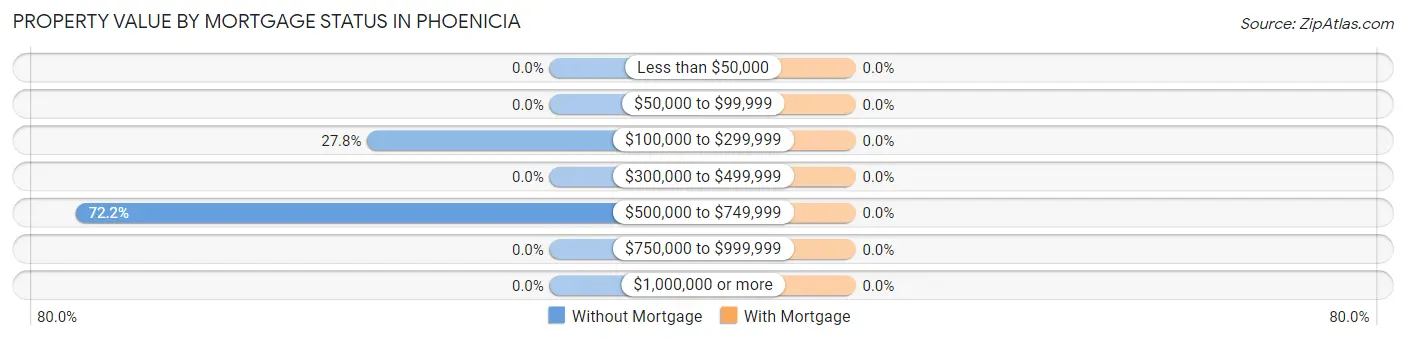
| Property Value | Without Mortgage | With Mortgage |
| Less than $50,000 | 0 (0.0%) | 0 (0.0%) |
| $50,000 to $99,999 | 0 (0.0%) | 0 (0.0%) |
| $100,000 to $299,999 | 25 (27.8%) | 0 (0.0%) |
| $300,000 to $499,999 | 0 (0.0%) | 0 (0.0%) |
| $500,000 to $749,999 | 65 (72.2%) | 0 (0.0%) |
| $750,000 to $999,999 | 0 (0.0%) | 0 (0.0%) |
| $1,000,000 or more | 0 (0.0%) | 0 (0.0%) |
| Total | 90 (100.0%) | 0 (0.0%) |
Household Income by Mortgage Status in Phoenicia
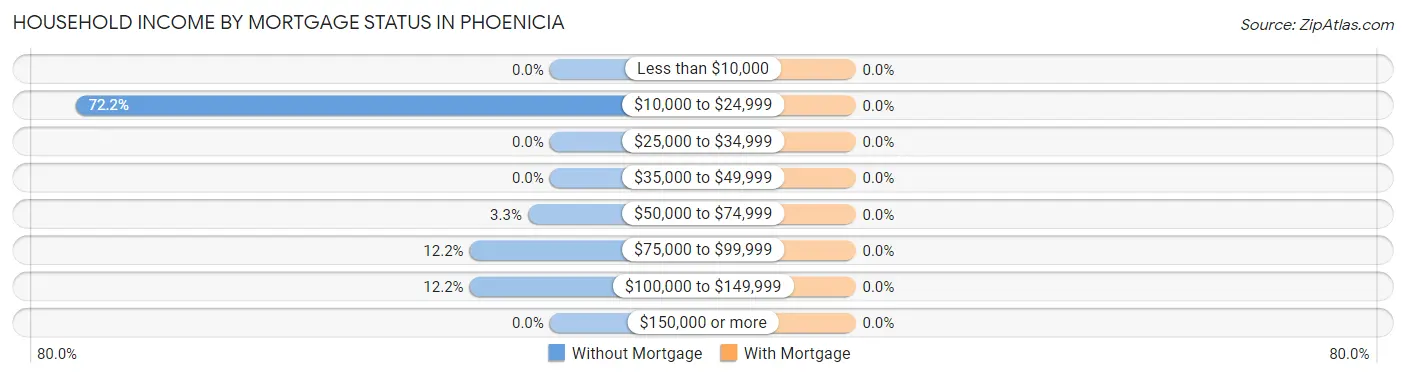
| Household Income | Without Mortgage | With Mortgage |
| Less than $10,000 | 0 (0.0%) | 0 (0.0%) |
| $10,000 to $24,999 | 65 (72.2%) | 0 (0.0%) |
| $25,000 to $34,999 | 0 (0.0%) | 0 (0.0%) |
| $35,000 to $49,999 | 0 (0.0%) | 0 (0.0%) |
| $50,000 to $74,999 | 3 (3.3%) | 0 (0.0%) |
| $75,000 to $99,999 | 11 (12.2%) | 0 (0.0%) |
| $100,000 to $149,999 | 11 (12.2%) | 0 (0.0%) |
| $150,000 or more | 0 (0.0%) | 0 (0.0%) |
| Total | 90 (100.0%) | 0 (0.0%) |
Property Value to Household Income Ratio in Phoenicia
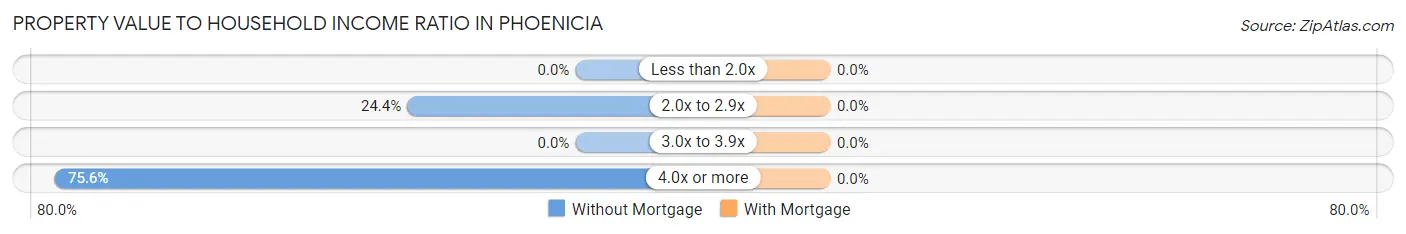
| Value-to-Income Ratio | Without Mortgage | With Mortgage |
| Less than 2.0x | 0 (0.0%) | 0 (0.0%) |
| 2.0x to 2.9x | 22 (24.4%) | 0 (0.0%) |
| 3.0x to 3.9x | 0 (0.0%) | 0 (0.0%) |
| 4.0x or more | 68 (75.6%) | 0 (0.0%) |
| Total | 90 (100.0%) | 0 (0.0%) |
Real Estate Taxes by Mortgage Status in Phoenicia
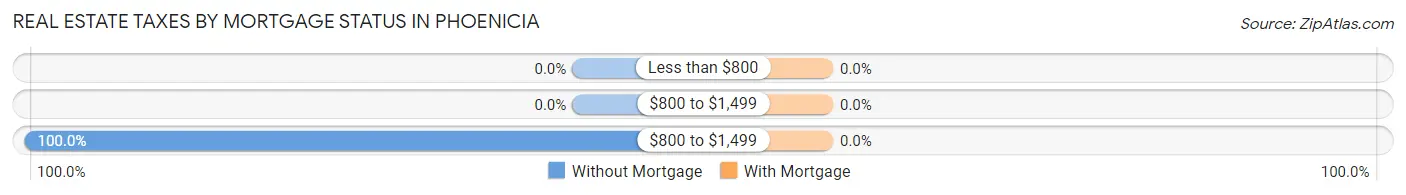
| Property Taxes | Without Mortgage | With Mortgage |
| Less than $800 | 0 (0.0%) | 0 (0.0%) |
| $800 to $1,499 | 0 (0.0%) | 0 (0.0%) |
| $800 to $1,499 | 90 (100.0%) | 0 (0.0%) |
| Total | 90 (100.0%) | 0 (0.0%) |
Health & Disability in Phoenicia
Health Insurance Coverage by Age in Phoenicia
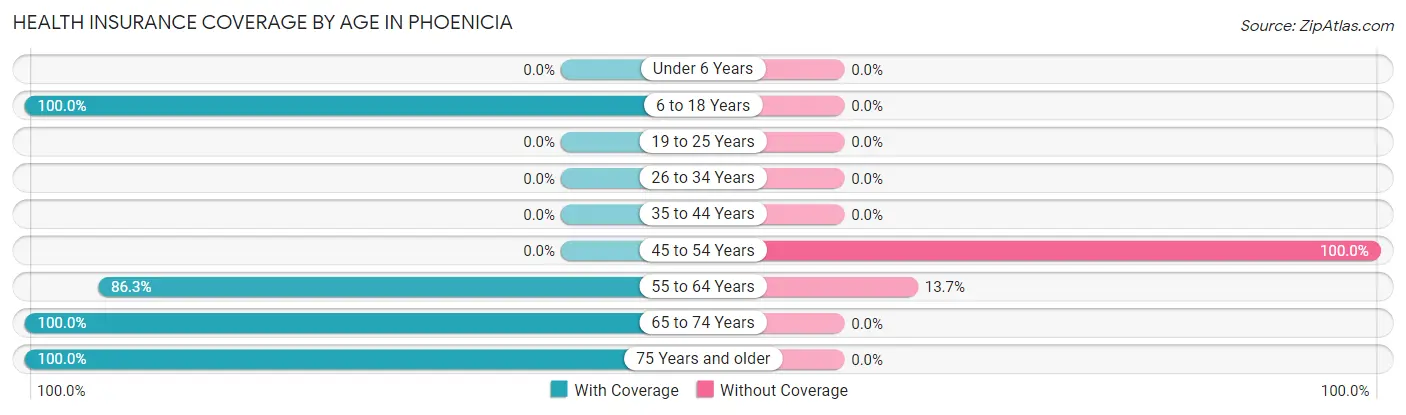
| Age Bracket | With Coverage | Without Coverage |
| Under 6 Years | 0 (0.0%) | 0 (0.0%) |
| 6 to 18 Years | 22 (100.0%) | 0 (0.0%) |
| 19 to 25 Years | 0 (0.0%) | 0 (0.0%) |
| 26 to 34 Years | 0 (0.0%) | 0 (0.0%) |
| 35 to 44 Years | 0 (0.0%) | 0 (0.0%) |
| 45 to 54 Years | 0 (0.0%) | 120 (100.0%) |
| 55 to 64 Years | 63 (86.3%) | 10 (13.7%) |
| 65 to 74 Years | 24 (100.0%) | 0 (0.0%) |
| 75 Years and older | 27 (100.0%) | 0 (0.0%) |
| Total | 136 (51.1%) | 130 (48.9%) |
Health Insurance Coverage by Citizenship Status in Phoenicia
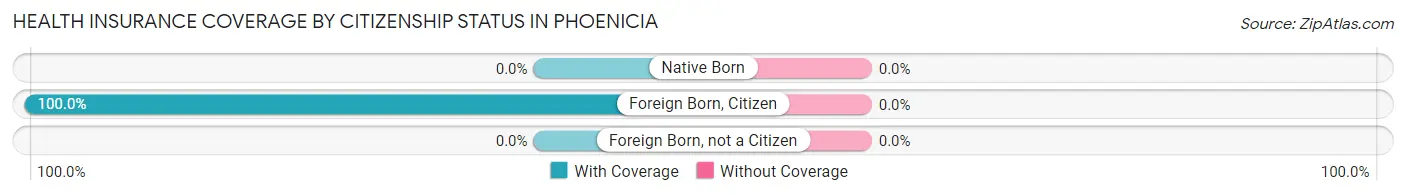
| Citizenship Status | With Coverage | Without Coverage |
| Native Born | 0 (0.0%) | 0 (0.0%) |
| Foreign Born, Citizen | 22 (100.0%) | 0 (0.0%) |
| Foreign Born, not a Citizen | 0 (0.0%) | 0 (0.0%) |
Health Insurance Coverage by Household Income in Phoenicia
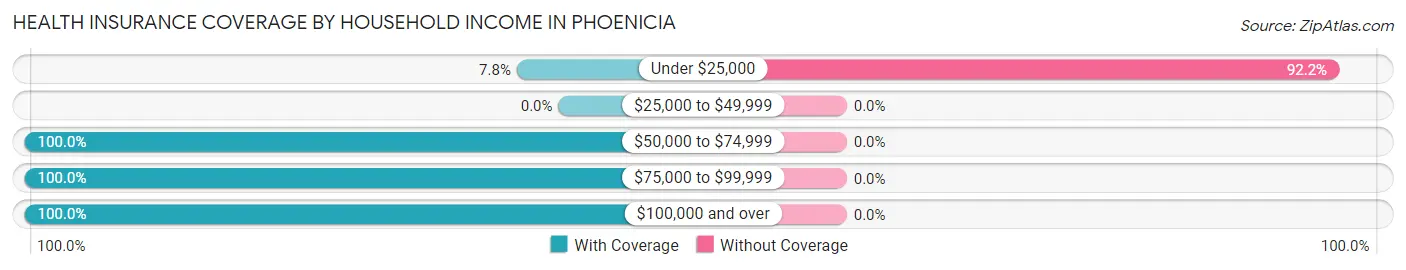
| Household Income | With Coverage | Without Coverage |
| Under $25,000 | 11 (7.8%) | 130 (92.2%) |
| $25,000 to $49,999 | 0 (0.0%) | 0 (0.0%) |
| $50,000 to $74,999 | 33 (100.0%) | 0 (0.0%) |
| $75,000 to $99,999 | 24 (100.0%) | 0 (0.0%) |
| $100,000 and over | 68 (100.0%) | 0 (0.0%) |
Public vs Private Health Insurance Coverage by Age in Phoenicia
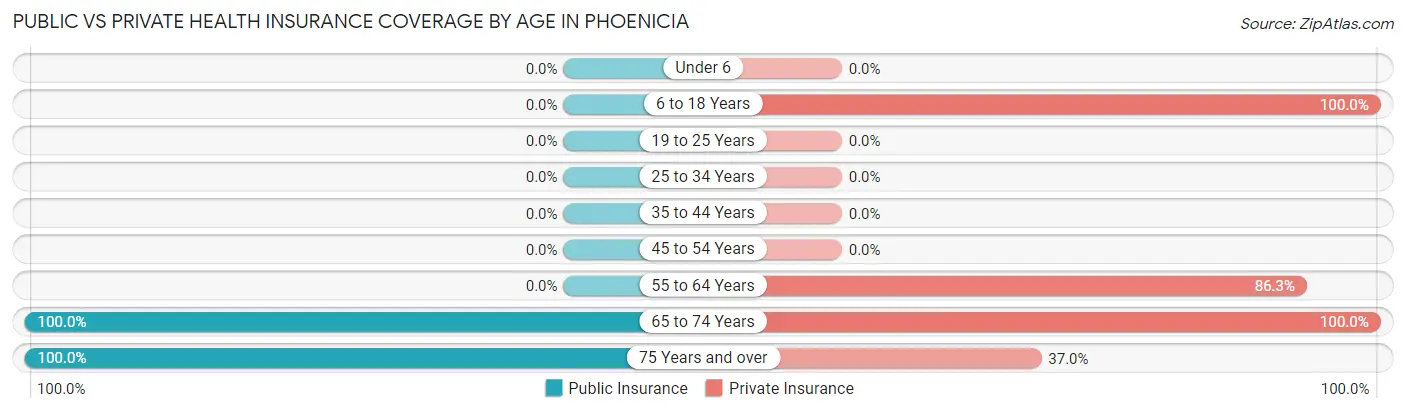
| Age Bracket | Public Insurance | Private Insurance |
| Under 6 | 0 (0.0%) | 0 (0.0%) |
| 6 to 18 Years | 0 (0.0%) | 22 (100.0%) |
| 19 to 25 Years | 0 (0.0%) | 0 (0.0%) |
| 25 to 34 Years | 0 (0.0%) | 0 (0.0%) |
| 35 to 44 Years | 0 (0.0%) | 0 (0.0%) |
| 45 to 54 Years | 0 (0.0%) | 0 (0.0%) |
| 55 to 64 Years | 0 (0.0%) | 63 (86.3%) |
| 65 to 74 Years | 24 (100.0%) | 24 (100.0%) |
| 75 Years and over | 27 (100.0%) | 10 (37.0%) |
| Total | 51 (19.2%) | 119 (44.7%) |
Disability Status by Sex by Age in Phoenicia
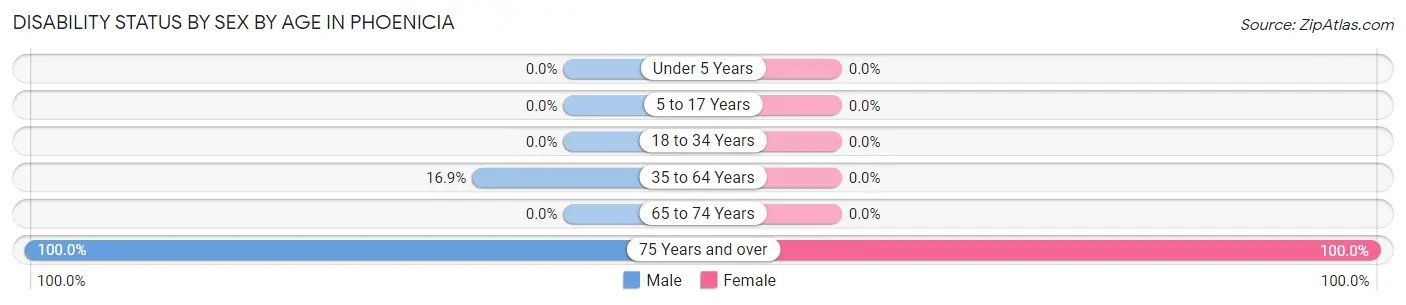
| Age Bracket | Male | Female |
| Under 5 Years | 0 (0.0%) | 0 (0.0%) |
| 5 to 17 Years | 0 (0.0%) | 0 (0.0%) |
| 18 to 34 Years | 0 (0.0%) | 0 (0.0%) |
| 35 to 64 Years | 21 (16.9%) | 0 (0.0%) |
| 65 to 74 Years | 0 (0.0%) | 0 (0.0%) |
| 75 Years and over | 10 (100.0%) | 17 (100.0%) |
Disability Class by Sex by Age in Phoenicia
Disability Class: Hearing Difficulty
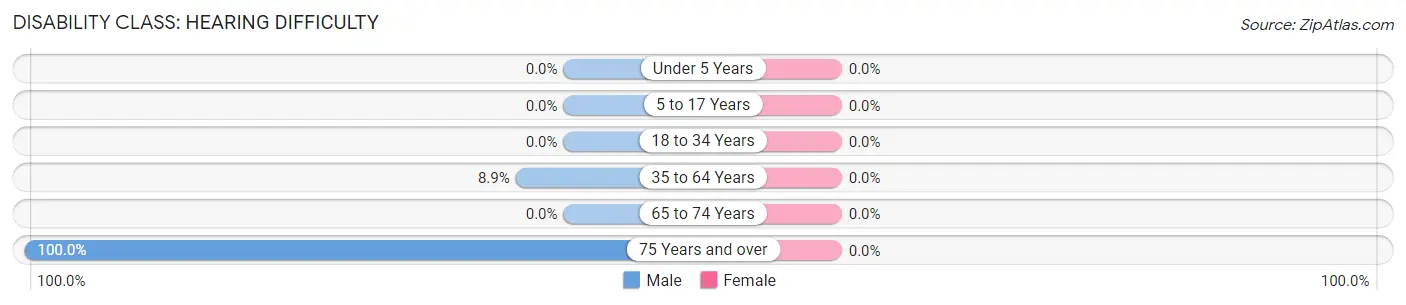
| Age Bracket | Male | Female |
| Under 5 Years | 0 (0.0%) | 0 (0.0%) |
| 5 to 17 Years | 0 (0.0%) | 0 (0.0%) |
| 18 to 34 Years | 0 (0.0%) | 0 (0.0%) |
| 35 to 64 Years | 11 (8.9%) | 0 (0.0%) |
| 65 to 74 Years | 0 (0.0%) | 0 (0.0%) |
| 75 Years and over | 10 (100.0%) | 0 (0.0%) |
Disability Class: Vision Difficulty
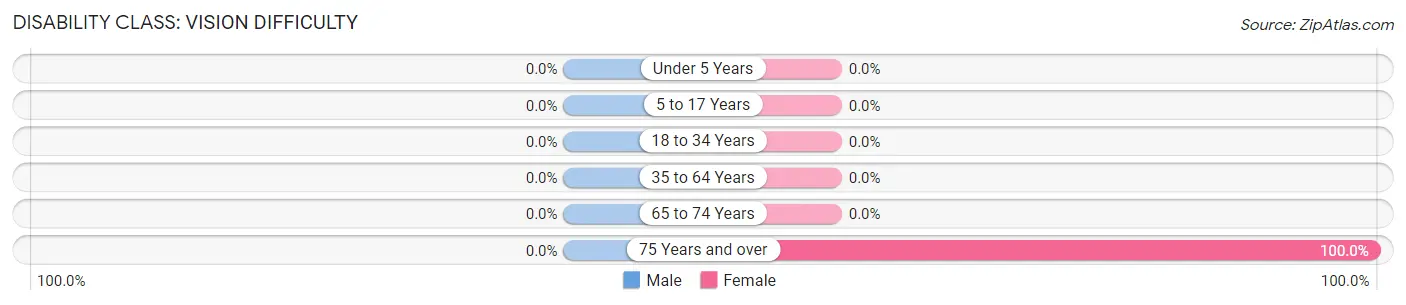
| Age Bracket | Male | Female |
| Under 5 Years | 0 (0.0%) | 0 (0.0%) |
| 5 to 17 Years | 0 (0.0%) | 0 (0.0%) |
| 18 to 34 Years | 0 (0.0%) | 0 (0.0%) |
| 35 to 64 Years | 0 (0.0%) | 0 (0.0%) |
| 65 to 74 Years | 0 (0.0%) | 0 (0.0%) |
| 75 Years and over | 0 (0.0%) | 17 (100.0%) |
Disability Class: Cognitive Difficulty
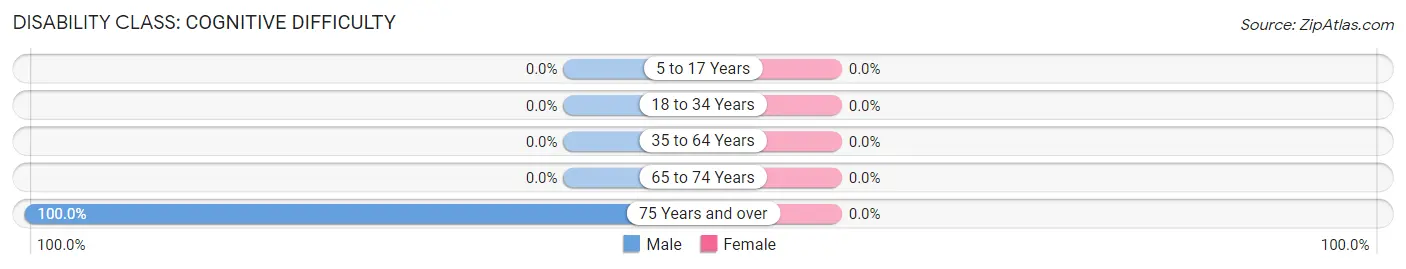
| Age Bracket | Male | Female |
| 5 to 17 Years | 0 (0.0%) | 0 (0.0%) |
| 18 to 34 Years | 0 (0.0%) | 0 (0.0%) |
| 35 to 64 Years | 0 (0.0%) | 0 (0.0%) |
| 65 to 74 Years | 0 (0.0%) | 0 (0.0%) |
| 75 Years and over | 10 (100.0%) | 0 (0.0%) |
Disability Class: Ambulatory Difficulty
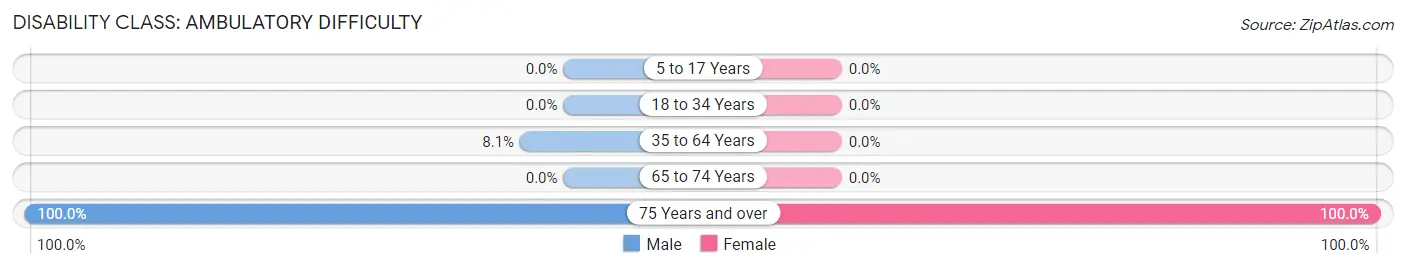
| Age Bracket | Male | Female |
| 5 to 17 Years | 0 (0.0%) | 0 (0.0%) |
| 18 to 34 Years | 0 (0.0%) | 0 (0.0%) |
| 35 to 64 Years | 10 (8.1%) | 0 (0.0%) |
| 65 to 74 Years | 0 (0.0%) | 0 (0.0%) |
| 75 Years and over | 10 (100.0%) | 17 (100.0%) |
Disability Class: Self-Care Difficulty
| Age Bracket | Male | Female |
| 5 to 17 Years | 0 (0.0%) | 0 (0.0%) |
| 18 to 34 Years | 0 (0.0%) | 0 (0.0%) |
| 35 to 64 Years | 0 (0.0%) | 0 (0.0%) |
| 65 to 74 Years | 0 (0.0%) | 0 (0.0%) |
| 75 Years and over | 0 (0.0%) | 0 (0.0%) |
Technology Access in Phoenicia
Computing Device Access in Phoenicia
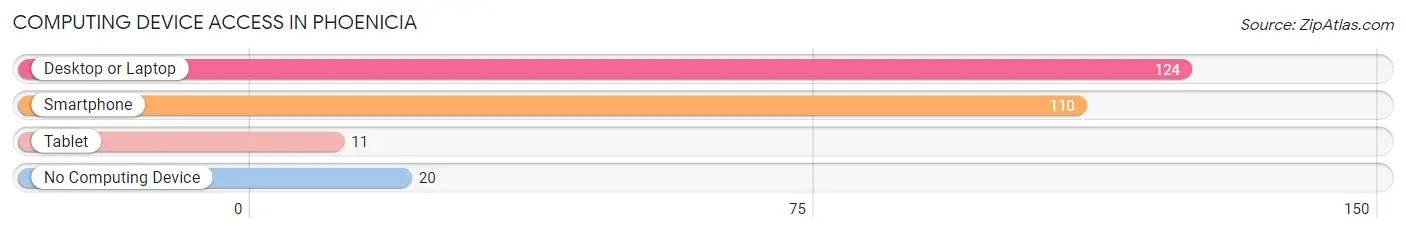
| Device Type | # Households | % Households |
| Desktop or Laptop | 124 | 86.1% |
| Smartphone | 110 | 76.4% |
| Tablet | 11 | 7.6% |
| No Computing Device | 20 | 13.9% |
| Total | 144 | 100.0% |
Internet Access in Phoenicia
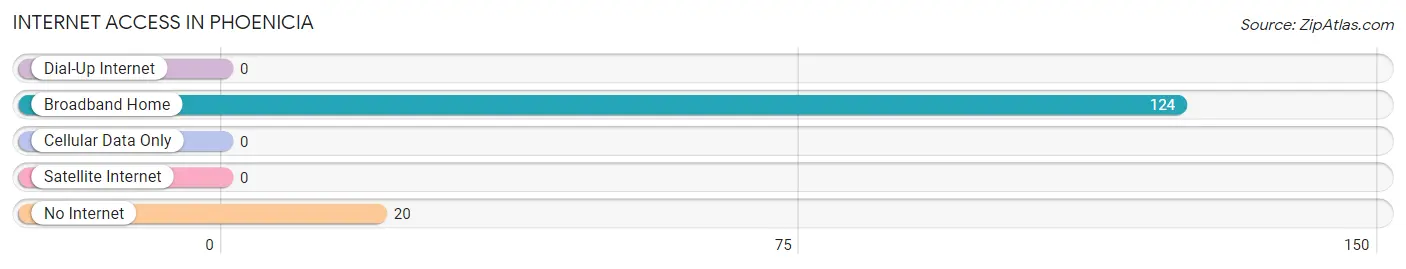
| Internet Type | # Households | % Households |
| Dial-Up Internet | 0 | 0.0% |
| Broadband Home | 124 | 86.1% |
| Cellular Data Only | 0 | 0.0% |
| Satellite Internet | 0 | 0.0% |
| No Internet | 20 | 13.9% |
| Total | 144 | 100.0% |
Phoenicia Summary
Phoenicia, New York is a small hamlet located in the Catskill Mountains of Ulster County, New York. It is situated in the Town of Shandaken, and is located along the Esopus Creek. The hamlet is known for its outdoor recreation opportunities, including fishing, camping, and hiking. It is also home to a variety of unique shops and restaurants.
History
The area that is now Phoenicia was originally inhabited by the Esopus Indians, who were part of the Lenape tribe. The first European settlers arrived in the area in the late 1700s, and the hamlet was officially established in 1836. The name Phoenicia is derived from the ancient Phoenician civilization, which was located in what is now Lebanon.
The hamlet was originally a logging and farming community, and the Esopus Creek was used to transport logs to the Hudson River. In the late 1800s, the area became a popular tourist destination, and several hotels and resorts were built. The Phoenicia Railroad was built in 1892 to transport tourists to the area.
Geography
Phoenicia is located in the Catskill Mountains of Ulster County, New York. It is situated in the Town of Shandaken, and is located along the Esopus Creek. The hamlet is surrounded by the Catskill Park, which is a protected area of the Catskill Mountains. The area is known for its scenic beauty, and is home to several hiking trails, waterfalls, and other outdoor recreation opportunities.
Economy
The economy of Phoenicia is largely based on tourism. The hamlet is home to several hotels and resorts, as well as a variety of unique shops and restaurants. The area is also known for its outdoor recreation opportunities, including fishing, camping, and hiking.
Demographics
As of the 2010 census, the population of Phoenicia was 545. The racial makeup of the hamlet was 94.2% White, 1.3% African American, 0.2% Native American, 0.7% Asian, 0.2% Pacific Islander, and 3.4% from other races. The median household income was $41,250, and the median family income was $50,000. The per capita income was $20,945.
Conclusion
Phoenicia, New York is a small hamlet located in the Catskill Mountains of Ulster County, New York. It is situated in the Town of Shandaken, and is located along the Esopus Creek. The hamlet is known for its outdoor recreation opportunities, including fishing, camping, and hiking. It is also home to a variety of unique shops and restaurants. The economy of Phoenicia is largely based on tourism, and the population of the hamlet was 545 as of the 2010 census.
Common Questions
What is Per Capita Income in Phoenicia?
Per Capita income in Phoenicia is $26,906.
What is Inequality or Gini Index in Phoenicia?
Inequality or Gini Index in Phoenicia is 0.53.
What is the Total Population of Phoenicia?
Total Population of Phoenicia is 266.
What is the Total Male Population of Phoenicia?
Total Male Population of Phoenicia is 167.
What is the Total Female Population of Phoenicia?
Total Female Population of Phoenicia is 99.
What is the Ratio of Males per 100 Females in Phoenicia?
There are 168.69 Males per 100 Females in Phoenicia.
What is the Ratio of Females per 100 Males in Phoenicia?
There are 59.28 Females per 100 Males in Phoenicia.
What is the Median Population Age in Phoenicia?
Median Population Age in Phoenicia is 54.8 Years.
What is the Average Family Size in Phoenicia
Average Family Size in Phoenicia is 2.2 People.
What is the Average Household Size in Phoenicia
Average Household Size in Phoenicia is 1.9 People.
How Large is the Labor Force in Phoenicia?
There are 142 People in the Labor Forcein in Phoenicia.
What is the Percentage of People in the Labor Force in Phoenicia?
53.4% of People are in the Labor Force in Phoenicia.