Zip Codes with the Highest Percentage of Population Employed in Food Preparation & Serving in Schenectady, NY
RELATED REPORTS & OPTIONS
Food Preparation & Serving
Schenectady
Compare Zip Codes
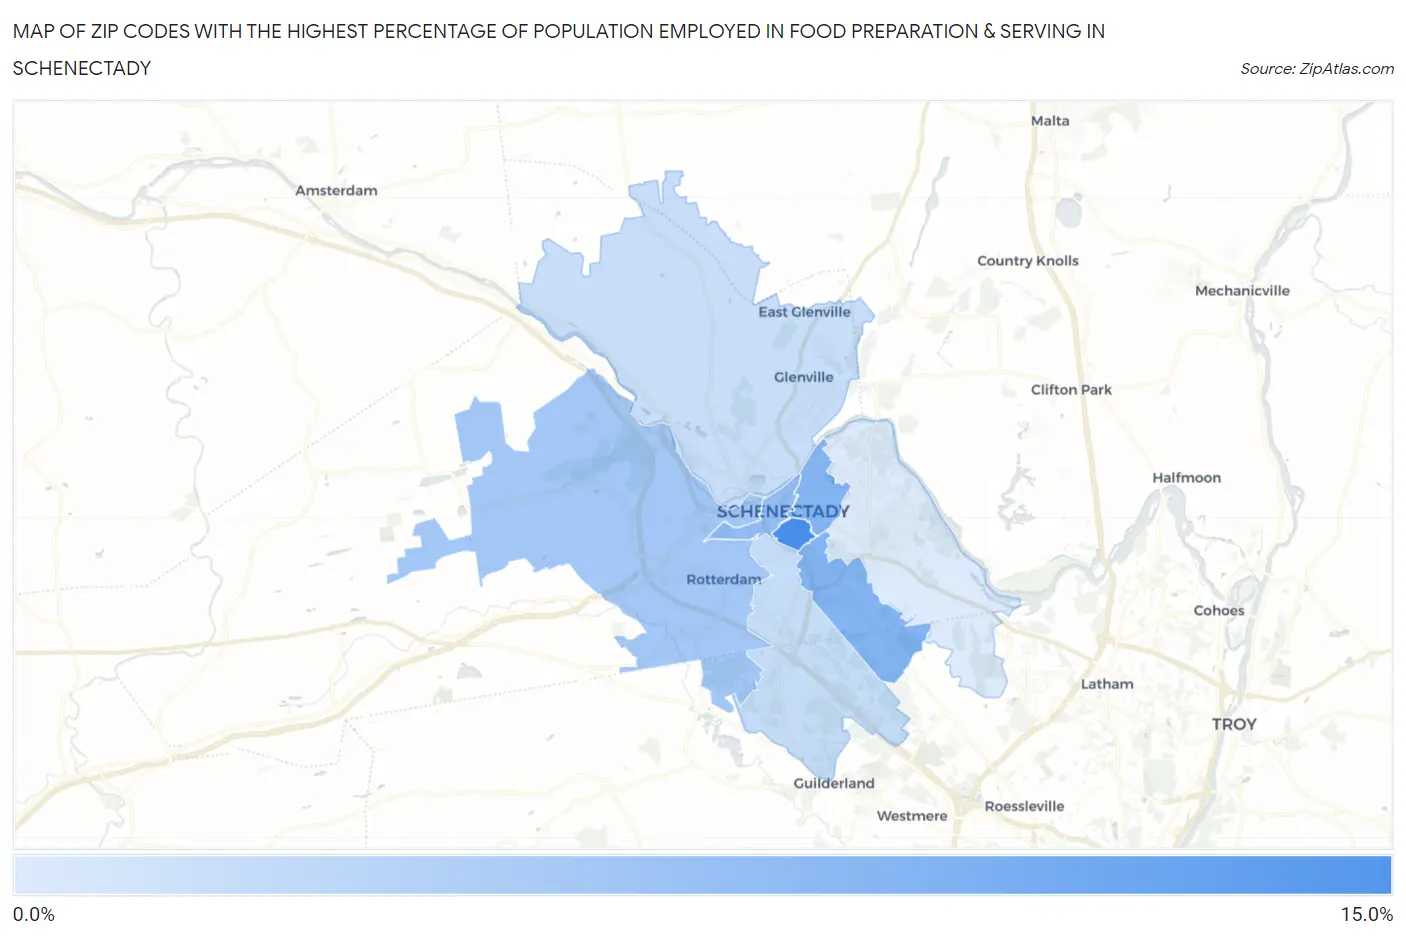
Map of Zip Codes with the Highest Percentage of Population Employed in Food Preparation & Serving in Schenectady
1.2%
11.7%
Zip Codes with the Highest Percentage of Population Employed in Food Preparation & Serving in Schenectady, NY
| Zip Code | % Employed | vs State | vs National | |
| 1. | 12307 | 11.7% | 4.8%(+6.89)#99 | 5.3%(+6.42)#1,770 |
| 2. | 12308 | 7.4% | 4.8%(+2.61)#286 | 5.3%(+2.14)#5,696 |
| 3. | 12304 | 7.4% | 4.8%(+2.55)#293 | 5.3%(+2.08)#5,820 |
| 4. | 12305 | 6.3% | 4.8%(+1.47)#421 | 5.3%(+0.998)#8,479 |
| 5. | 12306 | 5.0% | 4.8%(+0.230)#609 | 5.3%(-0.240)#12,758 |
| 6. | 12303 | 2.8% | 4.8%(-2.01)#1,156 | 5.3%(-2.48)#22,049 |
| 7. | 12302 | 2.6% | 4.8%(-2.25)#1,204 | 5.3%(-2.72)#22,901 |
| 8. | 12309 | 1.2% | 4.8%(-3.63)#1,433 | 5.3%(-4.10)#26,630 |
1
Common Questions
What are the Top 5 Zip Codes with the Highest Percentage of Population Employed in Food Preparation & Serving in Schenectady, NY?
Top 5 Zip Codes with the Highest Percentage of Population Employed in Food Preparation & Serving in Schenectady, NY are:
What zip code has the Highest Percentage of Population Employed in Food Preparation & Serving in Schenectady, NY?
12307 has the Highest Percentage of Population Employed in Food Preparation & Serving in Schenectady, NY with 11.7%.
What is the Percentage of Population Employed in Food Preparation & Serving in Schenectady, NY?
Percentage of Population Employed in Food Preparation & Serving in Schenectady is 6.4%.
What is the Percentage of Population Employed in Food Preparation & Serving in New York?
Percentage of Population Employed in Food Preparation & Serving in New York is 4.8%.
What is the Percentage of Population Employed in Food Preparation & Serving in the United States?
Percentage of Population Employed in Food Preparation & Serving in the United States is 5.3%.