Cities with the Largest Indian (Asian) Community in New York
RELATED REPORTS & OPTIONS
Indian (Asian)
New York
Compare Cities
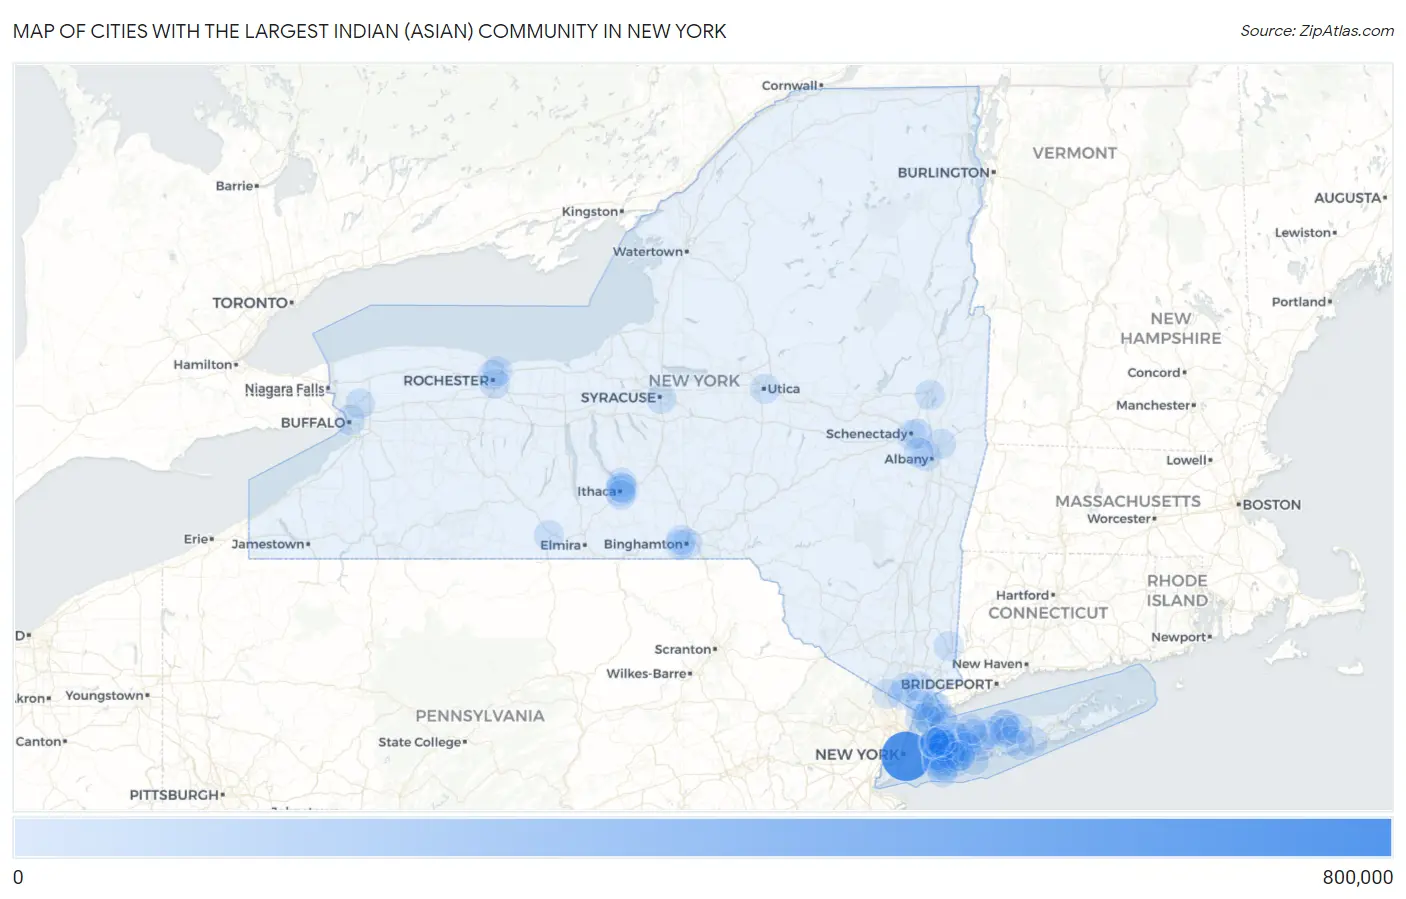
Map of Cities with the Largest Indian (Asian) Community in New York
0
800,000
Cities with the Largest Indian (Asian) Community in New York
| City | Indian (Asian) | vs State | vs National | |
| 1. | New York | 627,035 | 780,450(80.34%)#1 | 5,326,595(11.77%)#1 |
| 2. | Syracuse | 3,557 | 780,450(0.46%)#2 | 5,326,595(0.07%)#185 |
| 3. | Jericho | 3,540 | 780,450(0.45%)#3 | 5,326,595(0.07%)#188 |
| 4. | Ithaca | 3,010 | 780,450(0.39%)#4 | 5,326,595(0.06%)#225 |
| 5. | Syosset | 2,755 | 780,450(0.35%)#5 | 5,326,595(0.05%)#254 |
| 6. | Stony Brook University | 2,183 | 780,450(0.28%)#6 | 5,326,595(0.04%)#327 |
| 7. | Hicksville | 2,129 | 780,450(0.27%)#7 | 5,326,595(0.04%)#335 |
| 8. | Plainview | 2,034 | 780,450(0.26%)#8 | 5,326,595(0.04%)#344 |
| 9. | North New Hyde Park | 1,986 | 780,450(0.25%)#9 | 5,326,595(0.04%)#352 |
| 10. | Rochester | 1,982 | 780,450(0.25%)#10 | 5,326,595(0.04%)#354 |
| 11. | Buffalo | 1,705 | 780,450(0.22%)#11 | 5,326,595(0.03%)#406 |
| 12. | Scarsdale | 1,655 | 780,450(0.21%)#12 | 5,326,595(0.03%)#415 |
| 13. | Levittown | 1,518 | 780,450(0.19%)#13 | 5,326,595(0.03%)#444 |
| 14. | White Plains | 1,496 | 780,450(0.19%)#14 | 5,326,595(0.03%)#448 |
| 15. | Valley Stream | 1,418 | 780,450(0.18%)#15 | 5,326,595(0.03%)#475 |
| 16. | Albany | 1,412 | 780,450(0.18%)#16 | 5,326,595(0.03%)#479 |
| 17. | Stony Brook | 1,279 | 780,450(0.16%)#17 | 5,326,595(0.02%)#530 |
| 18. | Mineola | 1,254 | 780,450(0.16%)#18 | 5,326,595(0.02%)#540 |
| 19. | Port Washington | 1,240 | 780,450(0.16%)#19 | 5,326,595(0.02%)#546 |
| 20. | Yonkers | 1,237 | 780,450(0.16%)#20 | 5,326,595(0.02%)#548 |
| 21. | Lake Success | 1,151 | 780,450(0.15%)#21 | 5,326,595(0.02%)#575 |
| 22. | Garden City Park | 1,133 | 780,450(0.15%)#22 | 5,326,595(0.02%)#587 |
| 23. | East Meadow | 1,085 | 780,450(0.14%)#23 | 5,326,595(0.02%)#610 |
| 24. | Troy | 1,057 | 780,450(0.14%)#24 | 5,326,595(0.02%)#625 |
| 25. | New Hyde Park | 1,028 | 780,450(0.13%)#25 | 5,326,595(0.02%)#637 |
| 26. | Dix Hills | 1,010 | 780,450(0.13%)#26 | 5,326,595(0.02%)#645 |
| 27. | Floral Park | 977 | 780,450(0.13%)#27 | 5,326,595(0.02%)#660 |
| 28. | University Gardens | 963 | 780,450(0.12%)#28 | 5,326,595(0.02%)#665 |
| 29. | Manhasset | 906 | 780,450(0.12%)#29 | 5,326,595(0.02%)#691 |
| 30. | Great Neck | 878 | 780,450(0.11%)#30 | 5,326,595(0.02%)#704 |
| 31. | Deer Park | 868 | 780,450(0.11%)#31 | 5,326,595(0.02%)#707 |
| 32. | Brighton | 867 | 780,450(0.11%)#32 | 5,326,595(0.02%)#708 |
| 33. | Franklin Square | 858 | 780,450(0.11%)#33 | 5,326,595(0.02%)#715 |
| 34. | Centereach | 858 | 780,450(0.11%)#34 | 5,326,595(0.02%)#716 |
| 35. | New Rochelle | 844 | 780,450(0.11%)#35 | 5,326,595(0.02%)#723 |
| 36. | Glen Cove | 712 | 780,450(0.09%)#36 | 5,326,595(0.01%)#810 |
| 37. | Rockville Centre | 711 | 780,450(0.09%)#37 | 5,326,595(0.01%)#813 |
| 38. | Binghamton | 708 | 780,450(0.09%)#38 | 5,326,595(0.01%)#815 |
| 39. | Thomaston | 701 | 780,450(0.09%)#39 | 5,326,595(0.01%)#824 |
| 40. | Herricks | 699 | 780,450(0.09%)#40 | 5,326,595(0.01%)#827 |
| 41. | Garden City | 685 | 780,450(0.09%)#41 | 5,326,595(0.01%)#837 |
| 42. | Greenville Cdp Westchester County | 646 | 780,450(0.08%)#42 | 5,326,595(0.01%)#877 |
| 43. | Roslyn Heights | 629 | 780,450(0.08%)#43 | 5,326,595(0.01%)#897 |
| 44. | North Hills | 629 | 780,450(0.08%)#44 | 5,326,595(0.01%)#898 |
| 45. | Searingtown | 627 | 780,450(0.08%)#45 | 5,326,595(0.01%)#901 |
| 46. | Lansing | 619 | 780,450(0.08%)#46 | 5,326,595(0.01%)#913 |
| 47. | Great Neck Plaza | 607 | 780,450(0.08%)#47 | 5,326,595(0.01%)#932 |
| 48. | Eastchester | 600 | 780,450(0.08%)#48 | 5,326,595(0.01%)#949 |
| 49. | Utica | 590 | 780,450(0.08%)#49 | 5,326,595(0.01%)#968 |
| 50. | Williston Park | 581 | 780,450(0.07%)#50 | 5,326,595(0.01%)#980 |
| 51. | Smithtown | 557 | 780,450(0.07%)#51 | 5,326,595(0.01%)#1,003 |
| 52. | Saratoga Springs | 553 | 780,450(0.07%)#52 | 5,326,595(0.01%)#1,008 |
| 53. | Manhasset Hills | 539 | 780,450(0.07%)#53 | 5,326,595(0.01%)#1,036 |
| 54. | Nanuet | 536 | 780,450(0.07%)#54 | 5,326,595(0.01%)#1,041 |
| 55. | Holbrook | 524 | 780,450(0.07%)#55 | 5,326,595(0.01%)#1,065 |
| 56. | Commack | 508 | 780,450(0.07%)#56 | 5,326,595(0.01%)#1,088 |
| 57. | Merrick | 504 | 780,450(0.06%)#57 | 5,326,595(0.01%)#1,097 |
| 58. | Hewlett | 497 | 780,450(0.06%)#58 | 5,326,595(0.01%)#1,112 |
| 59. | Gang Mills | 483 | 780,450(0.06%)#59 | 5,326,595(0.01%)#1,140 |
| 60. | Salisbury | 481 | 780,450(0.06%)#60 | 5,326,595(0.01%)#1,142 |
| 61. | Elmont | 467 | 780,450(0.06%)#61 | 5,326,595(0.01%)#1,165 |
| 62. | North Valley Stream | 466 | 780,450(0.06%)#62 | 5,326,595(0.01%)#1,167 |
| 63. | University At Buffalo | 463 | 780,450(0.06%)#63 | 5,326,595(0.01%)#1,174 |
| 64. | Schenectady | 454 | 780,450(0.06%)#64 | 5,326,595(0.01%)#1,187 |
| 65. | Latham | 447 | 780,450(0.06%)#65 | 5,326,595(0.01%)#1,208 |
| 66. | Muttontown | 443 | 780,450(0.06%)#66 | 5,326,595(0.01%)#1,216 |
| 67. | Huntington Station | 441 | 780,450(0.06%)#67 | 5,326,595(0.01%)#1,220 |
| 68. | Harrison | 438 | 780,450(0.06%)#68 | 5,326,595(0.01%)#1,223 |
| 69. | East Patchogue | 436 | 780,450(0.06%)#69 | 5,326,595(0.01%)#1,225 |
| 70. | Forest Home | 425 | 780,450(0.05%)#70 | 5,326,595(0.01%)#1,245 |
| 71. | North Bellmore | 420 | 780,450(0.05%)#71 | 5,326,595(0.01%)#1,257 |
| 72. | Niskayuna | 420 | 780,450(0.05%)#72 | 5,326,595(0.01%)#1,258 |
| 73. | Uniondale | 415 | 780,450(0.05%)#73 | 5,326,595(0.01%)#1,270 |
| 74. | Westmere | 413 | 780,450(0.05%)#74 | 5,326,595(0.01%)#1,276 |
| 75. | Ossining | 407 | 780,450(0.05%)#75 | 5,326,595(0.01%)#1,287 |
| 76. | Russell Gardens | 406 | 780,450(0.05%)#76 | 5,326,595(0.01%)#1,292 |
| 77. | Oceanside | 403 | 780,450(0.05%)#77 | 5,326,595(0.01%)#1,300 |
| 78. | East Setauket | 398 | 780,450(0.05%)#78 | 5,326,595(0.01%)#1,310 |
| 79. | Rye | 393 | 780,450(0.05%)#79 | 5,326,595(0.01%)#1,320 |
| 80. | Brewster Hill | 390 | 780,450(0.05%)#80 | 5,326,595(0.01%)#1,334 |
| 81. | Old Bethpage | 388 | 780,450(0.05%)#81 | 5,326,595(0.01%)#1,340 |
| 82. | Albertson | 388 | 780,450(0.05%)#82 | 5,326,595(0.01%)#1,341 |
| 83. | Lake Grove | 385 | 780,450(0.05%)#83 | 5,326,595(0.01%)#1,351 |
| 84. | Coram | 382 | 780,450(0.05%)#84 | 5,326,595(0.01%)#1,357 |
| 85. | Binghamton University | 382 | 780,450(0.05%)#85 | 5,326,595(0.01%)#1,359 |
| 86. | Flower Hill | 382 | 780,450(0.05%)#86 | 5,326,595(0.01%)#1,360 |
| 87. | Great Neck Estates | 376 | 780,450(0.05%)#87 | 5,326,595(0.01%)#1,375 |
| 88. | South Hill | 365 | 780,450(0.05%)#88 | 5,326,595(0.01%)#1,414 |
| 89. | New City | 360 | 780,450(0.05%)#89 | 5,326,595(0.01%)#1,429 |
| 90. | Johnson City | 355 | 780,450(0.05%)#90 | 5,326,595(0.01%)#1,442 |
| 91. | Suffern | 353 | 780,450(0.05%)#91 | 5,326,595(0.01%)#1,448 |
| 92. | Irvington | 344 | 780,450(0.04%)#92 | 5,326,595(0.01%)#1,466 |
| 93. | Munsey Park | 343 | 780,450(0.04%)#93 | 5,326,595(0.01%)#1,469 |
| 94. | Shirley | 342 | 780,450(0.04%)#94 | 5,326,595(0.01%)#1,472 |
| 95. | Cayuga Heights | 339 | 780,450(0.04%)#95 | 5,326,595(0.01%)#1,488 |
| 96. | Copiague | 335 | 780,450(0.04%)#96 | 5,326,595(0.01%)#1,499 |
| 97. | Huntington | 330 | 780,450(0.04%)#97 | 5,326,595(0.01%)#1,510 |
| 98. | Irondequoit | 328 | 780,450(0.04%)#98 | 5,326,595(0.01%)#1,515 |
| 99. | North Wantagh | 327 | 780,450(0.04%)#99 | 5,326,595(0.01%)#1,523 |
| 100. | Long Beach | 324 | 780,450(0.04%)#100 | 5,326,595(0.01%)#1,533 |
Common Questions
What are the Top 10 Cities with the Largest Indian (Asian) Community in New York?
Top 10 Cities with the Largest Indian (Asian) Community in New York are:
#1
627,035
#2
3,557
#3
3,540
#4
3,010
#5
2,755
#6
2,183
#7
2,129
#8
2,034
#9
1,986
#10
1,982
What city has the Largest Indian (Asian) Community in New York?
New York has the Largest Indian (Asian) Community in New York with 627,035.
What is the Total Indian (Asian) Population in the State of New York?
Total Indian (Asian) Population in New York is 780,450.
What is the Total Indian (Asian) Population in the United States?
Total Indian (Asian) Population in the United States is 5,326,595.