Cities with the Highest Percentage of Celtic Population in New York
RELATED REPORTS & OPTIONS
Celtic
New York
Compare Cities
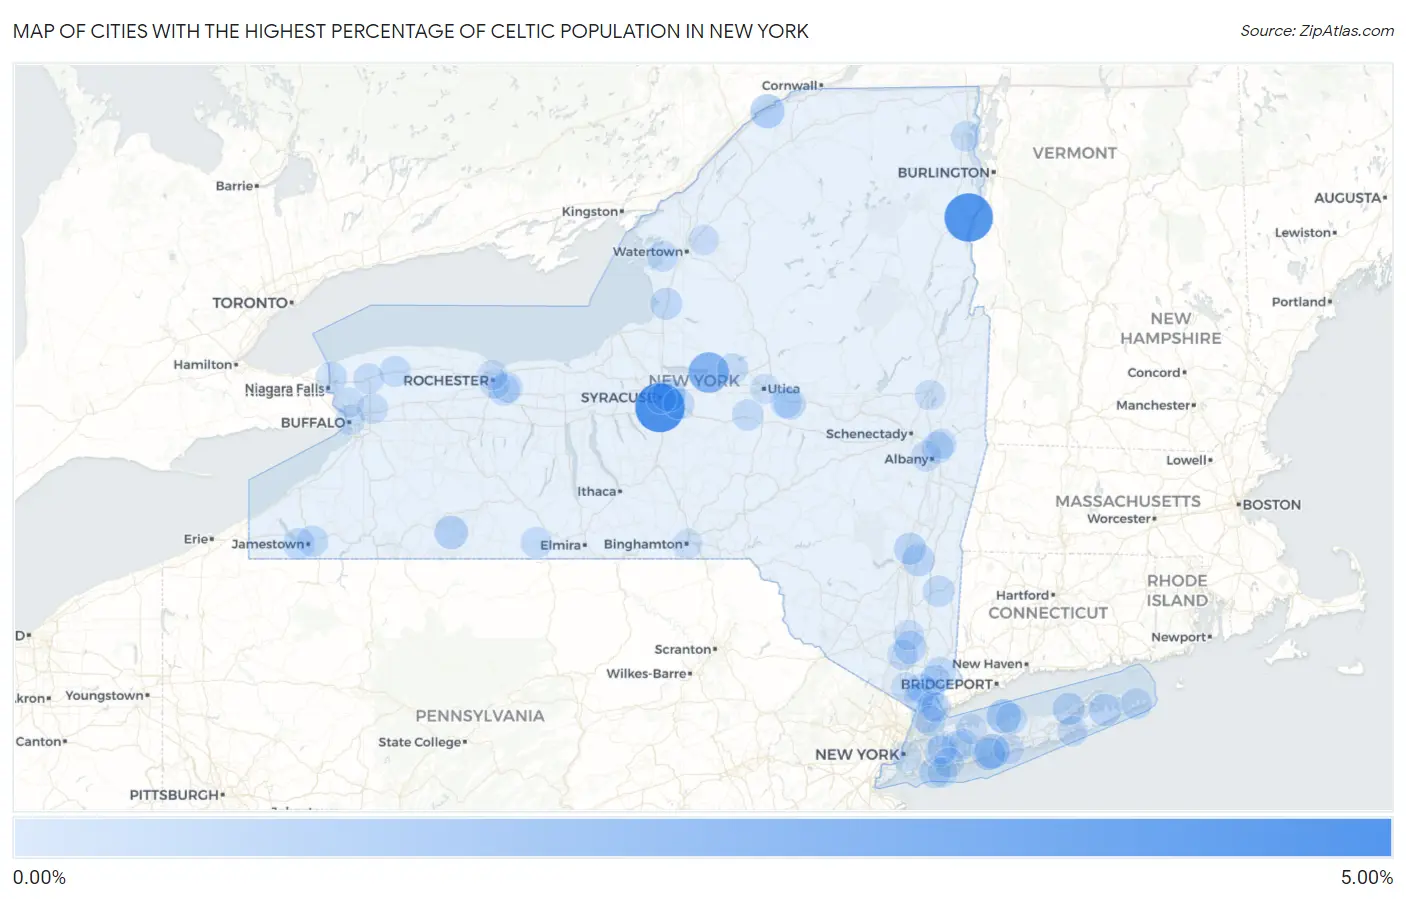
Map of Cities with the Highest Percentage of Celtic Population in New York
0.00%
5.00%
Cities with the Highest Percentage of Celtic Population in New York
| City | Celtic | vs State | vs National | |
| 1. | Nedrow | 4.22% | 0.012%(+4.21)#1 | 0.015%(+4.21)#15 |
| 2. | Westport | 3.98% | 0.012%(+3.97)#2 | 0.015%(+3.97)#18 |
| 3. | Sylvan Beach | 2.22% | 0.012%(+2.21)#3 | 0.015%(+2.20)#40 |
| 4. | Islip | 0.93% | 0.012%(+0.920)#4 | 0.015%(+0.917)#102 |
| 5. | Old Field | 0.88% | 0.012%(+0.871)#5 | 0.015%(+0.868)#108 |
| 6. | Waddington | 0.85% | 0.012%(+0.837)#6 | 0.015%(+0.834)#112 |
| 7. | East Syracuse | 0.69% | 0.012%(+0.673)#7 | 0.015%(+0.671)#149 |
| 8. | Scio | 0.68% | 0.012%(+0.667)#8 | 0.015%(+0.664)#153 |
| 9. | Brightwaters | 0.60% | 0.012%(+0.585)#9 | 0.015%(+0.583)#172 |
| 10. | Red Hook | 0.50% | 0.012%(+0.484)#10 | 0.015%(+0.481)#214 |
| 11. | Cold Spring | 0.49% | 0.012%(+0.476)#11 | 0.015%(+0.473)#217 |
| 12. | Northwest Harbor | 0.48% | 0.012%(+0.470)#12 | 0.015%(+0.467)#219 |
| 13. | Saugerties South | 0.45% | 0.012%(+0.438)#13 | 0.015%(+0.435)#235 |
| 14. | Mattituck | 0.44% | 0.012%(+0.426)#14 | 0.015%(+0.423)#239 |
| 15. | Sandy Creek | 0.35% | 0.012%(+0.341)#15 | 0.015%(+0.338)#284 |
| 16. | Watervliet | 0.34% | 0.012%(+0.327)#16 | 0.015%(+0.324)#289 |
| 17. | Katonah | 0.32% | 0.012%(+0.305)#17 | 0.015%(+0.302)#302 |
| 18. | Lewiston | 0.31% | 0.012%(+0.303)#18 | 0.015%(+0.300)#307 |
| 19. | Mohawk | 0.31% | 0.012%(+0.299)#19 | 0.015%(+0.296)#310 |
| 20. | Atlantic Beach | 0.30% | 0.012%(+0.291)#20 | 0.015%(+0.288)#315 |
| 21. | Lakewood | 0.30% | 0.012%(+0.290)#21 | 0.015%(+0.287)#316 |
| 22. | Millbrook | 0.29% | 0.012%(+0.278)#22 | 0.015%(+0.275)#330 |
| 23. | Falconer | 0.27% | 0.012%(+0.262)#23 | 0.015%(+0.259)#348 |
| 24. | Hicksville | 0.27% | 0.012%(+0.260)#24 | 0.015%(+0.258)#353 |
| 25. | New Hyde Park | 0.26% | 0.012%(+0.252)#25 | 0.015%(+0.249)#365 |
| 26. | Pittsford | 0.24% | 0.012%(+0.232)#26 | 0.015%(+0.229)#392 |
| 27. | Montauk | 0.23% | 0.012%(+0.220)#27 | 0.015%(+0.217)#413 |
| 28. | Waterville | 0.23% | 0.012%(+0.217)#28 | 0.015%(+0.214)#415 |
| 29. | Addison | 0.22% | 0.012%(+0.205)#29 | 0.015%(+0.203)#439 |
| 30. | Port Jefferson | 0.21% | 0.012%(+0.201)#30 | 0.015%(+0.198)#448 |
| 31. | Ilion | 0.21% | 0.012%(+0.196)#31 | 0.015%(+0.193)#455 |
| 32. | Thornwood | 0.20% | 0.012%(+0.193)#32 | 0.015%(+0.190)#465 |
| 33. | Middleport | 0.20% | 0.012%(+0.191)#33 | 0.015%(+0.188)#472 |
| 34. | Sackets Harbor | 0.20% | 0.012%(+0.184)#34 | 0.015%(+0.181)#480 |
| 35. | Rome | 0.19% | 0.012%(+0.182)#35 | 0.015%(+0.179)#487 |
| 36. | Manlius | 0.19% | 0.012%(+0.181)#36 | 0.015%(+0.178)#489 |
| 37. | Briarcliff Manor | 0.14% | 0.012%(+0.123)#37 | 0.015%(+0.121)#601 |
| 38. | Harris Hill | 0.13% | 0.012%(+0.119)#38 | 0.015%(+0.116)#611 |
| 39. | East Rochester | 0.13% | 0.012%(+0.115)#39 | 0.015%(+0.112)#628 |
| 40. | West Point | 0.13% | 0.012%(+0.113)#40 | 0.015%(+0.111)#632 |
| 41. | Plattsburgh | 0.12% | 0.012%(+0.104)#41 | 0.015%(+0.101)#670 |
| 42. | Lockport | 0.12% | 0.012%(+0.104)#42 | 0.015%(+0.101)#671 |
| 43. | Sayville | 0.11% | 0.012%(+0.093)#43 | 0.015%(+0.091)#706 |
| 44. | Garden City Park | 0.10% | 0.012%(+0.091)#44 | 0.015%(+0.088)#710 |
| 45. | Roessleville | 0.095% | 0.012%(+0.083)#45 | 0.015%(+0.080)#728 |
| 46. | Albany | 0.094% | 0.012%(+0.082)#46 | 0.015%(+0.080)#732 |
| 47. | Mount Kisco | 0.092% | 0.012%(+0.080)#47 | 0.015%(+0.078)#738 |
| 48. | Fort Drum | 0.074% | 0.012%(+0.062)#48 | 0.015%(+0.059)#817 |
| 49. | Beacon | 0.072% | 0.012%(+0.060)#49 | 0.015%(+0.057)#826 |
| 50. | Hampton Bays | 0.071% | 0.012%(+0.059)#50 | 0.015%(+0.056)#833 |
| 51. | Saratoga Springs | 0.060% | 0.012%(+0.048)#51 | 0.015%(+0.045)#886 |
| 52. | New City | 0.047% | 0.012%(+0.035)#52 | 0.015%(+0.033)#948 |
| 53. | Eastchester | 0.044% | 0.012%(+0.032)#53 | 0.015%(+0.029)#970 |
| 54. | Troy | 0.041% | 0.012%(+0.029)#54 | 0.015%(+0.026)#990 |
| 55. | Brighton | 0.038% | 0.012%(+0.026)#55 | 0.015%(+0.023)#1,014 |
| 56. | Buffalo | 0.032% | 0.012%(+0.020)#56 | 0.015%(+0.017)#1,074 |
| 57. | Huntington | 0.031% | 0.012%(+0.019)#57 | 0.015%(+0.016)#1,089 |
| 58. | Rochester | 0.030% | 0.012%(+0.019)#58 | 0.015%(+0.016)#1,091 |
| 59. | Plainview | 0.030% | 0.012%(+0.018)#59 | 0.015%(+0.015)#1,094 |
| 60. | Baldwin | 0.027% | 0.012%(+0.015)#60 | 0.015%(+0.012)#1,132 |
| 61. | Binghamton | 0.025% | 0.012%(+0.013)#61 | 0.015%(+0.011)#1,148 |
| 62. | Tonawanda | 0.023% | 0.012%(+0.011)#62 | 0.015%(+0.008)#1,177 |
| 63. | Long Beach | 0.020% | 0.012%(+0.008)#63 | 0.015%(+0.006)#1,205 |
| 64. | Sleepy Hollow | 0.019% | 0.012%(+0.007)#64 | 0.015%(+0.005)#1,218 |
| 65. | White Plains | 0.017% | 0.012%(+0.005)#65 | 0.015%(+0.002)#1,243 |
| 66. | New Rochelle | 0.012% | 0.012%(+0.001)#66 | 0.015%(-0.002)#1,315 |
| 67. | Syracuse | 0.012% | 0.012%(+0.001)#67 | 0.015%(-0.002)#1,317 |
| 68. | Utica | 0.0077% | 0.012%(-0.004)#68 | 0.015%(-0.007)#1,383 |
| 69. | Harrison | 0.0070% | 0.012%(-0.005)#69 | 0.015%(-0.008)#1,397 |
| 70. | New York | 0.0041% | 0.012%(-0.008)#70 | 0.015%(-0.010)#1,445 |
Common Questions
What are the Top 10 Cities with the Highest Percentage of Celtic Population in New York?
Top 10 Cities with the Highest Percentage of Celtic Population in New York are:
#1
4.22%
#2
3.98%
#3
2.22%
#4
0.93%
#5
0.88%
#6
0.85%
#7
0.69%
#8
0.68%
#9
0.60%
#10
0.50%
What city has the Highest Percentage of Celtic Population in New York?
Nedrow has the Highest Percentage of Celtic Population in New York with 4.22%.
What is the Percentage of Celtic Population in the State of New York?
Percentage of Celtic Population in New York is 0.012%.
What is the Percentage of Celtic Population in the United States?
Percentage of Celtic Population in the United States is 0.015%.