Cities with the Highest Percentage of Barbadian Population in New York
RELATED REPORTS & OPTIONS
Barbadian
New York
Compare Cities
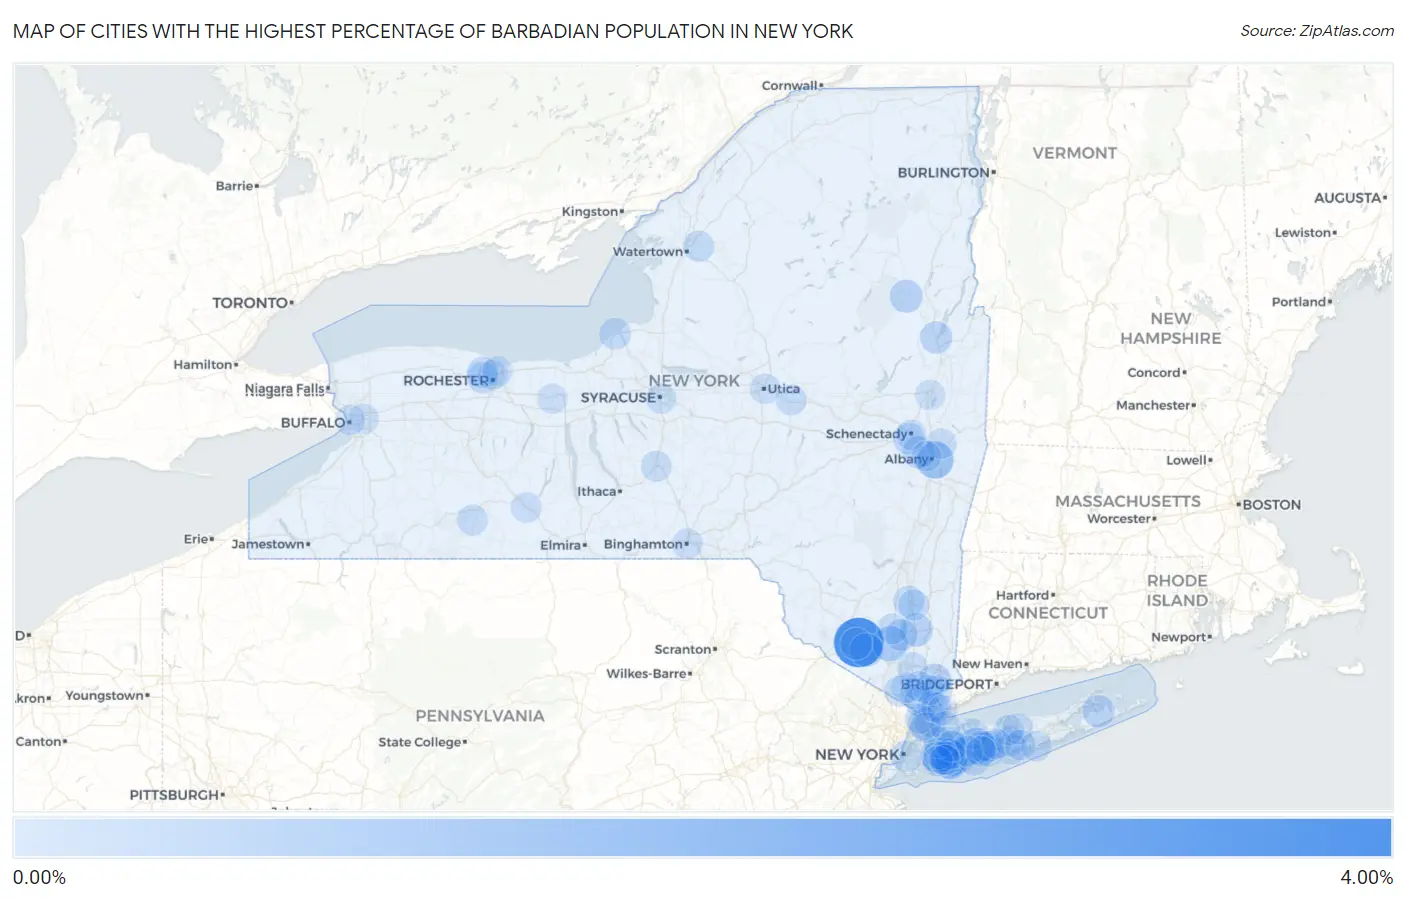
Map of Cities with the Highest Percentage of Barbadian Population in New York
0.00%
4.00%
Cities with the Highest Percentage of Barbadian Population in New York
| City | Barbadian | vs State | vs National | |
| 1. | Mechanicstown | 3.98% | 0.14%(+3.84)#1 | 0.021%(+3.96)#3 |
| 2. | Rensselaer | 1.42% | 0.14%(+1.28)#2 | 0.021%(+1.40)#16 |
| 3. | Wheatley Heights | 1.24% | 0.14%(+1.10)#3 | 0.021%(+1.22)#19 |
| 4. | Beaver Dam Lake | 1.00% | 0.14%(+0.862)#4 | 0.021%(+0.980)#22 |
| 5. | Roosevelt | 0.94% | 0.14%(+0.802)#5 | 0.021%(+0.920)#26 |
| 6. | Elmont | 0.75% | 0.14%(+0.611)#6 | 0.021%(+0.729)#40 |
| 7. | Goshen | 0.68% | 0.14%(+0.541)#7 | 0.021%(+0.659)#48 |
| 8. | Fishkill | 0.60% | 0.14%(+0.458)#8 | 0.021%(+0.576)#53 |
| 9. | Hempstead | 0.57% | 0.14%(+0.428)#9 | 0.021%(+0.546)#54 |
| 10. | North Creek | 0.55% | 0.14%(+0.411)#10 | 0.021%(+0.529)#58 |
| 11. | North Wantagh | 0.54% | 0.14%(+0.403)#11 | 0.021%(+0.521)#59 |
| 12. | Mount Kisco | 0.54% | 0.14%(+0.397)#12 | 0.021%(+0.514)#63 |
| 13. | Baldwin | 0.49% | 0.14%(+0.350)#13 | 0.021%(+0.468)#66 |
| 14. | Westmere | 0.44% | 0.14%(+0.297)#14 | 0.021%(+0.415)#73 |
| 15. | Sag Harbor | 0.43% | 0.14%(+0.286)#15 | 0.021%(+0.404)#76 |
| 16. | Lake George | 0.42% | 0.14%(+0.285)#16 | 0.021%(+0.403)#78 |
| 17. | Mount Vernon | 0.41% | 0.14%(+0.268)#17 | 0.021%(+0.386)#79 |
| 18. | Middletown | 0.37% | 0.14%(+0.233)#18 | 0.021%(+0.350)#89 |
| 19. | Newburgh | 0.37% | 0.14%(+0.226)#19 | 0.021%(+0.344)#90 |
| 20. | Siena College | 0.35% | 0.14%(+0.210)#20 | 0.021%(+0.328)#94 |
| 21. | North Valley Stream | 0.35% | 0.14%(+0.208)#21 | 0.021%(+0.326)#95 |
| 22. | Armonk | 0.34% | 0.14%(+0.204)#22 | 0.021%(+0.322)#97 |
| 23. | South Hempstead | 0.32% | 0.14%(+0.180)#23 | 0.021%(+0.298)#109 |
| 24. | East Meadow | 0.32% | 0.14%(+0.179)#24 | 0.021%(+0.297)#110 |
| 25. | Freeport | 0.31% | 0.14%(+0.171)#25 | 0.021%(+0.289)#114 |
| 26. | New Rochelle | 0.31% | 0.14%(+0.167)#26 | 0.021%(+0.285)#116 |
| 27. | Suny Oswego | 0.30% | 0.14%(+0.161)#27 | 0.021%(+0.279)#119 |
| 28. | North Gates | 0.30% | 0.14%(+0.157)#28 | 0.021%(+0.275)#121 |
| 29. | Rotterdam | 0.29% | 0.14%(+0.152)#29 | 0.021%(+0.270)#125 |
| 30. | New York | 0.26% | 0.14%(+0.123)#30 | 0.021%(+0.241)#139 |
| 31. | Baywood | 0.24% | 0.14%(+0.098)#31 | 0.021%(+0.216)#148 |
| 32. | Highland | 0.23% | 0.14%(+0.090)#32 | 0.021%(+0.208)#156 |
| 33. | Copiague | 0.21% | 0.14%(+0.075)#33 | 0.021%(+0.192)#167 |
| 34. | Bayport | 0.21% | 0.14%(+0.074)#34 | 0.021%(+0.192)#168 |
| 35. | Bay Shore | 0.20% | 0.14%(+0.064)#35 | 0.021%(+0.182)#177 |
| 36. | Greece | 0.19% | 0.14%(+0.056)#36 | 0.021%(+0.173)#187 |
| 37. | Huntington Station | 0.19% | 0.14%(+0.049)#37 | 0.021%(+0.167)#192 |
| 38. | Hillcrest | 0.18% | 0.14%(+0.045)#38 | 0.021%(+0.163)#196 |
| 39. | Black River | 0.18% | 0.14%(+0.042)#39 | 0.021%(+0.160)#199 |
| 40. | Tarrytown | 0.18% | 0.14%(+0.040)#40 | 0.021%(+0.157)#205 |
| 41. | Poughkeepsie | 0.18% | 0.14%(+0.038)#41 | 0.021%(+0.156)#208 |
| 42. | New Cassel | 0.17% | 0.14%(+0.033)#42 | 0.021%(+0.151)#211 |
| 43. | Lakeview | 0.17% | 0.14%(+0.030)#43 | 0.021%(+0.148)#214 |
| 44. | Cortland | 0.17% | 0.14%(+0.026)#44 | 0.021%(+0.144)#218 |
| 45. | Deer Park | 0.16% | 0.14%(+0.026)#45 | 0.021%(+0.144)#219 |
| 46. | Old Westbury | 0.16% | 0.14%(+0.020)#46 | 0.021%(+0.138)#224 |
| 47. | South Floral Park | 0.16% | 0.14%(+0.017)#47 | 0.021%(+0.135)#227 |
| 48. | Manhasset | 0.16% | 0.14%(+0.017)#48 | 0.021%(+0.135)#229 |
| 49. | Alfred | 0.15% | 0.14%(+0.014)#49 | 0.021%(+0.132)#233 |
| 50. | North Bay Shore | 0.15% | 0.14%(+0.014)#50 | 0.021%(+0.131)#234 |
| 51. | Farmingdale | 0.14% | 0.14%(+0.004)#51 | 0.021%(+0.121)#242 |
| 52. | Upper Nyack | 0.14% | 0.14%(+0.001)#52 | 0.021%(+0.119)#244 |
| 53. | Herkimer | 0.13% | 0.14%(-0.007)#53 | 0.021%(+0.110)#253 |
| 54. | Holbrook | 0.12% | 0.14%(-0.014)#54 | 0.021%(+0.104)#262 |
| 55. | Uniondale | 0.12% | 0.14%(-0.018)#55 | 0.021%(+0.100)#268 |
| 56. | Coram | 0.12% | 0.14%(-0.023)#56 | 0.021%(+0.095)#274 |
| 57. | Westbury | 0.11% | 0.14%(-0.025)#57 | 0.021%(+0.093)#276 |
| 58. | Centereach | 0.11% | 0.14%(-0.029)#58 | 0.021%(+0.089)#285 |
| 59. | Orange Lake | 0.11% | 0.14%(-0.029)#59 | 0.021%(+0.088)#286 |
| 60. | Peekskill | 0.098% | 0.14%(-0.040)#60 | 0.021%(+0.078)#309 |
| 61. | West Hempstead | 0.098% | 0.14%(-0.041)#61 | 0.021%(+0.077)#311 |
| 62. | White Plains | 0.093% | 0.14%(-0.046)#62 | 0.021%(+0.072)#315 |
| 63. | Binghamton | 0.092% | 0.14%(-0.046)#63 | 0.021%(+0.072)#317 |
| 64. | Troy | 0.092% | 0.14%(-0.047)#64 | 0.021%(+0.071)#321 |
| 65. | Central Islip | 0.090% | 0.14%(-0.048)#65 | 0.021%(+0.069)#323 |
| 66. | Bath | 0.089% | 0.14%(-0.050)#66 | 0.021%(+0.068)#326 |
| 67. | East Patchogue | 0.089% | 0.14%(-0.050)#67 | 0.021%(+0.068)#328 |
| 68. | Mastic Beach | 0.080% | 0.14%(-0.058)#68 | 0.021%(+0.059)#353 |
| 69. | Schenectady | 0.074% | 0.14%(-0.064)#69 | 0.021%(+0.054)#365 |
| 70. | Utica | 0.071% | 0.14%(-0.068)#70 | 0.021%(+0.050)#372 |
| 71. | New City | 0.071% | 0.14%(-0.068)#71 | 0.021%(+0.050)#375 |
| 72. | North Babylon | 0.065% | 0.14%(-0.073)#72 | 0.021%(+0.044)#394 |
| 73. | Valley Stream | 0.057% | 0.14%(-0.082)#73 | 0.021%(+0.036)#415 |
| 74. | Rockville Centre | 0.054% | 0.14%(-0.084)#74 | 0.021%(+0.033)#425 |
| 75. | Yonkers | 0.054% | 0.14%(-0.085)#75 | 0.021%(+0.033)#429 |
| 76. | Pelham Manor | 0.053% | 0.14%(-0.086)#76 | 0.021%(+0.032)#433 |
| 77. | Rochester | 0.048% | 0.14%(-0.091)#77 | 0.021%(+0.027)#446 |
| 78. | Albany | 0.044% | 0.14%(-0.095)#78 | 0.021%(+0.023)#463 |
| 79. | Syracuse | 0.042% | 0.14%(-0.097)#79 | 0.021%(+0.021)#479 |
| 80. | Harrison | 0.035% | 0.14%(-0.104)#80 | 0.021%(+0.014)#523 |
| 81. | Newark | 0.033% | 0.14%(-0.106)#81 | 0.021%(+0.012)#530 |
| 82. | Ossining | 0.030% | 0.14%(-0.109)#82 | 0.021%(+0.009)#543 |
| 83. | Pleasantville | 0.027% | 0.14%(-0.112)#83 | 0.021%(+0.006)#558 |
| 84. | Glen Cove | 0.021% | 0.14%(-0.117)#84 | 0.021%(+0.000)#589 |
| 85. | Irondequoit | 0.018% | 0.14%(-0.121)#85 | 0.021%(-0.003)#611 |
| 86. | Port Chester | 0.016% | 0.14%(-0.123)#86 | 0.021%(-0.005)#620 |
| 87. | Cheektowaga | 0.016% | 0.14%(-0.123)#87 | 0.021%(-0.005)#623 |
| 88. | Saratoga Springs | 0.011% | 0.14%(-0.128)#88 | 0.021%(-0.010)#672 |
| 89. | Buffalo | 0.0040% | 0.14%(-0.135)#89 | 0.021%(-0.017)#741 |
Common Questions
What are the Top 10 Cities with the Highest Percentage of Barbadian Population in New York?
Top 10 Cities with the Highest Percentage of Barbadian Population in New York are:
#1
3.98%
#2
1.42%
#3
1.24%
#4
1.00%
#5
0.94%
#6
0.75%
#7
0.68%
#8
0.60%
#9
0.57%
#10
0.55%
What city has the Highest Percentage of Barbadian Population in New York?
Mechanicstown has the Highest Percentage of Barbadian Population in New York with 3.98%.
What is the Percentage of Barbadian Population in the State of New York?
Percentage of Barbadian Population in New York is 0.14%.
What is the Percentage of Barbadian Population in the United States?
Percentage of Barbadian Population in the United States is 0.021%.