Zip Codes with the Highest Percentage of Population Employed in Food Preparation & Serving in Great Neck, NY
RELATED REPORTS & OPTIONS
Food Preparation & Serving
Great Neck
Compare Zip Codes
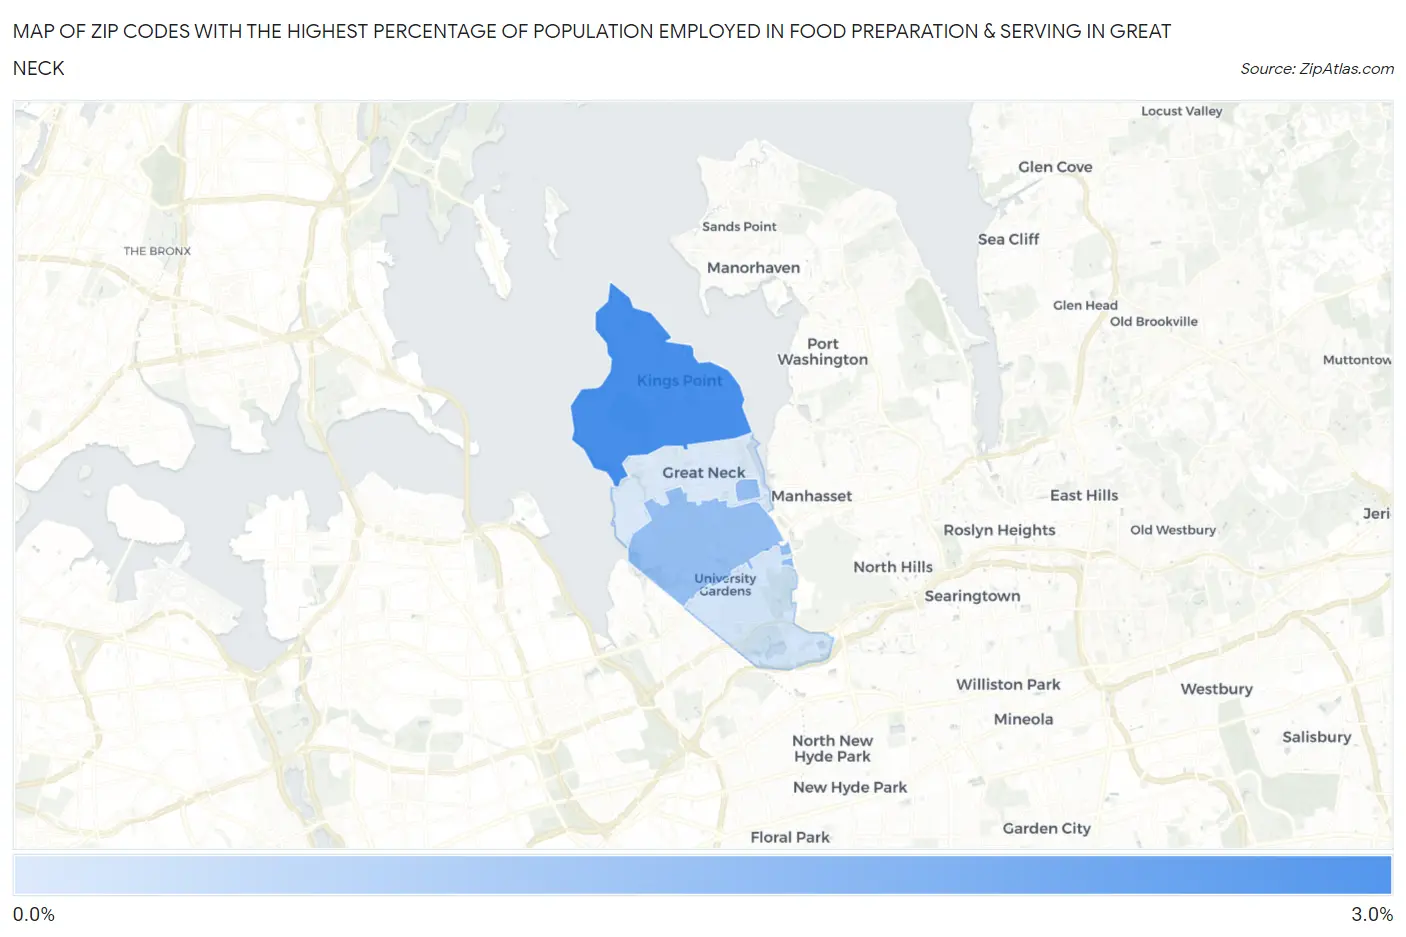
Map of Zip Codes with the Highest Percentage of Population Employed in Food Preparation & Serving in Great Neck
0.81%
2.8%
Zip Codes with the Highest Percentage of Population Employed in Food Preparation & Serving in Great Neck, NY
| Zip Code | % Employed | vs State | vs National | |
| 1. | 11024 | 2.8% | 4.8%(-2.02)#1,159 | 5.3%(-2.49)#22,074 |
| 2. | 11021 | 1.8% | 4.8%(-3.06)#1,361 | 5.3%(-3.53)#25,392 |
| 3. | 11020 | 0.94% | 4.8%(-3.87)#1,460 | 5.3%(-4.34)#27,067 |
| 4. | 11023 | 0.81% | 4.8%(-4.01)#1,476 | 5.3%(-4.48)#27,296 |
1
Common Questions
What are the Top 3 Zip Codes with the Highest Percentage of Population Employed in Food Preparation & Serving in Great Neck, NY?
Top 3 Zip Codes with the Highest Percentage of Population Employed in Food Preparation & Serving in Great Neck, NY are:
What zip code has the Highest Percentage of Population Employed in Food Preparation & Serving in Great Neck, NY?
11024 has the Highest Percentage of Population Employed in Food Preparation & Serving in Great Neck, NY with 2.8%.
What is the Percentage of Population Employed in Food Preparation & Serving in Great Neck, NY?
Percentage of Population Employed in Food Preparation & Serving in Great Neck is 2.3%.
What is the Percentage of Population Employed in Food Preparation & Serving in New York?
Percentage of Population Employed in Food Preparation & Serving in New York is 4.8%.
What is the Percentage of Population Employed in Food Preparation & Serving in the United States?
Percentage of Population Employed in Food Preparation & Serving in the United States is 5.3%.