Cities with the Most Immigrants from Switzerland in New York

RELATED REPORTS & OPTIONS

Switzerland
Population
Families and Households
Female Fertility
Female Fertility (Unmarried)
Race (Community Size)
Race (Percentage)
Ancestry (Community Size)
AfghanAfricanAlaska NativeAlaskan AthabascanAlbanianAleutAlsatianAmericanApacheArabArapahoArgentineanArmenianAssyrian / Chaldean / SyriacAustralianAustrianBahamianBangladeshiBarbadianBasqueBelgianBelizeanBermudanBhutaneseBlackfeetBolivianBrazilianBritishBritish West IndianBulgarianBurmeseCajunCambodianCanadianCape VerdeanCarpatho RusynCelticCentral AmericanCentral American IndianCherokeeCheyenneChickasawChileanChineseChippewaChoctawColombianColvilleComancheCosta RicanCreeCreekCroatianCrowCubanCypriotCzechCzechoslovakianDanishDelawareDominicanDutchDutch West IndianEastern EuropeanEcuadorianEgyptianEnglishEstonianEthiopianEuropeanFijianFilipinoFinnishFrenchFrench American IndianFrench CanadianGermanGerman RussianGhanaianGreekGuamanian / ChamorroGuatemalanGuyaneseHaitianHmongHonduranHopiHoumaHungarianIcelanderIndian (Asian)IndonesianInupiatIranianIraqiIrishIroquoisIsraeliItalianJamaicanJapaneseJordanianKenyanKiowaKoreanLaotianLatvianLebaneseLiberianLithuanianLumbeeLuxembourgerMacedonianMalaysianMalteseMarshalleseMenomineeMexicanMexican American IndianMongolianMoroccanNative HawaiianNavajoNepaleseNew ZealanderNicaraguanNigerianNorthern EuropeanNorwegianOkinawanOsageOttawaPaiutePakistaniPalestinianPanamanianParaguayanPennsylvania GermanPeruvianPimaPolishPortuguesePotawatomiPuebloPuerto RicanPuget Sound SalishRomanianRussianSalvadoranSamoanScandinavianScotch-IrishScottishSeminoleSenegaleseSerbianShoshoneSierra LeoneanSiouxSlavicSlovakSloveneSomaliSouth AfricanSouth AmericanSouth American IndianSoviet UnionSpaniardSpanishSpanish AmericanSpanish American IndianSri LankanSubsaharan AfricanSudaneseSwedishSwissSyrianTaiwaneseThaiTlingit-HaidaTohono O'OdhamTonganTrinidadian and TobagonianTsimshianTurkishU.S. Virgin IslanderUgandanUkrainianUruguayanUteVenezuelanVietnameseWelshWest IndianYakamaYaquiYugoslavianYumanYup'ikZimbabwean
Ancestry (Percentage)
AfghanAfricanAlaska NativeAlaskan AthabascanAlbanianAleutAlsatianAmericanApacheArabArapahoArgentineanArmenianAssyrian / Chaldean / SyriacAustralianAustrianBahamianBangladeshiBarbadianBasqueBelgianBelizeanBermudanBhutaneseBlackfeetBolivianBrazilianBritishBritish West IndianBulgarianBurmeseCajunCambodianCanadianCape VerdeanCarpatho RusynCelticCentral AmericanCentral American IndianCherokeeCheyenneChickasawChileanChineseChippewaChoctawColombianColvilleComancheCosta RicanCreeCreekCroatianCrowCubanCypriotCzechCzechoslovakianDanishDelawareDominicanDutchDutch West IndianEastern EuropeanEcuadorianEgyptianEnglishEstonianEthiopianEuropeanFijianFilipinoFinnishFrenchFrench American IndianFrench CanadianGermanGerman RussianGhanaianGreekGuamanian / ChamorroGuatemalanGuyaneseHaitianHmongHonduranHopiHoumaHungarianIcelanderIndian (Asian)IndonesianInupiatIranianIraqiIrishIroquoisIsraeliItalianJamaicanJapaneseJordanianKenyanKiowaKoreanLaotianLatvianLebaneseLiberianLithuanianLumbeeLuxembourgerMacedonianMalaysianMalteseMarshalleseMenomineeMexicanMexican American IndianMongolianMoroccanNative HawaiianNavajoNepaleseNew ZealanderNicaraguanNigerianNorthern EuropeanNorwegianOkinawanOsageOttawaPaiutePakistaniPalestinianPanamanianParaguayanPennsylvania GermanPeruvianPimaPolishPortuguesePotawatomiPuebloPuerto RicanPuget Sound SalishRomanianRussianSalvadoranSamoanScandinavianScotch-IrishScottishSeminoleSenegaleseSerbianShoshoneSierra LeoneanSiouxSlavicSlovakSloveneSomaliSouth AfricanSouth AmericanSouth American IndianSoviet UnionSpaniardSpanishSpanish AmericanSpanish American IndianSri LankanSubsaharan AfricanSudaneseSwedishSwissSyrianTaiwaneseThaiTlingit-HaidaTohono O'OdhamTonganTrinidadian and TobagonianTsimshianTurkishU.S. Virgin IslanderUgandanUkrainianUruguayanUteVenezuelanVietnameseWelshWest IndianYakamaYaquiYugoslavianYumanYup'ikZimbabwean
Immigrant Origin (Total)
AfghanistanAfricaAlbaniaArgentinaArmeniaAsiaAustraliaAustriaAzoresBahamasBangladeshBarbadosBelarusBelgiumBelizeBoliviaBosnia and HerzegovinaBrazilBulgariaBurma / MyanmarCabo VerdeCambodiaCameroonCanadaCaribbeanCentral AmericaChileChinaColombiaCongoCosta RicaCroatiaCubaCzechoslovakiaDenmarkDominicaDominican RepublicEastern AfricaEastern AsiaEastern EuropeEcuadorEgyptEl SalvadorEnglandEritreaEthiopiaEuropeFijiFranceGermanyGhanaGreeceGrenadaGuatemalaGuyanaHaitiHondurasHong KongHungaryIndiaIndonesiaIranIraqIrelandIsraelItalyJamaicaJapanJordanKazakhstanKenyaKoreaKuwaitLaosLatin AmericaLatviaLebanonLiberiaLithuaniaMalaysiaMexicoMicronesiaMiddle AfricaMoldovaMoroccoNepalNetherlandsNicaraguaNigeriaNorth MacedoniaNorthern AfricaNorthern EuropeNorwayOceaniaPakistanPanamaPeruPhilippinesPolandPortugalRomaniaRussiaSaudi ArabiaScotlandSenegalSerbiaSierra LeoneSingaporeSomaliaSouth AfricaSouth AmericaSouth Central AsiaSouth Eastern AsiaSouthern EuropeSpainSri LankaSt. Vincent and the GrenadinesSudanSwedenSwitzerlandSyriaTaiwanThailandTrinidad and TobagoTurkeyUgandaUkraineUruguayUzbekistanVenezuelaVietnamWest IndiesWestern AfricaWestern AsiaWestern EuropeYemenZaireZimbabwe
Immigrant Origin (Percentage)
AfghanistanAfricaAlbaniaArgentinaArmeniaAsiaAustraliaAustriaAzoresBahamasBangladeshBarbadosBelarusBelgiumBelizeBoliviaBosnia and HerzegovinaBrazilBulgariaBurma / MyanmarCabo VerdeCambodiaCameroonCanadaCaribbeanCentral AmericaChileChinaColombiaCongoCosta RicaCroatiaCubaCzechoslovakiaDenmarkDominicaDominican RepublicEastern AfricaEastern AsiaEastern EuropeEcuadorEgyptEl SalvadorEnglandEritreaEthiopiaEuropeFijiFranceGermanyGhanaGreeceGrenadaGuatemalaGuyanaHaitiHondurasHong KongHungaryIndiaIndonesiaIranIraqIrelandIsraelItalyJamaicaJapanJordanKazakhstanKenyaKoreaKuwaitLaosLatin AmericaLatviaLebanonLiberiaLithuaniaMalaysiaMexicoMicronesiaMiddle AfricaMoldovaMoroccoNepalNetherlandsNicaraguaNigeriaNorth MacedoniaNorthern AfricaNorthern EuropeNorwayOceaniaPakistanPanamaPeruPhilippinesPolandPortugalRomaniaRussiaSaudi ArabiaScotlandSenegalSerbiaSierra LeoneSingaporeSomaliaSouth AfricaSouth AmericaSouth Central AsiaSouth Eastern AsiaSouthern EuropeSpainSri LankaSt. Vincent and the GrenadinesSudanSwedenSwitzerlandSyriaTaiwanThailandTrinidad and TobagoTurkeyUgandaUkraineUruguayUzbekistanVenezuelaVietnamWest IndiesWestern AfricaWestern AsiaWestern EuropeYemenZaireZimbabwe
Income
Income (Families)
Income (Households)
Poverty
Poverty (Families)
Unemployment
Employment Occupations
Employment Industries
Employer Class
Commute Time
Commute Means
School Enrollment
Education by Degree Field
Occupancy
Finances
Physical Characteristics
New York
Compare Cities
Comparison Subject

Map of Cities with the Most Immigrants from Switzerland in New York

0
3,000
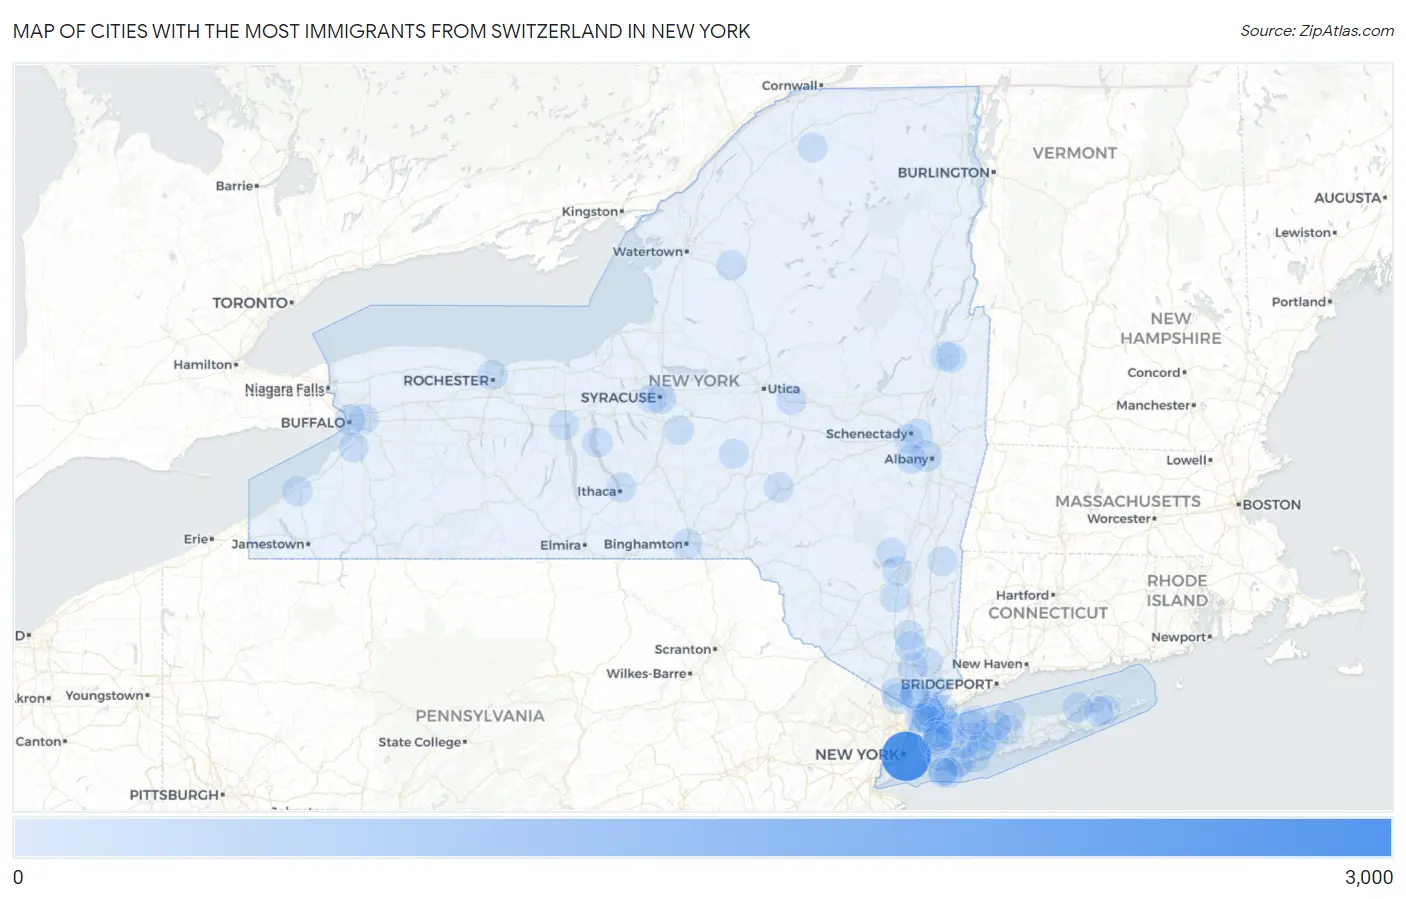
Cities with the Most Immigrants from Switzerland in New York Map

Cities with the Most Immigrants from Switzerland in New York

City Switzerland vs State vs National
1. New York 2,535 4,429 (57.24%)#1 37,522 (6.76%)#1
2. Albany 146 4,429 (3.30%)#2 37,522 (0.39%)#26
3. Buffalo 106 4,429 (2.39%)#3 37,522 (0.28%)#39
4. Chestnut Ridge 98 4,429 (2.21%)#4 37,522 (0.26%)#45
5. Commack 94 4,429 (2.12%)#5 37,522 (0.25%)#46
6. Port Chester 57 4,429 (1.29%)#6 37,522 (0.15%)#102
7. Rye 47 4,429 (1.06%)#7 37,522 (0.13%)#134
8. Rochester 39 4,429 (0.88%)#8 37,522 (0.10%)#156
9. Loudonville 38 4,429 (0.86%)#9 37,522 (0.10%)#166
10. Syracuse 35 4,429 (0.79%)#10 37,522 (0.09%)#181
11. New Rochelle 34 4,429 (0.77%)#11 37,522 (0.09%)#187
12. Nyack 34 4,429 (0.77%)#12 37,522 (0.09%)#193
13. Cutchogue 33 4,429 (0.75%)#13 37,522 (0.09%)#202
14. White Plains 27 4,429 (0.61%)#14 37,522 (0.07%)#245
15. Peekskill 23 4,429 (0.52%)#15 37,522 (0.06%)#297
16. South Huntington 22 4,429 (0.50%)#16 37,522 (0.06%)#318
17. Armonk 21 4,429 (0.47%)#17 37,522 (0.06%)#331
18. Beacon 20 4,429 (0.45%)#18 37,522 (0.05%)#351
19. Fredonia 20 4,429 (0.45%)#19 37,522 (0.05%)#356
20. Binghamton 19 4,429 (0.43%)#20 37,522 (0.05%)#365
21. Seaford 19 4,429 (0.43%)#21 37,522 (0.05%)#370
22. Great Neck Plaza 19 4,429 (0.43%)#22 37,522 (0.05%)#372
23. Geneva 17 4,429 (0.38%)#23 37,522 (0.05%)#422
24. Island Park 17 4,429 (0.38%)#24 37,522 (0.05%)#431
25. Cayuga Heights 17 4,429 (0.38%)#25 37,522 (0.05%)#432
26. Monsey 16 4,429 (0.36%)#26 37,522 (0.04%)#449
27. New Paltz 16 4,429 (0.36%)#27 37,522 (0.04%)#458
28. Tuckahoe 16 4,429 (0.36%)#28 37,522 (0.04%)#459
29. Niskayuna 15 4,429 (0.34%)#29 37,522 (0.04%)#471
30. Yonkers 14 4,429 (0.32%)#30 37,522 (0.04%)#486
31. Herkimer 14 4,429 (0.32%)#31 37,522 (0.04%)#509
32. Cheektowaga 13 4,429 (0.29%)#32 37,522 (0.03%)#519
33. Hurley 13 4,429 (0.29%)#33 37,522 (0.03%)#548
34. Eastchester 12 4,429 (0.27%)#34 37,522 (0.03%)#576
35. Northwest Harbor 12 4,429 (0.27%)#35 37,522 (0.03%)#591
36. Franklin Square 11 4,429 (0.25%)#36 37,522 (0.03%)#608
37. Glens Falls 11 4,429 (0.25%)#37 37,522 (0.03%)#616
38. Bellmore 10 4,429 (0.23%)#38 37,522 (0.03%)#667
39. Hudson Falls 10 4,429 (0.23%)#39 37,522 (0.03%)#678
40. Woodstock 10 4,429 (0.23%)#40 37,522 (0.03%)#686
41. Sands Point 10 4,429 (0.23%)#41 37,522 (0.03%)#688
42. Old Brookville 10 4,429 (0.23%)#42 37,522 (0.03%)#690
43. Jefferson Valley Yorktown 9 4,429 (0.20%)#43 37,522 (0.02%)#716
44. Westvale 9 4,429 (0.20%)#44 37,522 (0.02%)#728
45. Lindenhurst 8 4,429 (0.18%)#45 37,522 (0.02%)#758
46. Plainview 8 4,429 (0.18%)#46 37,522 (0.02%)#760
47. Hauppauge 8 4,429 (0.18%)#47 37,522 (0.02%)#764
48. Scarsdale 8 4,429 (0.18%)#48 37,522 (0.02%)#768
49. Nelsonville 8 4,429 (0.18%)#49 37,522 (0.02%)#799
50. Deer Park 7 4,429 (0.16%)#50 37,522 (0.02%)#820
51. Lido Beach 7 4,429 (0.16%)#51 37,522 (0.02%)#839
52. West End 7 4,429 (0.16%)#52 37,522 (0.02%)#842
53. Rotterdam 6 4,429 (0.14%)#53 37,522 (0.02%)#866
54. Sag Harbor 6 4,429 (0.14%)#54 37,522 (0.02%)#880
55. Belle Terre 6 4,429 (0.14%)#55 37,522 (0.02%)#882
56. Parishville 6 4,429 (0.14%)#56 37,522 (0.02%)#883
57. Hamburg 5 4,429 (0.11%)#57 37,522 (0.01%)#899
58. Long Beach 4 4,429 (0.09%)#58 37,522 (0.01%)#927
59. Centereach 4 4,429 (0.09%)#59 37,522 (0.01%)#928
60. Lattingtown 4 4,429 (0.09%)#60 37,522 (0.01%)#946
61. Huntington Bay 4 4,429 (0.09%)#61 37,522 (0.01%)#948
62. Sherburne 4 4,429 (0.09%)#62 37,522 (0.01%)#951
63. Pine Plains 4 4,429 (0.09%)#63 37,522 (0.01%)#953
64. Plandome Heights 4 4,429 (0.09%)#64 37,522 (0.01%)#954
65. Baxter Estates 3 4,429 (0.07%)#65 37,522 (0.01%)#985
66. Aurora 3 4,429 (0.07%)#66 37,522 (0.01%)#988
67. Castorland 3 4,429 (0.07%)#67 37,522 (0.01%)#991
68. Upper Nyack 2 4,429 (0.05%)#68 37,522 (0.01%)#1,010
69. Nissequogue 2 4,429 (0.05%)#69 37,522 (0.01%)#1,011
70. Fabius 2 4,429 (0.05%)#70 37,522 (0.01%)#1,029
71. Voorheesville 1 4,429 (0.02%)#71 37,522 (0.00%)#1,041
72. Asharoken 1 4,429 (0.02%)#72 37,522 (0.00%)#1,047

Common Questions

What are the Top 10 Cities with the Most Immigrants from Switzerland in New York?
Top 10 Cities with the Most Immigrants from Switzerland in New York are:
What city has the Most Immigrants from Switzerland in New York?
New York has the Most Immigrants from Switzerland in New York with 2,535.
What is the Total Immigrants from Switzerland in the State of New York?
Total Immigrants from Switzerland in New York is 4,429.
What is the Total Immigrants from Switzerland in the United States?
Total Immigrants from Switzerland in the United States is 37,522.