Zip Codes with the Highest Percentage of Population Employed in Food Preparation & Serving in Mount Vernon, NY
RELATED REPORTS & OPTIONS
Food Preparation & Serving
Mount Vernon
Compare Zip Codes
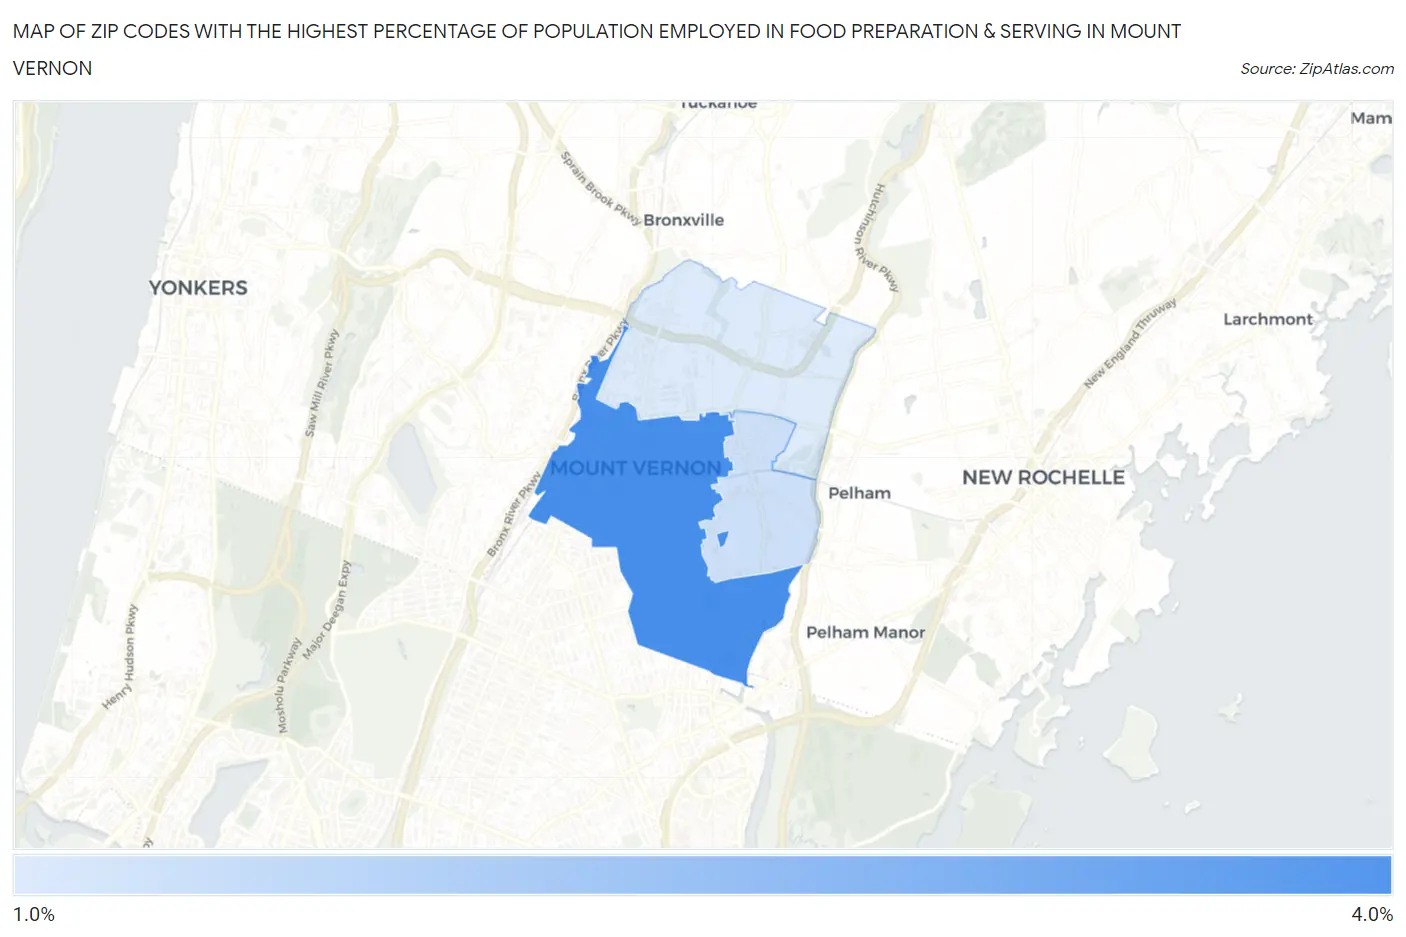
Map of Zip Codes with the Highest Percentage of Population Employed in Food Preparation & Serving in Mount Vernon
1.7%
4.0%
Zip Codes with the Highest Percentage of Population Employed in Food Preparation & Serving in Mount Vernon, NY
| Zip Code | % Employed | vs State | vs National | |
| 1. | 10550 | 4.0% | 4.8%(-0.857)#869 | 5.3%(-1.33)#17,295 |
| 2. | 10553 | 1.9% | 4.8%(-2.87)#1,328 | 5.3%(-3.34)#24,862 |
| 3. | 10552 | 1.7% | 4.8%(-3.12)#1,374 | 5.3%(-3.59)#25,543 |
1
Common Questions
What are the Top Zip Codes with the Highest Percentage of Population Employed in Food Preparation & Serving in Mount Vernon, NY?
Top Zip Codes with the Highest Percentage of Population Employed in Food Preparation & Serving in Mount Vernon, NY are:
What zip code has the Highest Percentage of Population Employed in Food Preparation & Serving in Mount Vernon, NY?
10550 has the Highest Percentage of Population Employed in Food Preparation & Serving in Mount Vernon, NY with 4.0%.
What is the Percentage of Population Employed in Food Preparation & Serving in Mount Vernon, NY?
Percentage of Population Employed in Food Preparation & Serving in Mount Vernon is 2.9%.
What is the Percentage of Population Employed in Food Preparation & Serving in New York?
Percentage of Population Employed in Food Preparation & Serving in New York is 4.8%.
What is the Percentage of Population Employed in Food Preparation & Serving in the United States?
Percentage of Population Employed in Food Preparation & Serving in the United States is 5.3%.