Cities with the Highest Percentage of Immigrants from St. Vincent and the Grenadines in New York

RELATED REPORTS & OPTIONS

St. Vincent and the Grenadines
Population
Families and Households
Female Fertility
Female Fertility (Unmarried)
Race (Community Size)
Race (Percentage)
Ancestry (Community Size)
AfghanAfricanAlaska NativeAlaskan AthabascanAlbanianAleutAlsatianAmericanApacheArabArapahoArgentineanArmenianAssyrian / Chaldean / SyriacAustralianAustrianBahamianBangladeshiBarbadianBasqueBelgianBelizeanBermudanBhutaneseBlackfeetBolivianBrazilianBritishBritish West IndianBulgarianBurmeseCajunCambodianCanadianCape VerdeanCarpatho RusynCelticCentral AmericanCentral American IndianCherokeeCheyenneChickasawChileanChineseChippewaChoctawColombianColvilleComancheCosta RicanCreeCreekCroatianCrowCubanCypriotCzechCzechoslovakianDanishDelawareDominicanDutchDutch West IndianEastern EuropeanEcuadorianEgyptianEnglishEstonianEthiopianEuropeanFijianFilipinoFinnishFrenchFrench American IndianFrench CanadianGermanGerman RussianGhanaianGreekGuamanian / ChamorroGuatemalanGuyaneseHaitianHmongHonduranHopiHoumaHungarianIcelanderIndian (Asian)IndonesianInupiatIranianIraqiIrishIroquoisIsraeliItalianJamaicanJapaneseJordanianKenyanKiowaKoreanLaotianLatvianLebaneseLiberianLithuanianLumbeeLuxembourgerMacedonianMalaysianMalteseMarshalleseMenomineeMexicanMexican American IndianMongolianMoroccanNative HawaiianNavajoNepaleseNew ZealanderNicaraguanNigerianNorthern EuropeanNorwegianOkinawanOsageOttawaPaiutePakistaniPalestinianPanamanianParaguayanPennsylvania GermanPeruvianPimaPolishPortuguesePotawatomiPuebloPuerto RicanPuget Sound SalishRomanianRussianSalvadoranSamoanScandinavianScotch-IrishScottishSeminoleSenegaleseSerbianShoshoneSierra LeoneanSiouxSlavicSlovakSloveneSomaliSouth AfricanSouth AmericanSouth American IndianSoviet UnionSpaniardSpanishSpanish AmericanSpanish American IndianSri LankanSubsaharan AfricanSudaneseSwedishSwissSyrianTaiwaneseThaiTlingit-HaidaTohono O'OdhamTonganTrinidadian and TobagonianTsimshianTurkishU.S. Virgin IslanderUgandanUkrainianUruguayanUteVenezuelanVietnameseWelshWest IndianYakamaYaquiYugoslavianYumanYup'ikZimbabwean
Ancestry (Percentage)
AfghanAfricanAlaska NativeAlaskan AthabascanAlbanianAleutAlsatianAmericanApacheArabArapahoArgentineanArmenianAssyrian / Chaldean / SyriacAustralianAustrianBahamianBangladeshiBarbadianBasqueBelgianBelizeanBermudanBhutaneseBlackfeetBolivianBrazilianBritishBritish West IndianBulgarianBurmeseCajunCambodianCanadianCape VerdeanCarpatho RusynCelticCentral AmericanCentral American IndianCherokeeCheyenneChickasawChileanChineseChippewaChoctawColombianColvilleComancheCosta RicanCreeCreekCroatianCrowCubanCypriotCzechCzechoslovakianDanishDelawareDominicanDutchDutch West IndianEastern EuropeanEcuadorianEgyptianEnglishEstonianEthiopianEuropeanFijianFilipinoFinnishFrenchFrench American IndianFrench CanadianGermanGerman RussianGhanaianGreekGuamanian / ChamorroGuatemalanGuyaneseHaitianHmongHonduranHopiHoumaHungarianIcelanderIndian (Asian)IndonesianInupiatIranianIraqiIrishIroquoisIsraeliItalianJamaicanJapaneseJordanianKenyanKiowaKoreanLaotianLatvianLebaneseLiberianLithuanianLumbeeLuxembourgerMacedonianMalaysianMalteseMarshalleseMenomineeMexicanMexican American IndianMongolianMoroccanNative HawaiianNavajoNepaleseNew ZealanderNicaraguanNigerianNorthern EuropeanNorwegianOkinawanOsageOttawaPaiutePakistaniPalestinianPanamanianParaguayanPennsylvania GermanPeruvianPimaPolishPortuguesePotawatomiPuebloPuerto RicanPuget Sound SalishRomanianRussianSalvadoranSamoanScandinavianScotch-IrishScottishSeminoleSenegaleseSerbianShoshoneSierra LeoneanSiouxSlavicSlovakSloveneSomaliSouth AfricanSouth AmericanSouth American IndianSoviet UnionSpaniardSpanishSpanish AmericanSpanish American IndianSri LankanSubsaharan AfricanSudaneseSwedishSwissSyrianTaiwaneseThaiTlingit-HaidaTohono O'OdhamTonganTrinidadian and TobagonianTsimshianTurkishU.S. Virgin IslanderUgandanUkrainianUruguayanUteVenezuelanVietnameseWelshWest IndianYakamaYaquiYugoslavianYumanYup'ikZimbabwean
Immigrant Origin (Total)
AfghanistanAfricaAlbaniaArgentinaArmeniaAsiaAustraliaAustriaAzoresBahamasBangladeshBarbadosBelarusBelgiumBelizeBoliviaBosnia and HerzegovinaBrazilBulgariaBurma / MyanmarCabo VerdeCambodiaCameroonCanadaCaribbeanCentral AmericaChileChinaColombiaCongoCosta RicaCroatiaCubaCzechoslovakiaDenmarkDominicaDominican RepublicEastern AfricaEastern AsiaEastern EuropeEcuadorEgyptEl SalvadorEnglandEritreaEthiopiaEuropeFijiFranceGermanyGhanaGreeceGrenadaGuatemalaGuyanaHaitiHondurasHong KongHungaryIndiaIndonesiaIranIraqIrelandIsraelItalyJamaicaJapanJordanKazakhstanKenyaKoreaKuwaitLaosLatin AmericaLatviaLebanonLiberiaLithuaniaMalaysiaMexicoMicronesiaMiddle AfricaMoldovaMoroccoNepalNetherlandsNicaraguaNigeriaNorth MacedoniaNorthern AfricaNorthern EuropeNorwayOceaniaPakistanPanamaPeruPhilippinesPolandPortugalRomaniaRussiaSaudi ArabiaScotlandSenegalSerbiaSierra LeoneSingaporeSomaliaSouth AfricaSouth AmericaSouth Central AsiaSouth Eastern AsiaSouthern EuropeSpainSri LankaSt. Vincent and the GrenadinesSudanSwedenSwitzerlandSyriaTaiwanThailandTrinidad and TobagoTurkeyUgandaUkraineUruguayUzbekistanVenezuelaVietnamWest IndiesWestern AfricaWestern AsiaWestern EuropeYemenZaireZimbabwe
Immigrant Origin (Percentage)
AfghanistanAfricaAlbaniaArgentinaArmeniaAsiaAustraliaAustriaAzoresBahamasBangladeshBarbadosBelarusBelgiumBelizeBoliviaBosnia and HerzegovinaBrazilBulgariaBurma / MyanmarCabo VerdeCambodiaCameroonCanadaCaribbeanCentral AmericaChileChinaColombiaCongoCosta RicaCroatiaCubaCzechoslovakiaDenmarkDominicaDominican RepublicEastern AfricaEastern AsiaEastern EuropeEcuadorEgyptEl SalvadorEnglandEritreaEthiopiaEuropeFijiFranceGermanyGhanaGreeceGrenadaGuatemalaGuyanaHaitiHondurasHong KongHungaryIndiaIndonesiaIranIraqIrelandIsraelItalyJamaicaJapanJordanKazakhstanKenyaKoreaKuwaitLaosLatin AmericaLatviaLebanonLiberiaLithuaniaMalaysiaMexicoMicronesiaMiddle AfricaMoldovaMoroccoNepalNetherlandsNicaraguaNigeriaNorth MacedoniaNorthern AfricaNorthern EuropeNorwayOceaniaPakistanPanamaPeruPhilippinesPolandPortugalRomaniaRussiaSaudi ArabiaScotlandSenegalSerbiaSierra LeoneSingaporeSomaliaSouth AfricaSouth AmericaSouth Central AsiaSouth Eastern AsiaSouthern EuropeSpainSri LankaSt. Vincent and the GrenadinesSudanSwedenSwitzerlandSyriaTaiwanThailandTrinidad and TobagoTurkeyUgandaUkraineUruguayUzbekistanVenezuelaVietnamWest IndiesWestern AfricaWestern AsiaWestern EuropeYemenZaireZimbabwe
Income
Income (Families)
Income (Households)
Poverty
Poverty (Families)
Unemployment
Employment Occupations
Employment Industries
Employer Class
Commute Time
Commute Means
School Enrollment
Education by Degree Field
Occupancy
Finances
Physical Characteristics
New York
Compare Cities
Comparison Subject

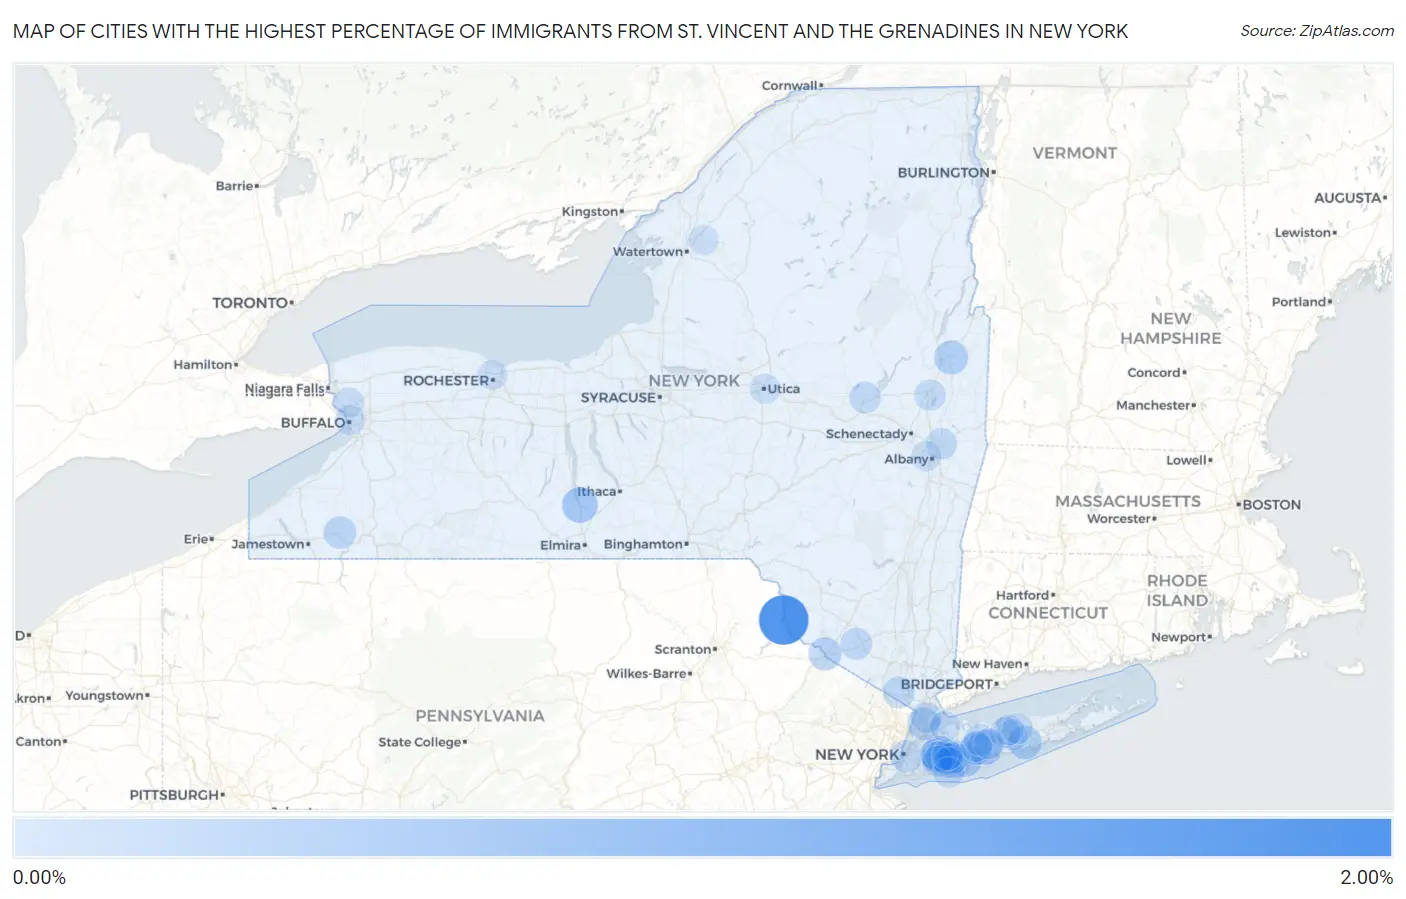
Map of Cities with the Highest Percentage of Immigrants from St. Vincent and the Grenadines in New York

0.00%
2.00%
Cities with the Highest Percentage of Immigrants from St. Vincent and the Grenadines in New York Map

Cities with the Highest Percentage of Immigrants from St. Vincent and the Grenadines in New York

City St. Vincent and the Grenadines vs State vs National
1.Narrowsburg1.59%0.068%(+1.52)#2150.0067%(+1.58)#1,442
2.Montour Falls0.44%0.068%(+0.369)#3580.0067%(+0.430)#2,618
3.South Floral Park0.41%0.068%(+0.347)#3590.0067%(+0.408)#2,619
4.Baywood0.39%0.068%(+0.321)#3600.0067%(+0.383)#2,620
5.Hudson Falls0.30%0.068%(+0.228)#4900.0067%(+0.290)#4,096
6.North Bellport0.28%0.068%(+0.217)#4910.0067%(+0.278)#4,097
7.Massapequa0.28%0.068%(+0.215)#4920.0067%(+0.277)#4,098
8.Elmont0.28%0.068%(+0.209)#4930.0067%(+0.271)#4,099
9.Port Jervis0.24%0.068%(+0.172)#4940.0067%(+0.234)#4,100
10.Mount Vernon0.21%0.068%(+0.144)#4950.0067%(+0.206)#4,101
11.East Randolph0.18%0.068%(+0.113)#5390.0067%(+0.175)#4,870
12.Wyandanch0.17%0.068%(+0.101)#5400.0067%(+0.162)#4,871
13.New York0.15%0.068%(+0.077)#5410.0067%(+0.139)#4,872
14.North Valley Stream0.14%0.068%(+0.074)#5420.0067%(+0.135)#4,873
15.Latham0.14%0.068%(+0.071)#5430.0067%(+0.132)#4,874
16.Merrick0.14%0.068%(+0.070)#5440.0067%(+0.131)#4,875
17.Dix Hills0.13%0.068%(+0.061)#5450.0067%(+0.123)#4,876
18.Middletown0.13%0.068%(+0.061)#5460.0067%(+0.123)#4,877
19.Spring Valley0.12%0.068%(+0.056)#5470.0067%(+0.118)#4,878
20.Gloversville0.12%0.068%(+0.051)#5480.0067%(+0.112)#4,879
21.Troy0.099%0.068%(+0.031)#5490.0067%(+0.093)#4,880
22.Roosevelt0.099%0.068%(+0.030)#5500.0067%(+0.092)#4,881
23.South Hempstead0.096%0.068%(+0.027)#5510.0067%(+0.089)#4,882
24.Uniondale0.093%0.068%(+0.025)#5520.0067%(+0.087)#4,883
25.North Merrick0.090%0.068%(+0.022)#5530.0067%(+0.084)#4,884
26.Wheatley Heights0.075%0.068%(+0.007)#5540.0067%(+0.068)#4,885
27.Saratoga Springs0.074%0.068%(+0.005)#5550.0067%(+0.067)#4,886
28.Farmingville0.071%0.068%(+0.003)#5560.0067%(+0.064)#4,887
29.Franklin Square0.069%0.068%(+0.000)#5570.0067%(+0.062)#4,888
30.Eastchester0.068%0.068%(-0.001)#5580.0067%(+0.061)#4,889
31.Valley Stream0.067%0.068%(-0.001)#5590.0067%(+0.060)#4,890
32.Lake Grove0.063%0.068%(-0.005)#5600.0067%(+0.057)#4,891
33.Baldwin0.047%0.068%(-0.021)#5610.0067%(+0.041)#4,892
34.Lido Beach0.038%0.068%(-0.030)#5860.0067%(+0.032)#6,216
35.Hempstead0.038%0.068%(-0.031)#5870.0067%(+0.031)#6,217
36.Coram0.031%0.068%(-0.038)#5880.0067%(+0.024)#6,218
37.Brentwood0.025%0.068%(-0.044)#5890.0067%(+0.018)#6,219
38.Centereach0.022%0.068%(-0.046)#5900.0067%(+0.015)#6,220
39.Utica0.012%0.068%(-0.056)#5910.0067%(+0.006)#6,221
40.Albany0.012%0.068%(-0.056)#5920.0067%(+0.005)#6,222
41.Tonawanda0.010%0.068%(-0.058)#5930.0067%(+0.004)#6,223
42.Fort Drum0.0061%0.068%(-0.062)#5940.0067%(-0.001)#6,224
43.Buffalo0.0047%0.068%(-0.064)#5950.0067%(-0.002)#6,225
44.Glen Cove0.0036%0.068%(-0.065)#5960.0067%(-0.003)#6,226
45.Rochester0.00047%0.068%(-0.068)#5970.0067%(-0.006)#6,227

Common Questions

What are the Top 10 Cities with the Highest Percentage of Immigrants from St. Vincent and the Grenadines in New York?
Top 10 Cities with the Highest Percentage of Immigrants from St. Vincent and the Grenadines in New York are:
What city has the Highest Percentage of Immigrants from St. Vincent and the Grenadines in New York?
Narrowsburg has the Highest Percentage of Immigrants from St. Vincent and the Grenadines in New York with 1.59%.
What is the Percentage of Immigrants from St. Vincent and the Grenadines in the State of New York?
Percentage of Immigrants from St. Vincent and the Grenadines in New York is 0.068%.
What is the Percentage of Immigrants from St. Vincent and the Grenadines in the United States?
Percentage of Immigrants from St. Vincent and the Grenadines in the United States is 0.0067%.