Cities with the Highest Percentage of Paraguayan Population in New York
RELATED REPORTS & OPTIONS
Paraguayan
New York
Compare Cities
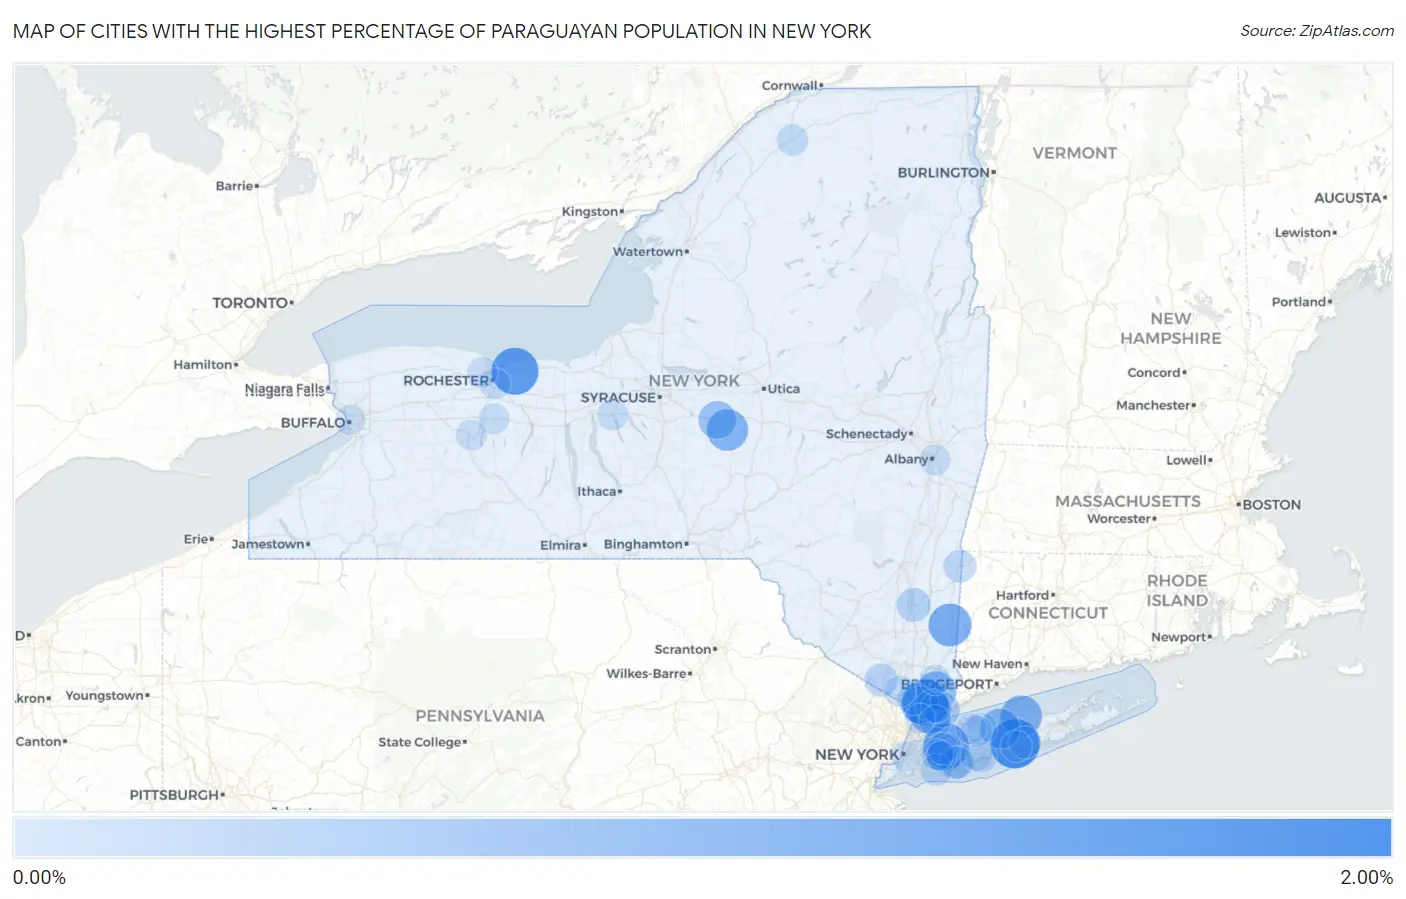
Map of Cities with the Highest Percentage of Paraguayan Population in New York
0.00%
2.00%
Cities with the Highest Percentage of Paraguayan Population in New York
| City | Paraguayan | vs State | vs National | |
| 1. | North Patchogue | 1.85% | 0.033%(+1.81)#1 | 0.0083%(+1.84)#17 |
| 2. | Webster | 1.61% | 0.033%(+1.57)#2 | 0.0083%(+1.60)#20 |
| 3. | Elmsford | 1.50% | 0.033%(+1.47)#3 | 0.0083%(+1.49)#22 |
| 4. | East Williston | 1.48% | 0.033%(+1.45)#4 | 0.0083%(+1.47)#23 |
| 5. | Pawling | 1.19% | 0.033%(+1.15)#5 | 0.0083%(+1.18)#27 |
| 6. | Scarsdale | 1.11% | 0.033%(+1.07)#6 | 0.0083%(+1.10)#29 |
| 7. | Sound Beach | 1.08% | 0.033%(+1.04)#7 | 0.0083%(+1.07)#30 |
| 8. | Hamilton | 1.06% | 0.033%(+1.02)#8 | 0.0083%(+1.05)#32 |
| 9. | St James | 0.95% | 0.033%(+0.913)#9 | 0.0083%(+0.938)#36 |
| 10. | Fairview Cdp Westchester County | 0.92% | 0.033%(+0.886)#10 | 0.0083%(+0.911)#38 |
| 11. | Armonk | 0.91% | 0.033%(+0.880)#11 | 0.0083%(+0.905)#39 |
| 12. | Morrisville | 0.72% | 0.033%(+0.688)#12 | 0.0083%(+0.713)#48 |
| 13. | Irvington | 0.70% | 0.033%(+0.665)#13 | 0.0083%(+0.690)#49 |
| 14. | Port Chester | 0.43% | 0.033%(+0.392)#14 | 0.0083%(+0.417)#74 |
| 15. | Floral Park | 0.38% | 0.033%(+0.344)#15 | 0.0083%(+0.369)#86 |
| 16. | Poughkeepsie | 0.35% | 0.033%(+0.320)#16 | 0.0083%(+0.345)#87 |
| 17. | White Plains | 0.32% | 0.033%(+0.292)#17 | 0.0083%(+0.316)#91 |
| 18. | West Hempstead | 0.32% | 0.033%(+0.290)#18 | 0.0083%(+0.315)#92 |
| 19. | Merrick | 0.30% | 0.033%(+0.272)#19 | 0.0083%(+0.296)#94 |
| 20. | Tuxedo Park | 0.29% | 0.033%(+0.253)#20 | 0.0083%(+0.277)#100 |
| 21. | Mineola | 0.27% | 0.033%(+0.239)#21 | 0.0083%(+0.264)#101 |
| 22. | Millerton | 0.23% | 0.033%(+0.199)#22 | 0.0083%(+0.224)#112 |
| 23. | Bellmore | 0.22% | 0.033%(+0.186)#23 | 0.0083%(+0.211)#119 |
| 24. | South Nyack | 0.22% | 0.033%(+0.185)#24 | 0.0083%(+0.210)#120 |
| 25. | North Bellport | 0.19% | 0.033%(+0.157)#25 | 0.0083%(+0.182)#130 |
| 26. | Mamaroneck | 0.18% | 0.033%(+0.142)#26 | 0.0083%(+0.167)#136 |
| 27. | Lawrence | 0.16% | 0.033%(+0.129)#27 | 0.0083%(+0.154)#144 |
| 28. | West Babylon | 0.14% | 0.033%(+0.112)#28 | 0.0083%(+0.137)#153 |
| 29. | East Northport | 0.13% | 0.033%(+0.100)#29 | 0.0083%(+0.125)#161 |
| 30. | Greenlawn | 0.13% | 0.033%(+0.099)#30 | 0.0083%(+0.124)#163 |
| 31. | Potsdam | 0.12% | 0.033%(+0.083)#31 | 0.0083%(+0.108)#172 |
| 32. | Hillcrest | 0.11% | 0.033%(+0.077)#32 | 0.0083%(+0.102)#180 |
| 33. | Garden City Park | 0.10% | 0.033%(+0.070)#33 | 0.0083%(+0.095)#187 |
| 34. | Auburn | 0.097% | 0.033%(+0.064)#34 | 0.0083%(+0.089)#195 |
| 35. | Lima | 0.089% | 0.033%(+0.056)#35 | 0.0083%(+0.081)#203 |
| 36. | Elmont | 0.087% | 0.033%(+0.054)#36 | 0.0083%(+0.079)#206 |
| 37. | Brighton | 0.084% | 0.033%(+0.051)#37 | 0.0083%(+0.076)#211 |
| 38. | Patchogue | 0.081% | 0.033%(+0.048)#38 | 0.0083%(+0.073)#214 |
| 39. | East Setauket | 0.078% | 0.033%(+0.045)#39 | 0.0083%(+0.070)#216 |
| 40. | Geneseo | 0.078% | 0.033%(+0.045)#40 | 0.0083%(+0.069)#217 |
| 41. | Rensselaer | 0.065% | 0.033%(+0.032)#41 | 0.0083%(+0.057)#234 |
| 42. | Harrison | 0.063% | 0.033%(+0.029)#42 | 0.0083%(+0.054)#240 |
| 43. | Greece | 0.062% | 0.033%(+0.029)#43 | 0.0083%(+0.054)#241 |
| 44. | Babylon | 0.057% | 0.033%(+0.024)#44 | 0.0083%(+0.049)#253 |
| 45. | New York | 0.048% | 0.033%(+0.015)#45 | 0.0083%(+0.040)#276 |
| 46. | Mount Kisco | 0.037% | 0.033%(+0.004)#46 | 0.0083%(+0.029)#302 |
| 47. | Huntington | 0.036% | 0.033%(+0.003)#47 | 0.0083%(+0.027)#309 |
| 48. | Franklin Square | 0.013% | 0.033%(-0.021)#48 | 0.0083%(+0.004)#410 |
| 49. | Yonkers | 0.0091% | 0.033%(-0.024)#49 | 0.0083%(+0.001)#434 |
| 50. | Buffalo | 0.0051% | 0.033%(-0.028)#50 | 0.0083%(-0.003)#459 |
Common Questions
What are the Top 10 Cities with the Highest Percentage of Paraguayan Population in New York?
Top 10 Cities with the Highest Percentage of Paraguayan Population in New York are:
#1
1.85%
#2
1.61%
#3
1.50%
#4
1.48%
#5
1.19%
#6
1.11%
#7
1.08%
#8
1.06%
#9
0.95%
#10
0.91%
What city has the Highest Percentage of Paraguayan Population in New York?
North Patchogue has the Highest Percentage of Paraguayan Population in New York with 1.85%.
What is the Percentage of Paraguayan Population in the State of New York?
Percentage of Paraguayan Population in New York is 0.033%.
What is the Percentage of Paraguayan Population in the United States?
Percentage of Paraguayan Population in the United States is 0.0083%.