Cities with the Most Immigrants from Iran in New York
RELATED REPORTS & OPTIONS
Iran
New York
Compare Cities
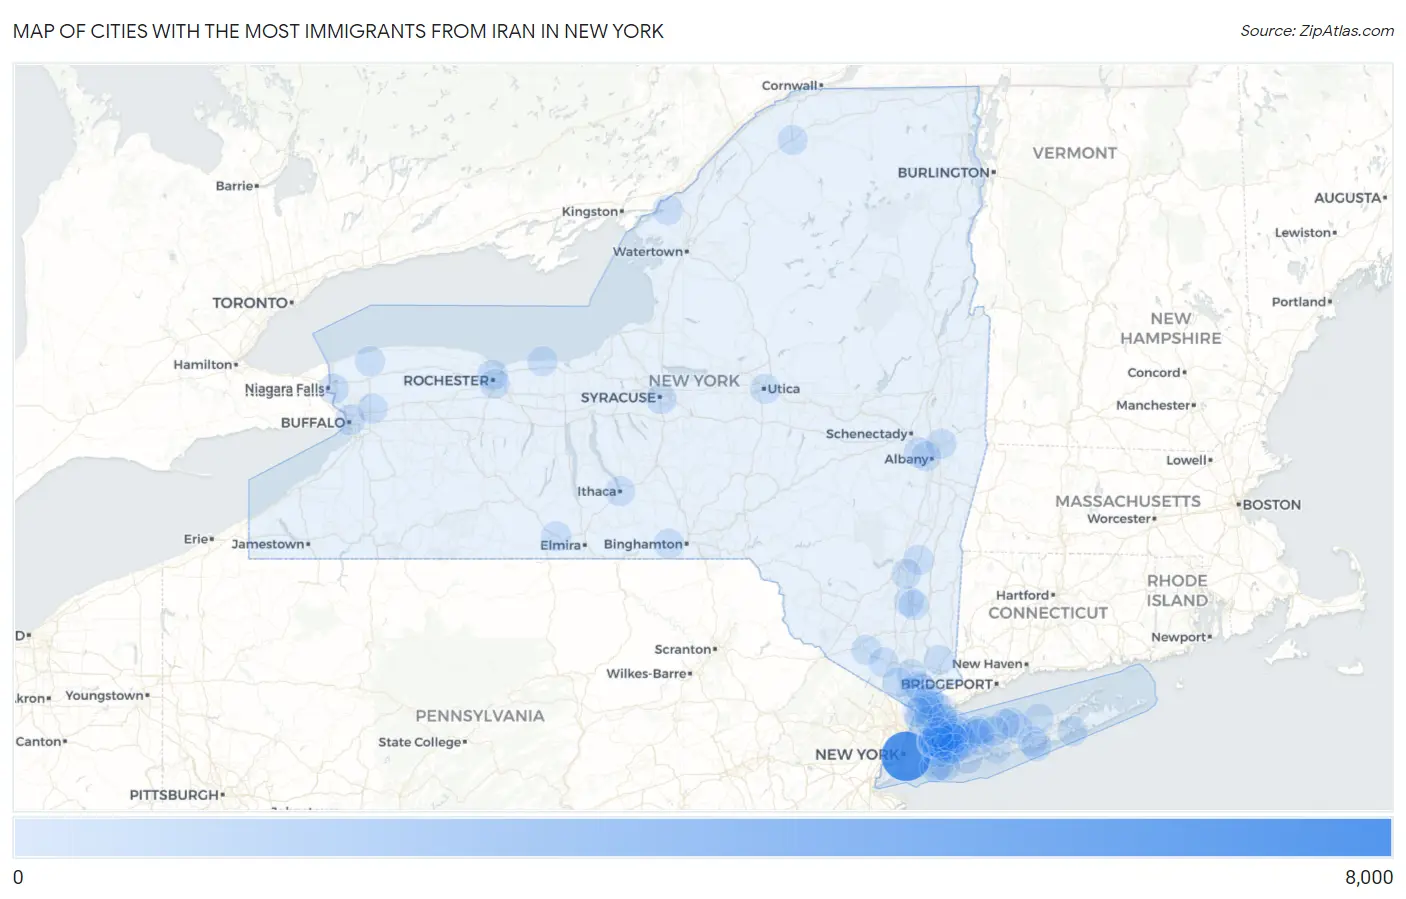
Map of Cities with the Most Immigrants from Iran in New York
0
8,000
Cities with the Most Immigrants from Iran in New York
| City | Iran | vs State | vs National | |
| 1. | New York | 7,791 | 18,283(42.61%)#1 | 391,354(1.99%)#5 |
| 2. | Great Neck | 1,172 | 18,283(6.41%)#2 | 391,354(0.30%)#32 |
| 3. | Kings Point | 843 | 18,283(4.61%)#3 | 391,354(0.22%)#50 |
| 4. | Great Neck Plaza | 503 | 18,283(2.75%)#4 | 391,354(0.13%)#101 |
| 5. | Roslyn Heights | 283 | 18,283(1.55%)#5 | 391,354(0.07%)#196 |
| 6. | Saddle Rock | 260 | 18,283(1.42%)#6 | 391,354(0.07%)#217 |
| 7. | Yonkers | 234 | 18,283(1.28%)#7 | 391,354(0.06%)#244 |
| 8. | Rochester | 207 | 18,283(1.13%)#8 | 391,354(0.05%)#276 |
| 9. | Great Neck Estates | 207 | 18,283(1.13%)#9 | 391,354(0.05%)#278 |
| 10. | Old Westbury | 191 | 18,283(1.04%)#10 | 391,354(0.05%)#294 |
| 11. | North Hills | 183 | 18,283(1.00%)#11 | 391,354(0.05%)#303 |
| 12. | Syracuse | 179 | 18,283(0.98%)#12 | 391,354(0.05%)#306 |
| 13. | Great Neck Gardens | 176 | 18,283(0.96%)#13 | 391,354(0.04%)#315 |
| 14. | Westmere | 168 | 18,283(0.92%)#14 | 391,354(0.04%)#329 |
| 15. | Kensington | 155 | 18,283(0.85%)#15 | 391,354(0.04%)#360 |
| 16. | Hewlett | 122 | 18,283(0.67%)#16 | 391,354(0.03%)#445 |
| 17. | Saddle Rock Estates | 121 | 18,283(0.66%)#17 | 391,354(0.03%)#453 |
| 18. | Albertson | 109 | 18,283(0.60%)#18 | 391,354(0.03%)#493 |
| 19. | Ossining | 103 | 18,283(0.56%)#19 | 391,354(0.03%)#511 |
| 20. | Thomaston | 100 | 18,283(0.55%)#20 | 391,354(0.03%)#525 |
| 21. | Troy | 98 | 18,283(0.54%)#21 | 391,354(0.03%)#531 |
| 22. | Searingtown | 96 | 18,283(0.53%)#22 | 391,354(0.02%)#545 |
| 23. | Niagara Falls | 93 | 18,283(0.51%)#23 | 391,354(0.02%)#557 |
| 24. | Manorhaven | 88 | 18,283(0.48%)#24 | 391,354(0.02%)#585 |
| 25. | Glen Head | 86 | 18,283(0.47%)#25 | 391,354(0.02%)#597 |
| 26. | Harrison | 84 | 18,283(0.46%)#26 | 391,354(0.02%)#606 |
| 27. | Port Jefferson Station | 83 | 18,283(0.45%)#27 | 391,354(0.02%)#612 |
| 28. | Buffalo | 78 | 18,283(0.43%)#28 | 391,354(0.02%)#642 |
| 29. | Plainview | 78 | 18,283(0.43%)#29 | 391,354(0.02%)#643 |
| 30. | Hicksville | 77 | 18,283(0.42%)#30 | 391,354(0.02%)#650 |
| 31. | Coram | 76 | 18,283(0.42%)#31 | 391,354(0.02%)#658 |
| 32. | Dix Hills | 75 | 18,283(0.41%)#32 | 391,354(0.02%)#667 |
| 33. | Flower Hill | 72 | 18,283(0.39%)#33 | 391,354(0.02%)#694 |
| 34. | Muttontown | 72 | 18,283(0.39%)#34 | 391,354(0.02%)#695 |
| 35. | Briarcliff Manor | 71 | 18,283(0.39%)#35 | 391,354(0.02%)#704 |
| 36. | Oyster Bay | 71 | 18,283(0.39%)#36 | 391,354(0.02%)#705 |
| 37. | Garden City | 67 | 18,283(0.37%)#37 | 391,354(0.02%)#725 |
| 38. | Roslyn Estates | 65 | 18,283(0.36%)#38 | 391,354(0.02%)#742 |
| 39. | Roslyn | 63 | 18,283(0.34%)#39 | 391,354(0.02%)#764 |
| 40. | Goshen | 61 | 18,283(0.33%)#40 | 391,354(0.02%)#779 |
| 41. | Cedarhurst | 55 | 18,283(0.30%)#41 | 391,354(0.01%)#828 |
| 42. | Greenvale | 52 | 18,283(0.28%)#42 | 391,354(0.01%)#860 |
| 43. | Glen Cove | 51 | 18,283(0.28%)#43 | 391,354(0.01%)#863 |
| 44. | Harbor Hills | 51 | 18,283(0.28%)#44 | 391,354(0.01%)#872 |
| 45. | Harris Hill | 50 | 18,283(0.27%)#45 | 391,354(0.01%)#884 |
| 46. | Huntington Station | 48 | 18,283(0.26%)#46 | 391,354(0.01%)#903 |
| 47. | Williston Park | 47 | 18,283(0.26%)#47 | 391,354(0.01%)#916 |
| 48. | Albany | 43 | 18,283(0.24%)#48 | 391,354(0.01%)#959 |
| 49. | Ardsley | 43 | 18,283(0.24%)#49 | 391,354(0.01%)#968 |
| 50. | Port Chester | 42 | 18,283(0.23%)#50 | 391,354(0.01%)#975 |
| 51. | Highland | 42 | 18,283(0.23%)#51 | 391,354(0.01%)#982 |
| 52. | Heritage Hills | 41 | 18,283(0.22%)#52 | 391,354(0.01%)#996 |
| 53. | East Northport | 40 | 18,283(0.22%)#53 | 391,354(0.01%)#1,004 |
| 54. | Scarsdale | 40 | 18,283(0.22%)#54 | 391,354(0.01%)#1,005 |
| 55. | Monroe | 40 | 18,283(0.22%)#55 | 391,354(0.01%)#1,010 |
| 56. | Brighton | 39 | 18,283(0.21%)#56 | 391,354(0.01%)#1,018 |
| 57. | Port Washington | 39 | 18,283(0.21%)#57 | 391,354(0.01%)#1,023 |
| 58. | Endicott | 39 | 18,283(0.21%)#58 | 391,354(0.01%)#1,026 |
| 59. | White Plains | 37 | 18,283(0.20%)#59 | 391,354(0.01%)#1,049 |
| 60. | Floral Park | 37 | 18,283(0.20%)#60 | 391,354(0.01%)#1,057 |
| 61. | Greenville Cdp Westchester County | 37 | 18,283(0.20%)#61 | 391,354(0.01%)#1,060 |
| 62. | Syosset | 35 | 18,283(0.19%)#62 | 391,354(0.01%)#1,089 |
| 63. | Corning | 35 | 18,283(0.19%)#63 | 391,354(0.01%)#1,092 |
| 64. | Valley Cottage | 34 | 18,283(0.19%)#64 | 391,354(0.01%)#1,119 |
| 65. | East Hills | 34 | 18,283(0.19%)#65 | 391,354(0.01%)#1,120 |
| 66. | Carle Place | 34 | 18,283(0.19%)#66 | 391,354(0.01%)#1,122 |
| 67. | Pomona | 34 | 18,283(0.19%)#67 | 391,354(0.01%)#1,123 |
| 68. | Utica | 32 | 18,283(0.18%)#68 | 391,354(0.01%)#1,140 |
| 69. | New Rochelle | 31 | 18,283(0.17%)#69 | 391,354(0.01%)#1,158 |
| 70. | Upper Brookville | 31 | 18,283(0.17%)#70 | 391,354(0.01%)#1,191 |
| 71. | Red Hook | 31 | 18,283(0.17%)#71 | 391,354(0.01%)#1,192 |
| 72. | Newfane | 30 | 18,283(0.16%)#72 | 391,354(0.01%)#1,211 |
| 73. | Valhalla | 30 | 18,283(0.16%)#73 | 391,354(0.01%)#1,212 |
| 74. | Ithaca | 29 | 18,283(0.16%)#74 | 391,354(0.01%)#1,220 |
| 75. | Hampton Bays | 29 | 18,283(0.16%)#75 | 391,354(0.01%)#1,225 |
| 76. | Greenlawn | 29 | 18,283(0.16%)#76 | 391,354(0.01%)#1,227 |
| 77. | Stony Brook University | 29 | 18,283(0.16%)#77 | 391,354(0.01%)#1,230 |
| 78. | Shirley | 28 | 18,283(0.15%)#78 | 391,354(0.01%)#1,245 |
| 79. | Bayville | 28 | 18,283(0.15%)#79 | 391,354(0.01%)#1,256 |
| 80. | Old Brookville | 28 | 18,283(0.15%)#80 | 391,354(0.01%)#1,261 |
| 81. | Elwood | 27 | 18,283(0.15%)#81 | 391,354(0.01%)#1,285 |
| 82. | Potsdam | 27 | 18,283(0.15%)#82 | 391,354(0.01%)#1,288 |
| 83. | Islip Terrace | 27 | 18,283(0.15%)#83 | 391,354(0.01%)#1,292 |
| 84. | Salisbury | 26 | 18,283(0.14%)#84 | 391,354(0.01%)#1,310 |
| 85. | Poughkeepsie | 25 | 18,283(0.14%)#85 | 391,354(0.01%)#1,330 |
| 86. | Brookville | 25 | 18,283(0.14%)#86 | 391,354(0.01%)#1,347 |
| 87. | Rye | 24 | 18,283(0.13%)#87 | 391,354(0.01%)#1,358 |
| 88. | Hastings On Hudson | 24 | 18,283(0.13%)#88 | 391,354(0.01%)#1,361 |
| 89. | Pultneyville | 24 | 18,283(0.13%)#89 | 391,354(0.01%)#1,363 |
| 90. | Wading River | 23 | 18,283(0.13%)#90 | 391,354(0.01%)#1,379 |
| 91. | Montrose | 23 | 18,283(0.13%)#91 | 391,354(0.01%)#1,382 |
| 92. | East Massapequa | 22 | 18,283(0.12%)#92 | 391,354(0.01%)#1,399 |
| 93. | Clayton | 22 | 18,283(0.12%)#93 | 391,354(0.01%)#1,412 |
| 94. | New Hamburg | 22 | 18,283(0.12%)#94 | 391,354(0.01%)#1,413 |
| 95. | Mastic Beach | 21 | 18,283(0.11%)#95 | 391,354(0.01%)#1,427 |
| 96. | Manhasset | 21 | 18,283(0.11%)#96 | 391,354(0.01%)#1,432 |
| 97. | Oceanside | 20 | 18,283(0.11%)#97 | 391,354(0.01%)#1,445 |
| 98. | Smithtown | 20 | 18,283(0.11%)#98 | 391,354(0.01%)#1,448 |
| 99. | Port Ewen | 20 | 18,283(0.11%)#99 | 391,354(0.01%)#1,462 |
| 100. | Sands Point | 20 | 18,283(0.11%)#100 | 391,354(0.01%)#1,466 |
Common Questions
What are the Top 10 Cities with the Most Immigrants from Iran in New York?
Top 10 Cities with the Most Immigrants from Iran in New York are:
#1
7,791
#2
1,172
#3
843
#4
503
#5
283
#6
260
#7
234
#8
207
#9
207
#10
191
What city has the Most Immigrants from Iran in New York?
New York has the Most Immigrants from Iran in New York with 7,791.
What is the Total Immigrants from Iran in the State of New York?
Total Immigrants from Iran in New York is 18,283.
What is the Total Immigrants from Iran in the United States?
Total Immigrants from Iran in the United States is 391,354.