Delhi, NY Map & Demographics
Delhi Map
Delhi Overview
$20,954
PER CAPITA INCOME
$90,909
AVG FAMILY INCOME
$55,486
AVG HOUSEHOLD INCOME
24.9%
WAGE / INCOME GAP [ % ]
75.1¢/ $1
WAGE / INCOME GAP [ $ ]
$8,438
FAMILY INCOME DEFICIT
0.46
INEQUALITY / GINI INDEX
3,148
TOTAL POPULATION
1,671
MALE POPULATION
1,477
FEMALE POPULATION
113.13
MALES / 100 FEMALES
88.39
FEMALES / 100 MALES
20.9
MEDIAN AGE
2.9
AVG FAMILY SIZE
2.1
AVG HOUSEHOLD SIZE
1,324
LABOR FORCE [ PEOPLE ]
46.0%
PERCENT IN LABOR FORCE
5.5%
UNEMPLOYMENT RATE
Delhi Zip Codes
Delhi Area Codes
Income in Delhi
Income Overview in Delhi
Per Capita Income in Delhi is $20,954, while median incomes of families and households are $90,909 and $55,486 respectively.
| Characteristic | Number | Measure |
| Per Capita Income | 3,148 | $20,954 |
| Median Family Income | 390 | $90,909 |
| Mean Family Income | 390 | $95,620 |
| Median Household Income | 801 | $55,486 |
| Mean Household Income | 801 | $70,542 |
| Income Deficit | 390 | $8,438 |
| Wage / Income Gap (%) | 3,148 | 24.94% |
| Wage / Income Gap ($) | 3,148 | 75.06¢ per $1 |
| Gini / Inequality Index | 3,148 | 0.46 |
Earnings by Sex in Delhi
Average Earnings in Delhi are $9,829, $11,313 for men and $8,491 for women, a difference of 24.9%.
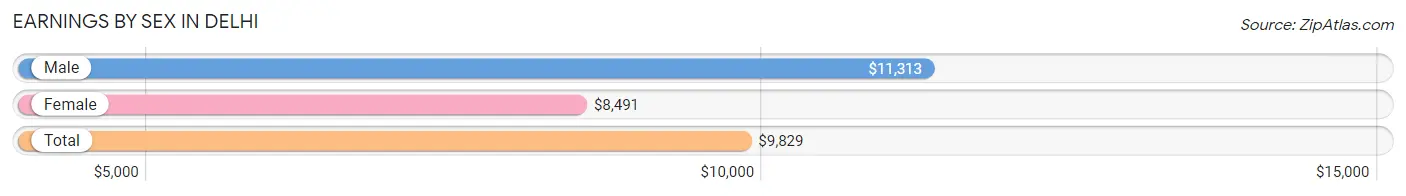
| Sex | Number | Average Earnings |
| Male | 981 (55.3%) | $11,313 |
| Female | 793 (44.7%) | $8,491 |
| Total | 1,774 (100.0%) | $9,829 |
Earnings by Sex by Income Bracket in Delhi
The most common earnings brackets in Delhi are $2,499 or less for men (256 | 26.1%) and $2,499 or less for women (134 | 16.9%).
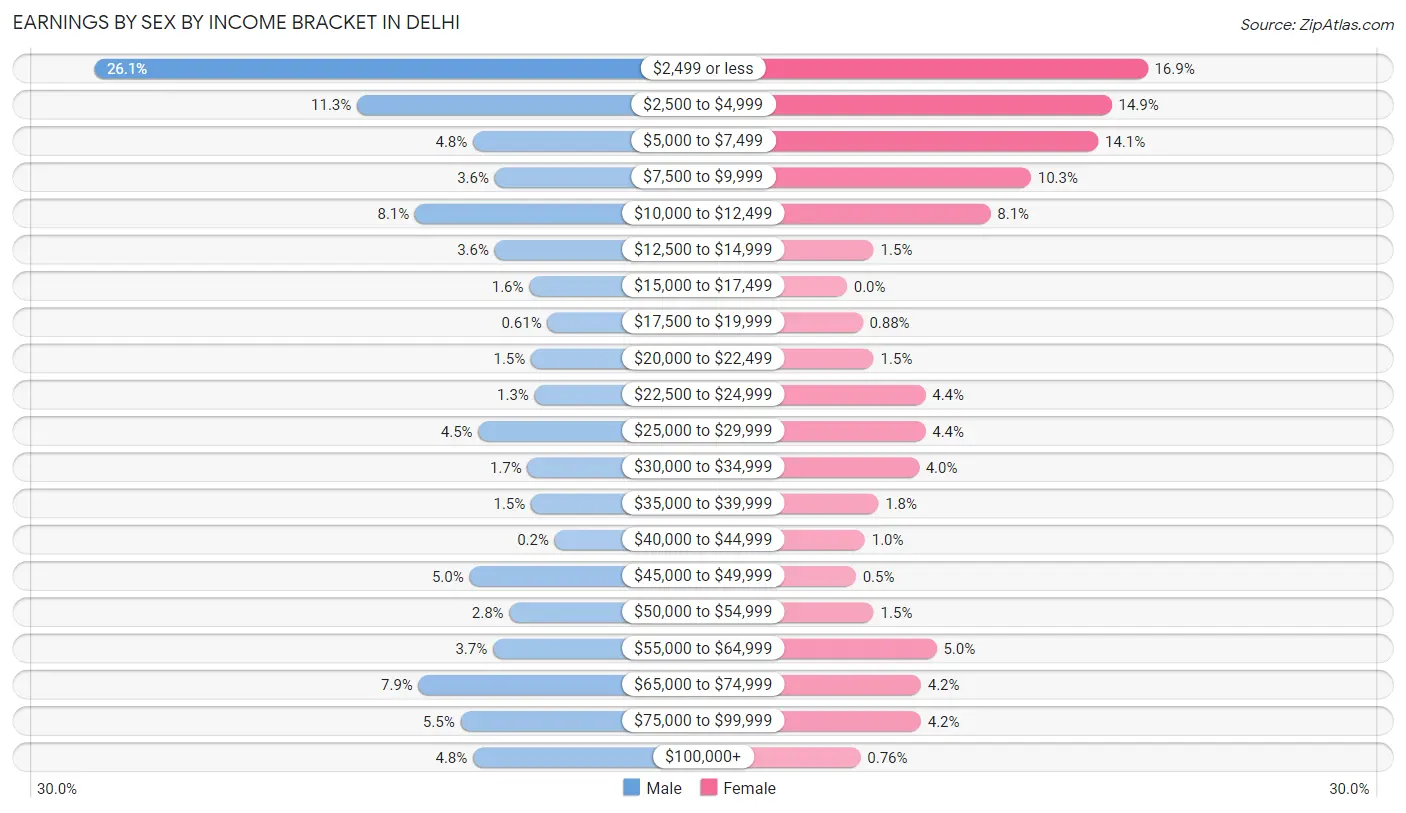
| Income | Male | Female |
| $2,499 or less | 256 (26.1%) | 134 (16.9%) |
| $2,500 to $4,999 | 111 (11.3%) | 118 (14.9%) |
| $5,000 to $7,499 | 47 (4.8%) | 112 (14.1%) |
| $7,500 to $9,999 | 35 (3.6%) | 82 (10.3%) |
| $10,000 to $12,499 | 79 (8.1%) | 64 (8.1%) |
| $12,500 to $14,999 | 35 (3.6%) | 12 (1.5%) |
| $15,000 to $17,499 | 16 (1.6%) | 0 (0.0%) |
| $17,500 to $19,999 | 6 (0.6%) | 7 (0.9%) |
| $20,000 to $22,499 | 15 (1.5%) | 12 (1.5%) |
| $22,500 to $24,999 | 13 (1.3%) | 35 (4.4%) |
| $25,000 to $29,999 | 44 (4.5%) | 35 (4.4%) |
| $30,000 to $34,999 | 17 (1.7%) | 32 (4.0%) |
| $35,000 to $39,999 | 15 (1.5%) | 14 (1.8%) |
| $40,000 to $44,999 | 2 (0.2%) | 8 (1.0%) |
| $45,000 to $49,999 | 49 (5.0%) | 4 (0.5%) |
| $50,000 to $54,999 | 27 (2.8%) | 12 (1.5%) |
| $55,000 to $64,999 | 36 (3.7%) | 40 (5.0%) |
| $65,000 to $74,999 | 77 (7.9%) | 33 (4.2%) |
| $75,000 to $99,999 | 54 (5.5%) | 33 (4.2%) |
| $100,000+ | 47 (4.8%) | 6 (0.8%) |
| Total | 981 (100.0%) | 793 (100.0%) |
Earnings by Sex by Educational Attainment in Delhi
Average earnings in Delhi are $49,583 for men and $36,389 for women, a difference of 26.6%. Men with an educational attainment of graduate degree enjoy the highest average annual earnings of $66,042, while those with high school diploma education earn the least with $31,944. Women with an educational attainment of graduate degree earn the most with the average annual earnings of $56,359, while those with high school diploma education have the smallest earnings of $11,680.
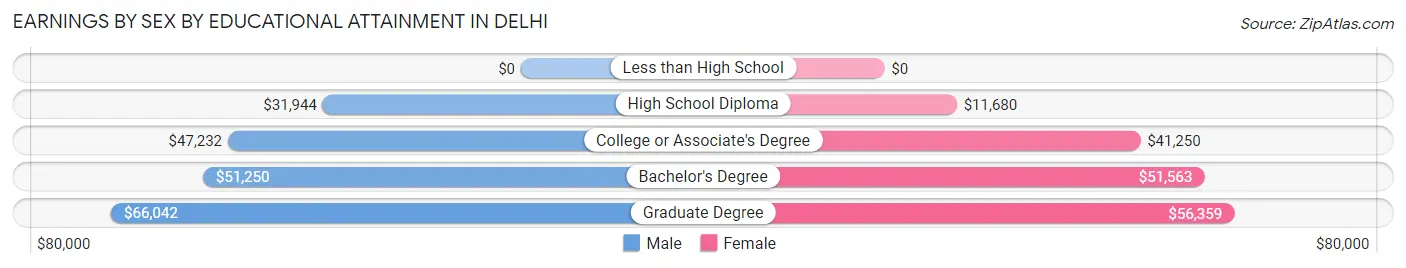
| Educational Attainment | Male Income | Female Income |
| Less than High School | - | - |
| High School Diploma | $31,944 | $11,680 |
| College or Associate's Degree | $47,232 | $41,250 |
| Bachelor's Degree | $51,250 | $51,563 |
| Graduate Degree | $66,042 | $56,359 |
| Total | $49,583 | $36,389 |
Family Income in Delhi
Family Income Brackets in Delhi
According to the Delhi family income data, there are 94 families falling into the $50,000 to $74,999 income range, which is the most common income bracket and makes up 24.1% of all families. Conversely, the less than $10,000 income bracket is the least frequent group with only 3 families (0.8%) belonging to this category.
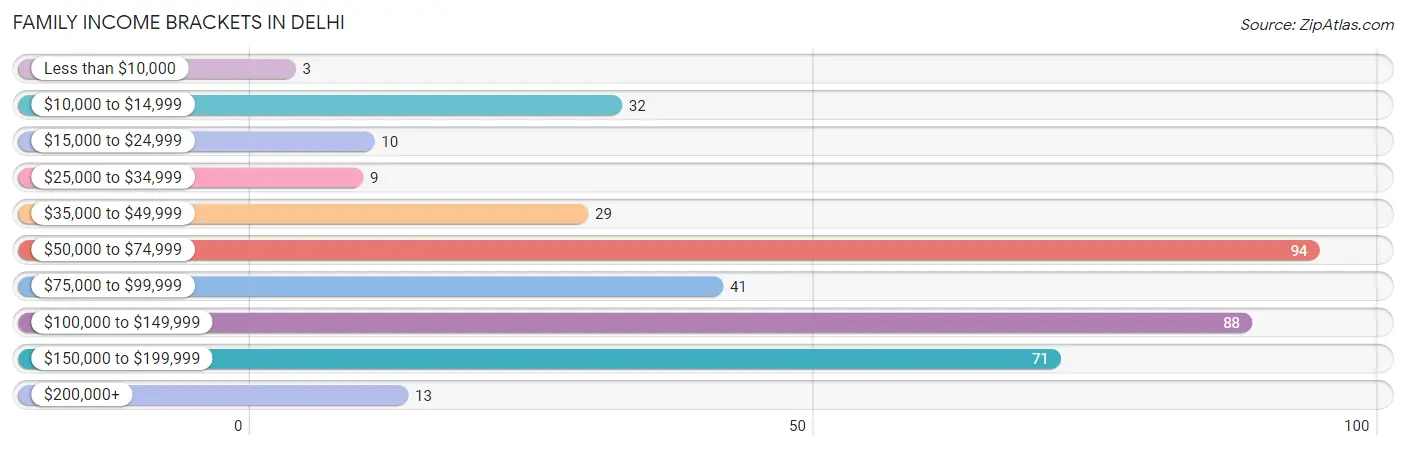
| Income Bracket | # Families | % Families |
| Less than $10,000 | 3 | 0.8% |
| $10,000 to $14,999 | 32 | 8.2% |
| $15,000 to $24,999 | 10 | 2.6% |
| $25,000 to $34,999 | 9 | 2.3% |
| $35,000 to $49,999 | 29 | 7.4% |
| $50,000 to $74,999 | 94 | 24.1% |
| $75,000 to $99,999 | 41 | 10.5% |
| $100,000 to $149,999 | 88 | 22.6% |
| $150,000 to $199,999 | 71 | 18.2% |
| $200,000+ | 13 | 3.3% |
Family Income by Famaliy Size in Delhi
4-person families (70 | 17.9%) account for the highest median family income in Delhi with $98,438 per family, while 2-person families (223 | 57.2%) have the highest median income of $45,625 per family member.
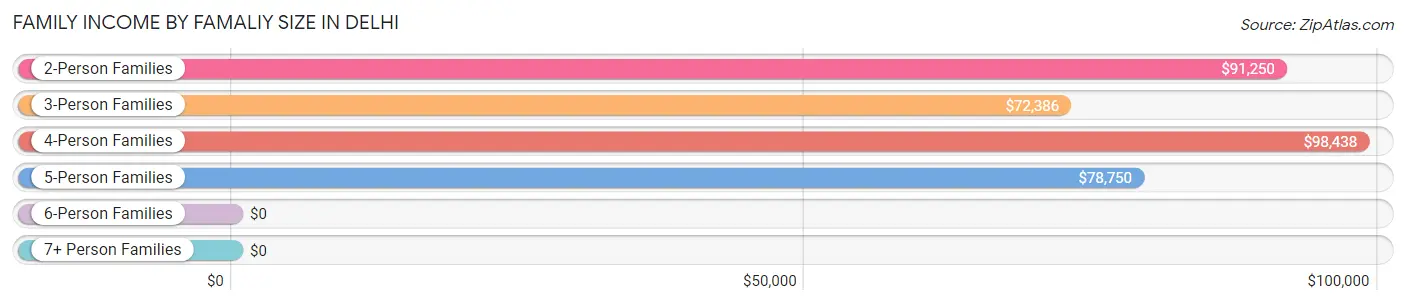
| Income Bracket | # Families | Median Income |
| 2-Person Families | 223 (57.2%) | $91,250 |
| 3-Person Families | 77 (19.7%) | $72,386 |
| 4-Person Families | 70 (17.9%) | $98,438 |
| 5-Person Families | 20 (5.1%) | $78,750 |
| 6-Person Families | 0 (0.0%) | $0 |
| 7+ Person Families | 0 (0.0%) | $0 |
| Total | 390 (100.0%) | $90,909 |
Family Income by Number of Earners in Delhi
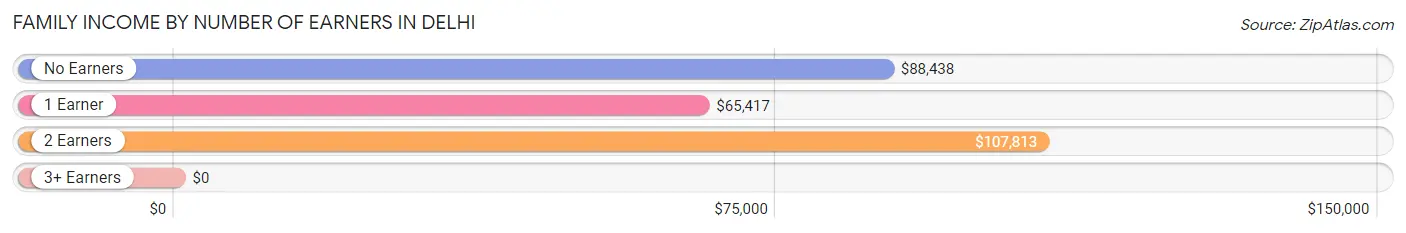
| Number of Earners | # Families | Median Income |
| No Earners | 47 (12.0%) | $88,438 |
| 1 Earner | 166 (42.6%) | $65,417 |
| 2 Earners | 149 (38.2%) | $107,813 |
| 3+ Earners | 28 (7.2%) | $0 |
| Total | 390 (100.0%) | $90,909 |
Household Income in Delhi
Household Income Brackets in Delhi
With 168 households falling in the category, the $50,000 to $74,999 income range is the most frequent in Delhi, accounting for 21.0% of all households. In contrast, only 25 households (3.1%) fall into the $200,000+ income bracket, making it the least populous group.
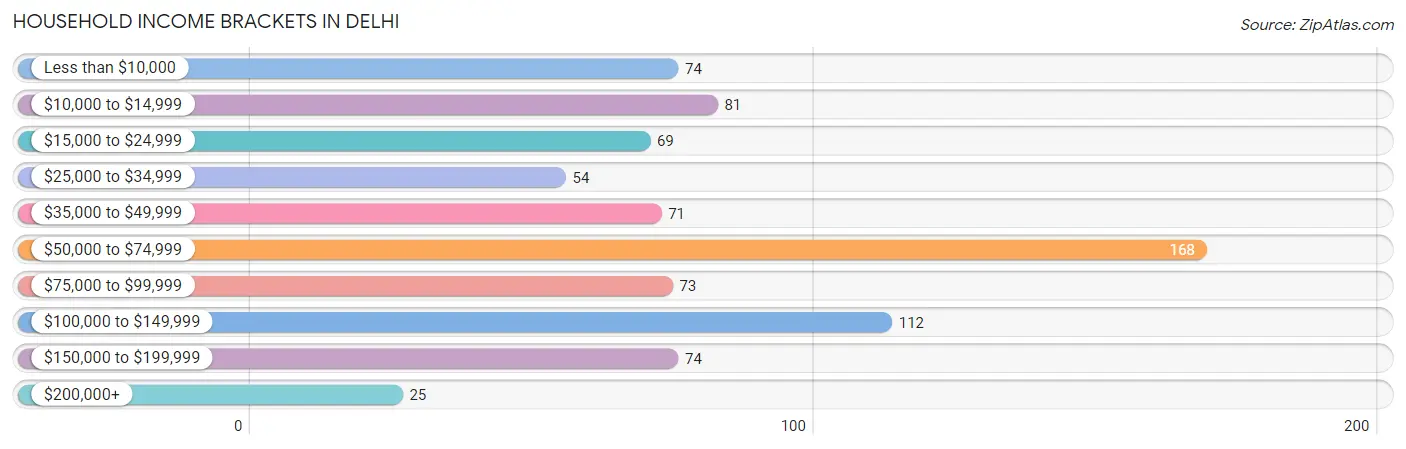
| Income Bracket | # Households | % Households |
| Less than $10,000 | 74 | 9.2% |
| $10,000 to $14,999 | 81 | 10.1% |
| $15,000 to $24,999 | 69 | 8.6% |
| $25,000 to $34,999 | 54 | 6.7% |
| $35,000 to $49,999 | 71 | 8.9% |
| $50,000 to $74,999 | 168 | 21.0% |
| $75,000 to $99,999 | 73 | 9.1% |
| $100,000 to $149,999 | 112 | 14.0% |
| $150,000 to $199,999 | 74 | 9.2% |
| $200,000+ | 25 | 3.1% |
Household Income by Householder Age in Delhi
The median household income in Delhi is $55,486, with the highest median household income of $70,583 found in the 25 to 44 years age bracket for the primary householder. A total of 187 households (23.4%) fall into this category. Meanwhile, the 15 to 24 years age bracket for the primary householder has the lowest median household income of $20,625, with 41 households (5.1%) in this group.
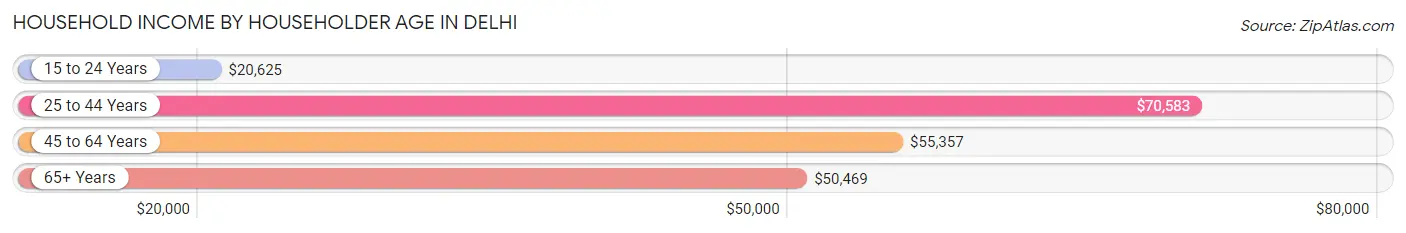
| Income Bracket | # Households | Median Income |
| 15 to 24 Years | 41 (5.1%) | $20,625 |
| 25 to 44 Years | 187 (23.4%) | $70,583 |
| 45 to 64 Years | 284 (35.5%) | $55,357 |
| 65+ Years | 289 (36.1%) | $50,469 |
| Total | 801 (100.0%) | $55,486 |
Poverty in Delhi
Income Below Poverty by Sex and Age in Delhi
With 15.8% poverty level for males and 19.4% for females among the residents of Delhi, 12 to 14 year old males and 18 to 24 year old females are the most vulnerable to poverty, with 18 males (38.3%) and 55 females (52.9%) in their respective age groups living below the poverty level.
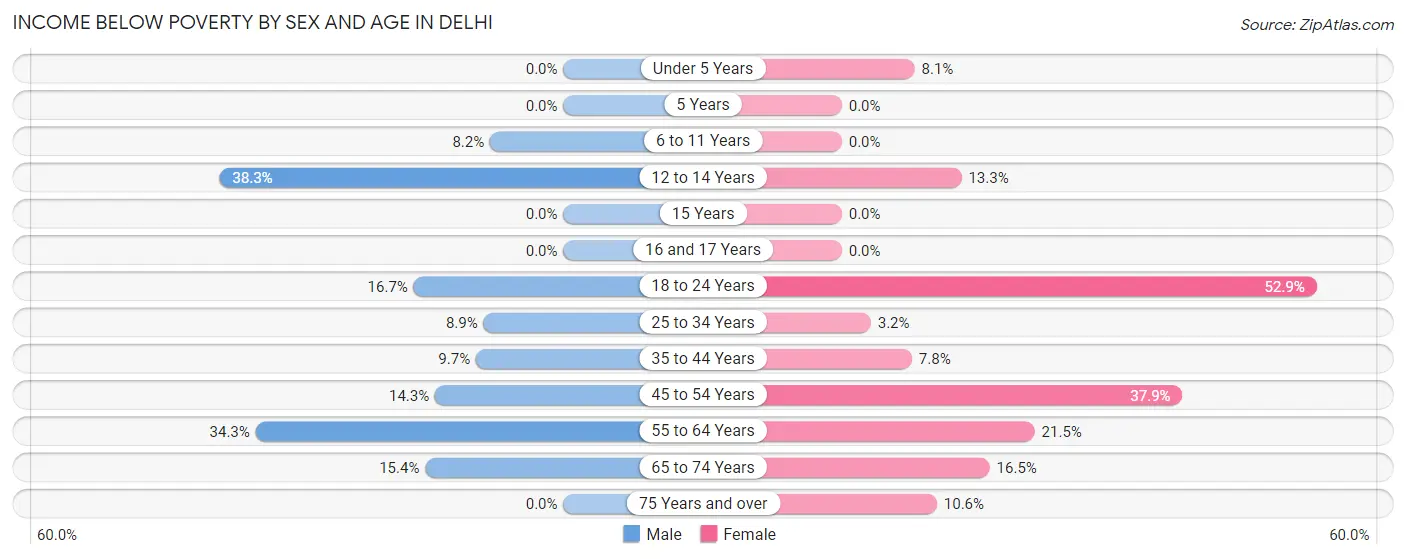
| Age Bracket | Male | Female |
| Under 5 Years | 0 (0.0%) | 3 (8.1%) |
| 5 Years | 0 (0.0%) | 0 (0.0%) |
| 6 to 11 Years | 4 (8.2%) | 0 (0.0%) |
| 12 to 14 Years | 18 (38.3%) | 2 (13.3%) |
| 15 Years | 0 (0.0%) | 0 (0.0%) |
| 16 and 17 Years | 0 (0.0%) | 0 (0.0%) |
| 18 to 24 Years | 9 (16.7%) | 55 (52.9%) |
| 25 to 34 Years | 8 (8.9%) | 2 (3.2%) |
| 35 to 44 Years | 11 (9.7%) | 5 (7.8%) |
| 45 to 54 Years | 16 (14.3%) | 33 (37.9%) |
| 55 to 64 Years | 49 (34.3%) | 29 (21.5%) |
| 65 to 74 Years | 16 (15.4%) | 28 (16.5%) |
| 75 Years and over | 0 (0.0%) | 9 (10.6%) |
| Total | 131 (15.8%) | 166 (19.4%) |
Income Above Poverty by Sex and Age in Delhi
According to the poverty statistics in Delhi, males aged under 5 years and females aged 6 to 11 years are the age groups that are most secure financially, with 100.0% of males and 100.0% of females in these age groups living above the poverty line.
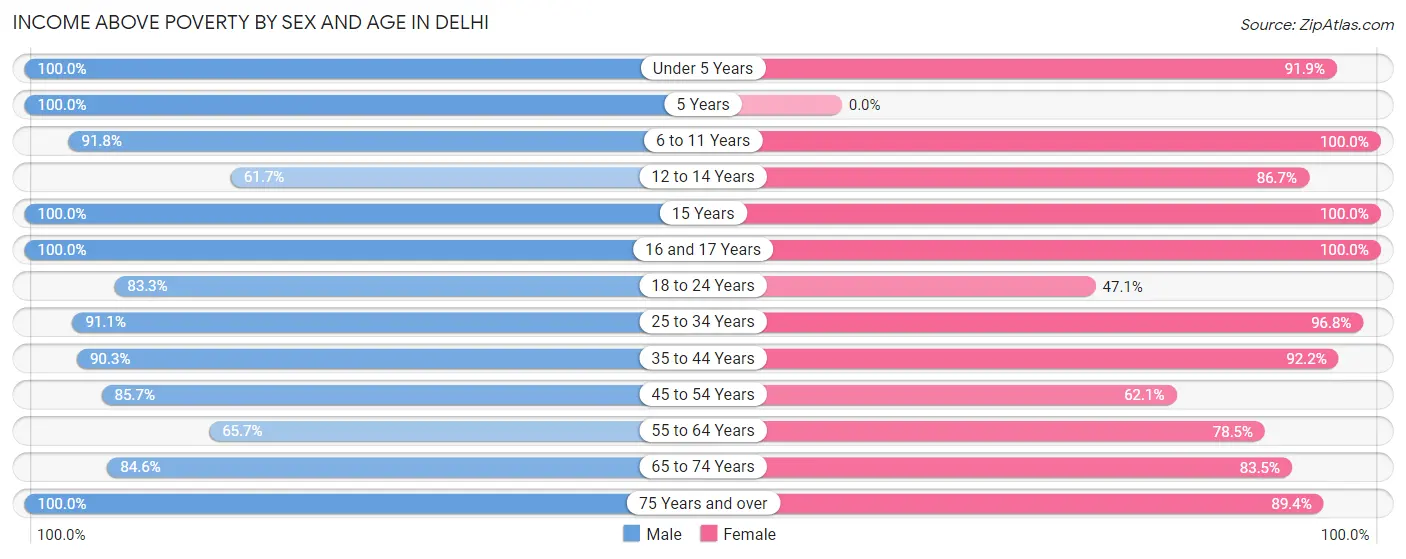
| Age Bracket | Male | Female |
| Under 5 Years | 39 (100.0%) | 34 (91.9%) |
| 5 Years | 6 (100.0%) | 0 (0.0%) |
| 6 to 11 Years | 45 (91.8%) | 68 (100.0%) |
| 12 to 14 Years | 29 (61.7%) | 13 (86.7%) |
| 15 Years | 3 (100.0%) | 5 (100.0%) |
| 16 and 17 Years | 21 (100.0%) | 26 (100.0%) |
| 18 to 24 Years | 45 (83.3%) | 49 (47.1%) |
| 25 to 34 Years | 82 (91.1%) | 60 (96.8%) |
| 35 to 44 Years | 102 (90.3%) | 59 (92.2%) |
| 45 to 54 Years | 96 (85.7%) | 54 (62.1%) |
| 55 to 64 Years | 94 (65.7%) | 106 (78.5%) |
| 65 to 74 Years | 88 (84.6%) | 142 (83.5%) |
| 75 Years and over | 51 (100.0%) | 76 (89.4%) |
| Total | 701 (84.3%) | 692 (80.6%) |
Income Below Poverty Among Married-Couple Families in Delhi
The poverty statistics for married-couple families in Delhi show that 5.2% or 14 of the total 267 families live below the poverty line. Families with 3 or 4 children have the highest poverty rate of 100.0%, comprising of 4 families. On the other hand, families with 1 or 2 children have the lowest poverty rate of 0.0%, which includes 0 families.
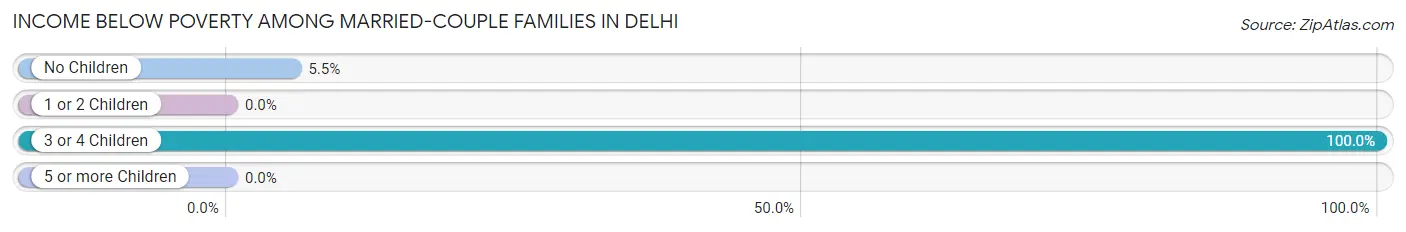
| Children | Above Poverty | Below Poverty |
| No Children | 171 (94.5%) | 10 (5.5%) |
| 1 or 2 Children | 82 (100.0%) | 0 (0.0%) |
| 3 or 4 Children | 0 (0.0%) | 4 (100.0%) |
| 5 or more Children | 0 (0.0%) | 0 (0.0%) |
| Total | 253 (94.8%) | 14 (5.2%) |
Income Below Poverty Among Single-Parent Households in Delhi
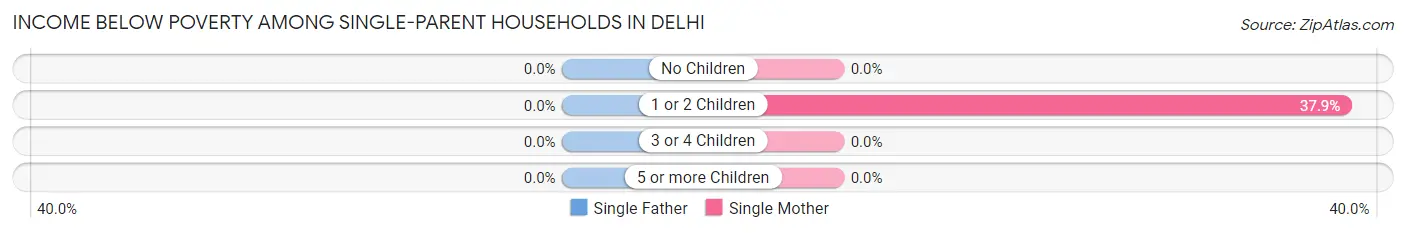
| Children | Single Father | Single Mother |
| No Children | 0 (0.0%) | 0 (0.0%) |
| 1 or 2 Children | 0 (0.0%) | 25 (37.9%) |
| 3 or 4 Children | 0 (0.0%) | 0 (0.0%) |
| 5 or more Children | 0 (0.0%) | 0 (0.0%) |
| Total | 0 (0.0%) | 25 (27.8%) |
Income Below Poverty Among Married-Couple vs Single-Parent Households in Delhi
The poverty data for Delhi shows that 14 of the married-couple family households (5.2%) and 25 of the single-parent households (20.3%) are living below the poverty level. Within the married-couple family households, those with 3 or 4 children have the highest poverty rate, with 4 households (100.0%) falling below the poverty line. Among the single-parent households, those with 1 or 2 children have the highest poverty rate, with 25 household (35.2%) living below poverty.
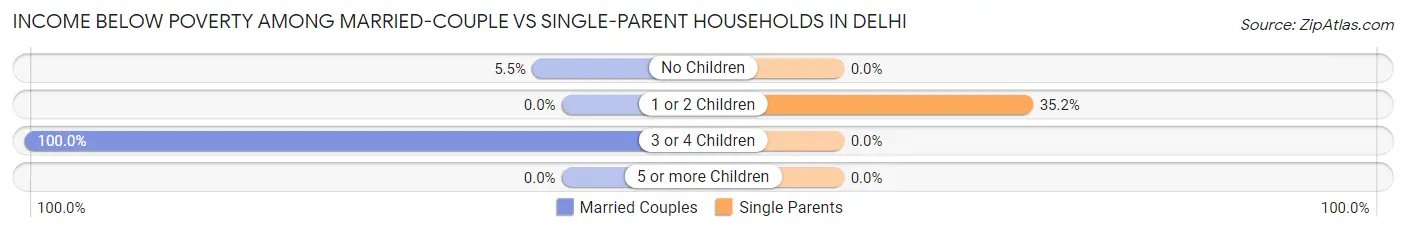
| Children | Married-Couple Families | Single-Parent Households |
| No Children | 10 (5.5%) | 0 (0.0%) |
| 1 or 2 Children | 0 (0.0%) | 25 (35.2%) |
| 3 or 4 Children | 4 (100.0%) | 0 (0.0%) |
| 5 or more Children | 0 (0.0%) | 0 (0.0%) |
| Total | 14 (5.2%) | 25 (20.3%) |
Race in Delhi
The most populous races in Delhi are White / Caucasian (2,695 | 85.6%), Hispanic or Latino (190 | 6.0%), and Two or more Races (134 | 4.3%).
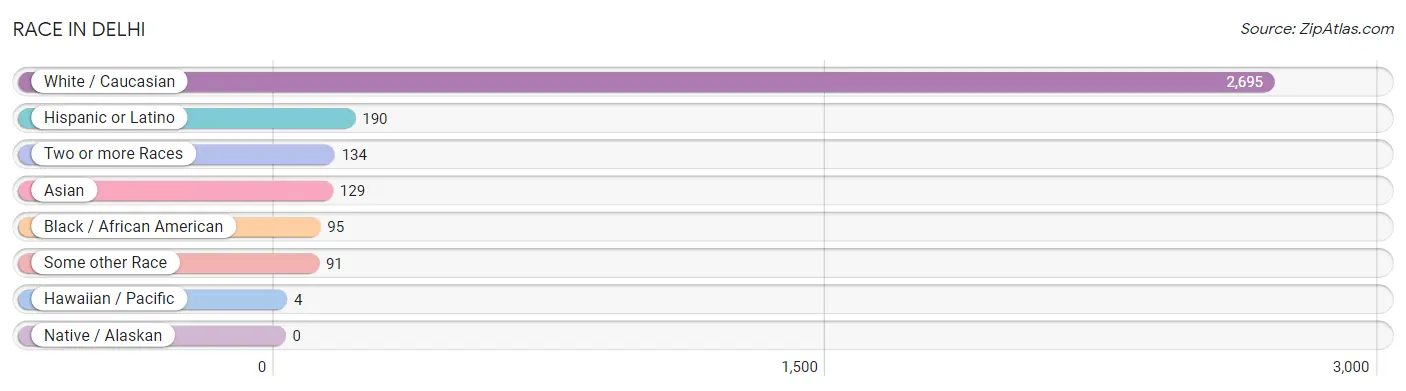
| Race | # Population | % Population |
| Asian | 129 | 4.1% |
| Black / African American | 95 | 3.0% |
| Hawaiian / Pacific | 4 | 0.1% |
| Hispanic or Latino | 190 | 6.0% |
| Native / Alaskan | 0 | 0.0% |
| White / Caucasian | 2,695 | 85.6% |
| Two or more Races | 134 | 4.3% |
| Some other Race | 91 | 2.9% |
| Total | 3,148 | 100.0% |
Ancestry in Delhi
The most populous ancestries reported in Delhi are German (368 | 11.7%), Irish (267 | 8.5%), English (218 | 6.9%), Italian (181 | 5.8%), and Polish (91 | 2.9%), together accounting for 35.7% of all Delhi residents.
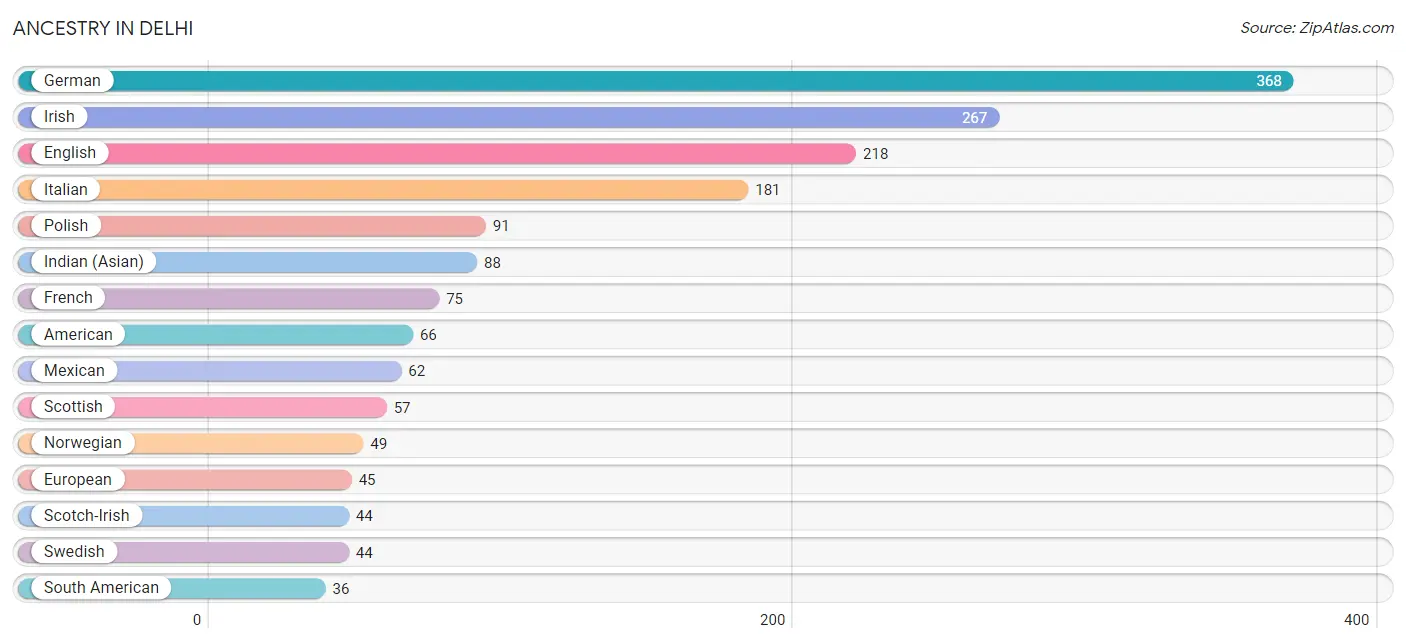
| Ancestry | # Population | % Population |
| African | 3 | 0.1% |
| American | 66 | 2.1% |
| Apache | 3 | 0.1% |
| Austrian | 8 | 0.3% |
| Bhutanese | 20 | 0.6% |
| Brazilian | 2 | 0.1% |
| British | 9 | 0.3% |
| Bulgarian | 1 | 0.0% |
| Canadian | 5 | 0.2% |
| Central American | 12 | 0.4% |
| Cherokee | 1 | 0.0% |
| Chilean | 7 | 0.2% |
| Colombian | 17 | 0.5% |
| Cuban | 7 | 0.2% |
| Czech | 7 | 0.2% |
| Danish | 13 | 0.4% |
| Dominican | 15 | 0.5% |
| Dutch | 31 | 1.0% |
| English | 218 | 6.9% |
| European | 45 | 1.4% |
| Finnish | 12 | 0.4% |
| French | 75 | 2.4% |
| French American Indian | 1 | 0.0% |
| French Canadian | 25 | 0.8% |
| German | 368 | 11.7% |
| Greek | 1 | 0.0% |
| Guatemalan | 7 | 0.2% |
| Honduran | 5 | 0.2% |
| Hungarian | 13 | 0.4% |
| Indian (Asian) | 88 | 2.8% |
| Irish | 267 | 8.5% |
| Israeli | 2 | 0.1% |
| Italian | 181 | 5.8% |
| Korean | 25 | 0.8% |
| Lithuanian | 26 | 0.8% |
| Mexican | 62 | 2.0% |
| Mongolian | 11 | 0.4% |
| Northern European | 19 | 0.6% |
| Norwegian | 49 | 1.6% |
| Pennsylvania German | 4 | 0.1% |
| Peruvian | 12 | 0.4% |
| Polish | 91 | 2.9% |
| Portuguese | 14 | 0.4% |
| Puerto Rican | 33 | 1.1% |
| Russian | 16 | 0.5% |
| Samoan | 4 | 0.1% |
| Scandinavian | 5 | 0.2% |
| Scotch-Irish | 44 | 1.4% |
| Scottish | 57 | 1.8% |
| South American | 36 | 1.1% |
| Spaniard | 6 | 0.2% |
| Subsaharan African | 3 | 0.1% |
| Swedish | 44 | 1.4% |
| Thai | 17 | 0.5% |
| Turkish | 32 | 1.0% |
| Ukrainian | 16 | 0.5% |
| Welsh | 21 | 0.7% | View All 57 Rows |
Immigrants in Delhi
The most numerous immigrant groups reported in Delhi came from Asia (80 | 2.5%), Europe (44 | 1.4%), China (38 | 1.2%), Eastern Asia (38 | 1.2%), and Western Europe (31 | 1.0%), together accounting for 7.3% of all Delhi residents.
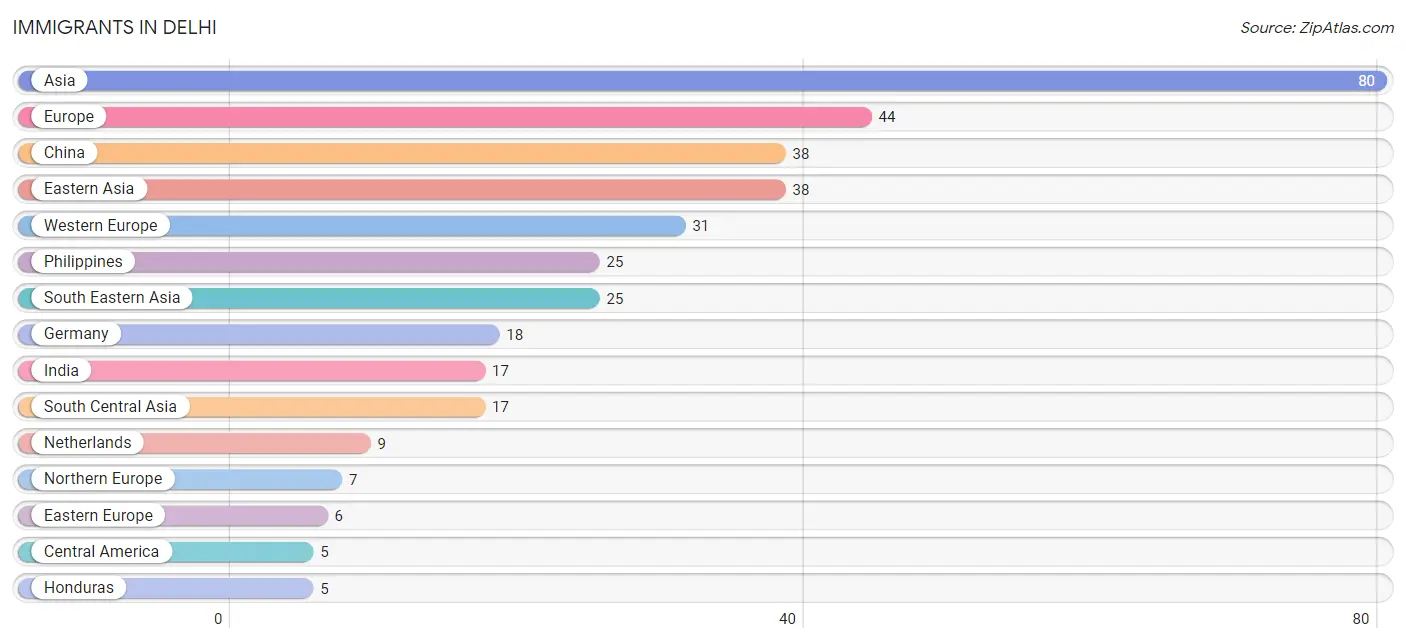
| Immigration Origin | # Population | % Population |
| Asia | 80 | 2.5% |
| Belgium | 4 | 0.1% |
| Bulgaria | 1 | 0.0% |
| Central America | 5 | 0.2% |
| China | 38 | 1.2% |
| Czechoslovakia | 3 | 0.1% |
| Eastern Asia | 38 | 1.2% |
| Eastern Europe | 6 | 0.2% |
| England | 3 | 0.1% |
| Europe | 44 | 1.4% |
| Germany | 18 | 0.6% |
| Honduras | 5 | 0.2% |
| India | 17 | 0.5% |
| Latin America | 5 | 0.2% |
| Netherlands | 9 | 0.3% |
| Northern Europe | 7 | 0.2% |
| Philippines | 25 | 0.8% |
| Scotland | 4 | 0.1% |
| South Central Asia | 17 | 0.5% |
| South Eastern Asia | 25 | 0.8% |
| Taiwan | 3 | 0.1% |
| Ukraine | 2 | 0.1% |
| Western Europe | 31 | 1.0% | View All 23 Rows |
Sex and Age in Delhi
Sex and Age in Delhi
The most populous age groups in Delhi are 15 to 19 Years (556 | 33.3%) for men and 15 to 19 Years (464 | 31.4%) for women.
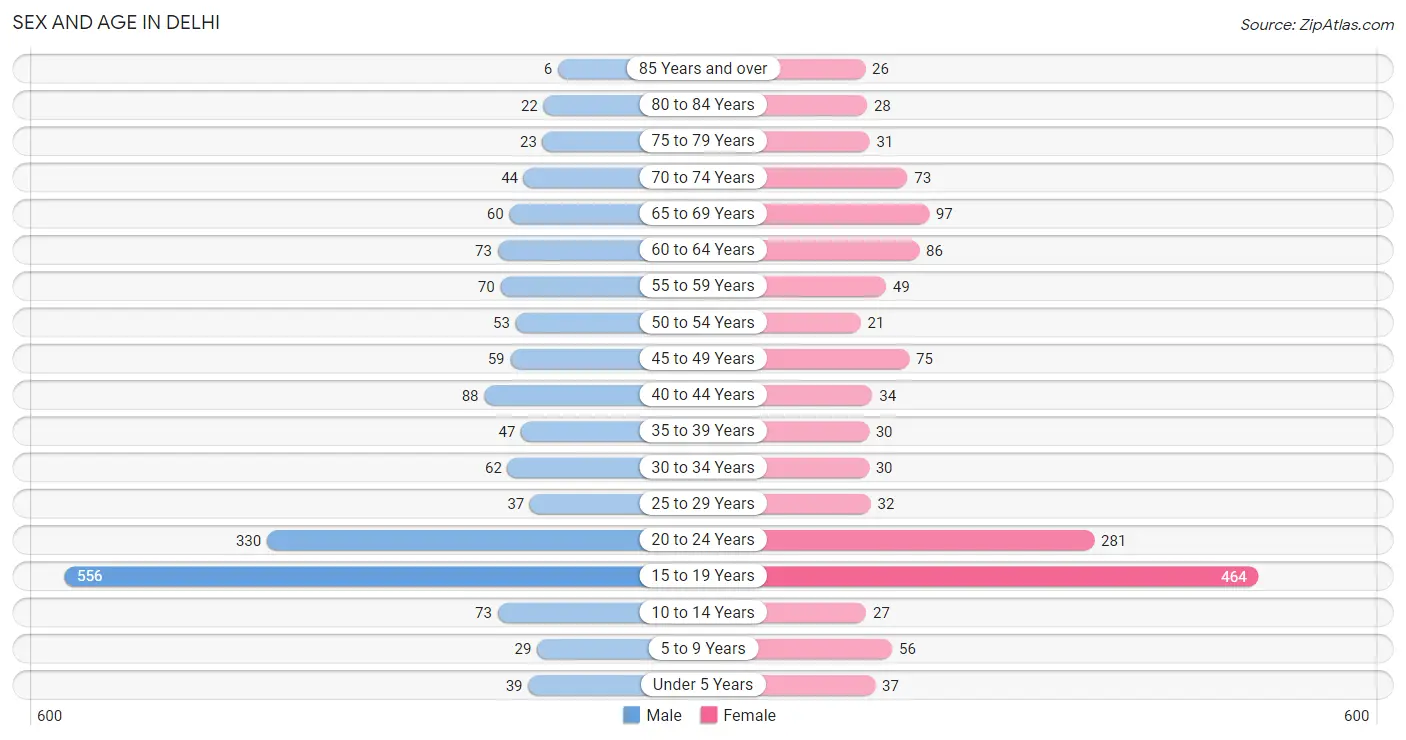
| Age Bracket | Male | Female |
| Under 5 Years | 39 (2.3%) | 37 (2.5%) |
| 5 to 9 Years | 29 (1.7%) | 56 (3.8%) |
| 10 to 14 Years | 73 (4.4%) | 27 (1.8%) |
| 15 to 19 Years | 556 (33.3%) | 464 (31.4%) |
| 20 to 24 Years | 330 (19.8%) | 281 (19.0%) |
| 25 to 29 Years | 37 (2.2%) | 32 (2.2%) |
| 30 to 34 Years | 62 (3.7%) | 30 (2.0%) |
| 35 to 39 Years | 47 (2.8%) | 30 (2.0%) |
| 40 to 44 Years | 88 (5.3%) | 34 (2.3%) |
| 45 to 49 Years | 59 (3.5%) | 75 (5.1%) |
| 50 to 54 Years | 53 (3.2%) | 21 (1.4%) |
| 55 to 59 Years | 70 (4.2%) | 49 (3.3%) |
| 60 to 64 Years | 73 (4.4%) | 86 (5.8%) |
| 65 to 69 Years | 60 (3.6%) | 97 (6.6%) |
| 70 to 74 Years | 44 (2.6%) | 73 (4.9%) |
| 75 to 79 Years | 23 (1.4%) | 31 (2.1%) |
| 80 to 84 Years | 22 (1.3%) | 28 (1.9%) |
| 85 Years and over | 6 (0.4%) | 26 (1.8%) |
| Total | 1,671 (100.0%) | 1,477 (100.0%) |
Families and Households in Delhi
Median Family Size in Delhi
The median family size in Delhi is 2.88 persons per family, with single male/father families (33 | 8.5%) accounting for the largest median family size of 3.82 persons per family. On the other hand, single female/mother families (90 | 23.1%) represent the smallest median family size with 2.43 persons per family.
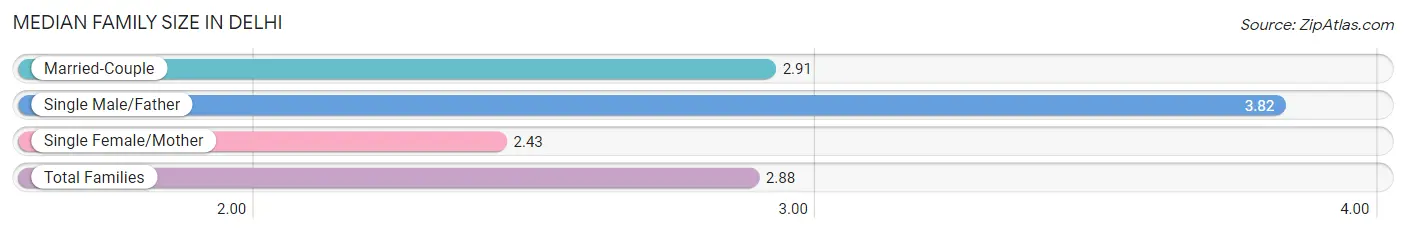
| Family Type | # Families | Family Size |
| Married-Couple | 267 (68.5%) | 2.91 |
| Single Male/Father | 33 (8.5%) | 3.82 |
| Single Female/Mother | 90 (23.1%) | 2.43 |
| Total Families | 390 (100.0%) | 2.88 |
Median Household Size in Delhi
The median household size in Delhi is 2.06 persons per household, with single male/father households (33 | 4.1%) accounting for the largest median household size of 3.94 persons per household. non-family households (411 | 51.3%) represent the smallest median household size with 1.18 persons per household.
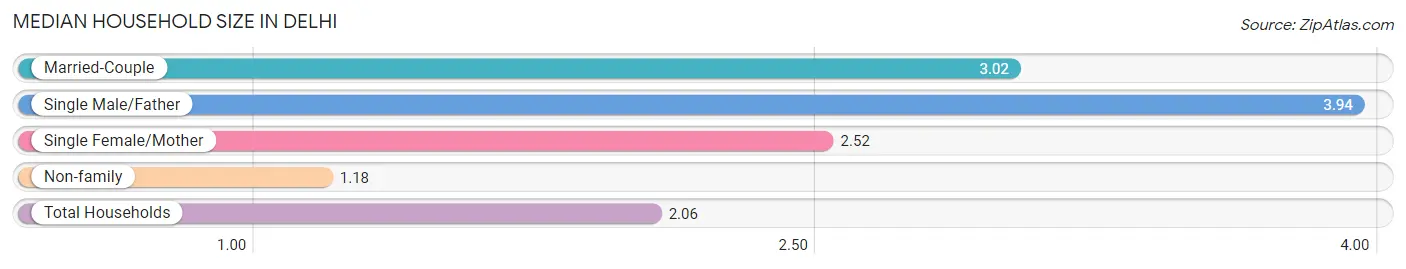
| Household Type | # Households | Household Size |
| Married-Couple | 267 (33.3%) | 3.02 |
| Single Male/Father | 33 (4.1%) | 3.94 |
| Single Female/Mother | 90 (11.2%) | 2.52 |
| Non-family | 411 (51.3%) | 1.18 |
| Total Households | 801 (100.0%) | 2.06 |
Household Size by Marriage Status in Delhi
Out of a total of 801 households in Delhi, 390 (48.7%) are family households, while 411 (51.3%) are nonfamily households. The most numerous type of family households are 2-person households, comprising 215, and the most common type of nonfamily households are 1-person households, comprising 361.
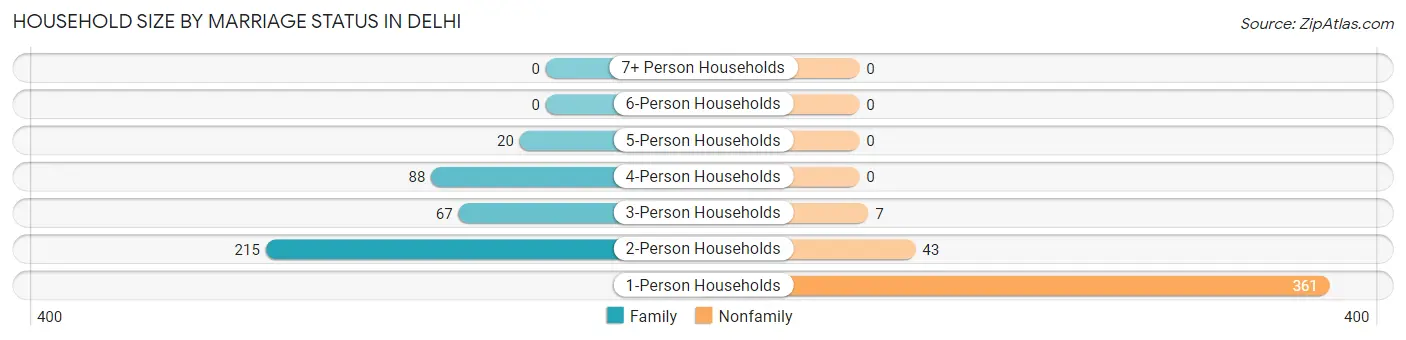
| Household Size | Family Households | Nonfamily Households |
| 1-Person Households | - | 361 (45.1%) |
| 2-Person Households | 215 (26.8%) | 43 (5.4%) |
| 3-Person Households | 67 (8.4%) | 7 (0.9%) |
| 4-Person Households | 88 (11.0%) | 0 (0.0%) |
| 5-Person Households | 20 (2.5%) | 0 (0.0%) |
| 6-Person Households | 0 (0.0%) | 0 (0.0%) |
| 7+ Person Households | 0 (0.0%) | 0 (0.0%) |
| Total | 390 (48.7%) | 411 (51.3%) |
Female Fertility in Delhi
Fertility by Age in Delhi
Average fertility rate in Delhi is 33.0 births per 1,000 women. Women in the age bracket of 20 to 34 years have the highest fertility rate with 41.0 births per 1,000 women. Women in the age bracket of 15 to 19 years acount for 54.8% of all women with births.
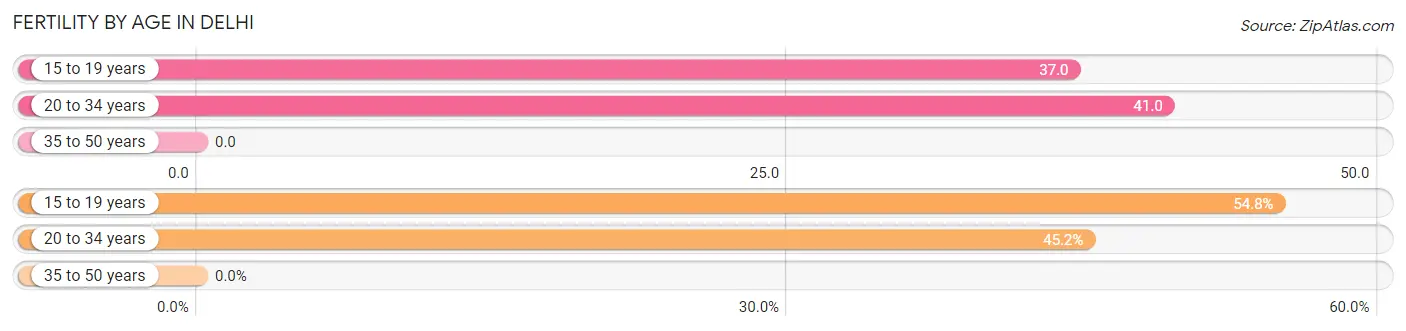
| Age Bracket | Women with Births | Births / 1,000 Women |
| 15 to 19 years | 17 (54.8%) | 37.0 |
| 20 to 34 years | 14 (45.2%) | 41.0 |
| 35 to 50 years | 0 (0.0%) | 0.0 |
| Total | 31 (100.0%) | 33.0 |
Fertility by Age by Marriage Status in Delhi
45.2% of women with births (31) in Delhi are married. The highest percentage of unmarried women with births falls into 15 to 19 years age bracket with 100.0% of them unmarried at the time of birth, while the lowest percentage of unmarried women with births belong to 20 to 34 years age bracket with 0.0% of them unmarried.
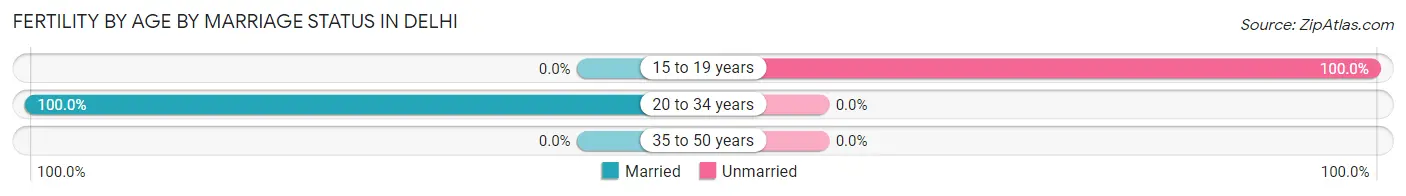
| Age Bracket | Married | Unmarried |
| 15 to 19 years | 0 (0.0%) | 17 (100.0%) |
| 20 to 34 years | 14 (100.0%) | 0 (0.0%) |
| 35 to 50 years | 0 (0.0%) | 0 (0.0%) |
| Total | 14 (45.2%) | 17 (54.8%) |
Fertility by Education in Delhi
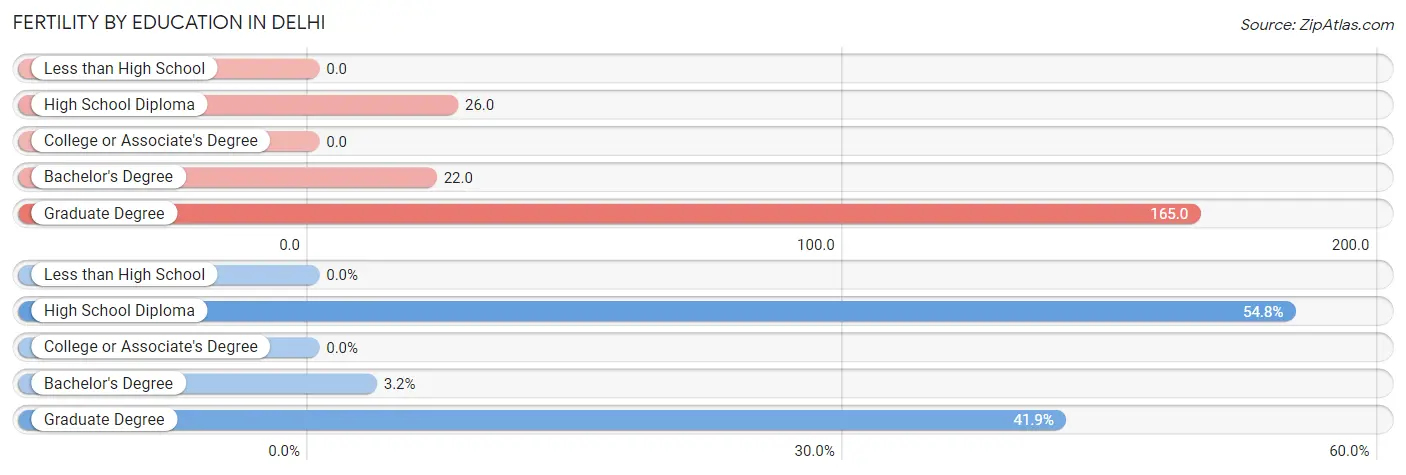
| Educational Attainment | Women with Births | Births / 1,000 Women |
| Less than High School | 0 (0.0%) | 0.0 |
| High School Diploma | 17 (54.8%) | 26.0 |
| College or Associate's Degree | 0 (0.0%) | 0.0 |
| Bachelor's Degree | 1 (3.2%) | 22.0 |
| Graduate Degree | 13 (41.9%) | 165.0 |
| Total | 31 (100.0%) | 33.0 |
Fertility by Education by Marriage Status in Delhi
54.8% of women with births in Delhi are unmarried. Women with the educational attainment of bachelor's degree are most likely to be married with 100.0% of them married at childbirth, while women with the educational attainment of high school diploma are least likely to be married with 100.0% of them unmarried at childbirth.
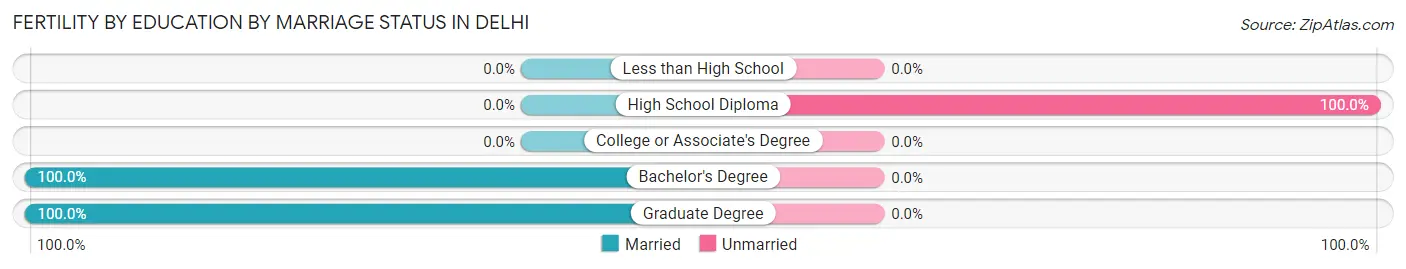
| Educational Attainment | Married | Unmarried |
| Less than High School | 0 (0.0%) | 0 (0.0%) |
| High School Diploma | 0 (0.0%) | 17 (100.0%) |
| College or Associate's Degree | 0 (0.0%) | 0 (0.0%) |
| Bachelor's Degree | 1 (100.0%) | 0 (0.0%) |
| Graduate Degree | 13 (100.0%) | 0 (0.0%) |
| Total | 14 (45.2%) | 17 (54.8%) |
Employment Characteristics in Delhi
Employment by Class of Employer in Delhi
Among the 1,231 employed individuals in Delhi, private company employees (561 | 45.6%), not-for-profit organizations (194 | 15.8%), and state government employees (192 | 15.6%) make up the most common classes of employment.
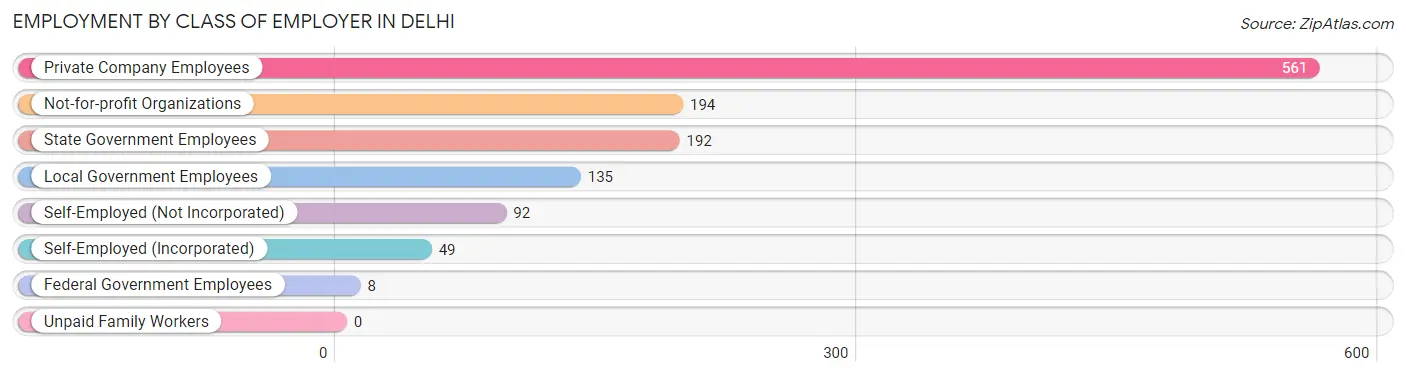
| Employer Class | # Employees | % Employees |
| Private Company Employees | 561 | 45.6% |
| Self-Employed (Incorporated) | 49 | 4.0% |
| Self-Employed (Not Incorporated) | 92 | 7.5% |
| Not-for-profit Organizations | 194 | 15.8% |
| Local Government Employees | 135 | 11.0% |
| State Government Employees | 192 | 15.6% |
| Federal Government Employees | 8 | 0.6% |
| Unpaid Family Workers | 0 | 0.0% |
| Total | 1,231 | 100.0% |
Employment Status by Age in Delhi
According to the labor force statistics for Delhi, out of the total population over 16 years of age (2,879), 46.0% or 1,324 individuals are in the labor force, with 5.5% or 73 of them unemployed. The age group with the highest labor force participation rate is 25 to 29 years, with 88.4% or 61 individuals in the labor force. Within the labor force, the 45 to 54 years age range has the highest percentage of unemployed individuals, with 26.1% or 46 of them being unemployed.
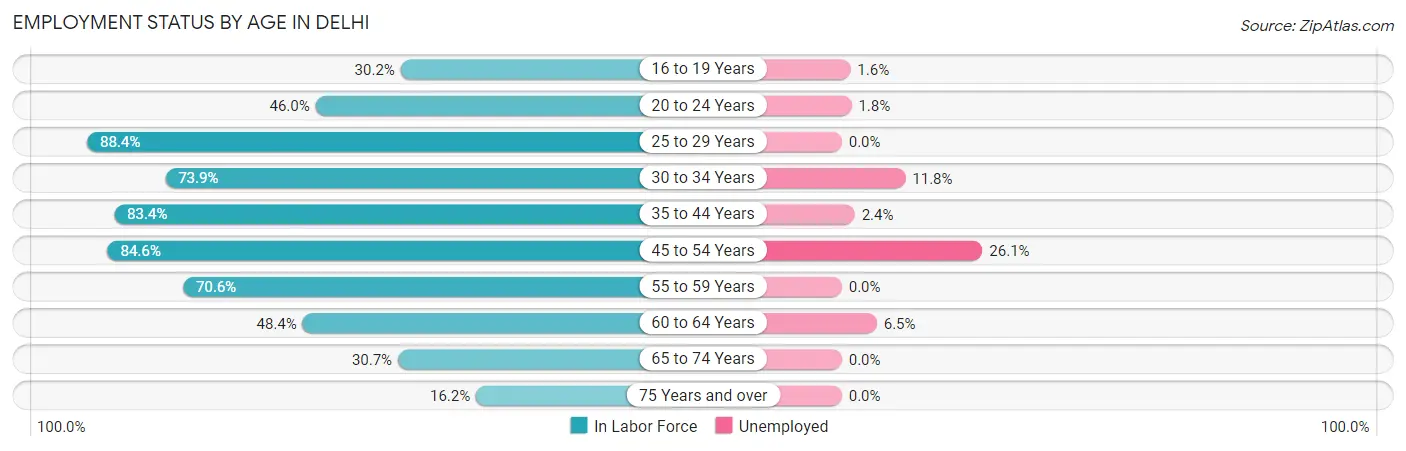
| Age Bracket | In Labor Force | Unemployed |
| 16 to 19 Years | 306 (30.2%) | 5 (1.6%) |
| 20 to 24 Years | 281 (46.0%) | 5 (1.8%) |
| 25 to 29 Years | 61 (88.4%) | 0 (0.0%) |
| 30 to 34 Years | 68 (73.9%) | 8 (11.8%) |
| 35 to 44 Years | 166 (83.4%) | 4 (2.4%) |
| 45 to 54 Years | 176 (84.6%) | 46 (26.1%) |
| 55 to 59 Years | 84 (70.6%) | 0 (0.0%) |
| 60 to 64 Years | 77 (48.4%) | 5 (6.5%) |
| 65 to 74 Years | 84 (30.7%) | 0 (0.0%) |
| 75 Years and over | 22 (16.2%) | 0 (0.0%) |
| Total | 1,324 (46.0%) | 73 (5.5%) |
Employment Status by Educational Attainment in Delhi
According to labor force statistics for Delhi, 74.7% of individuals (632) out of the total population between 25 and 64 years of age (846) are in the labor force, with 10.0% or 63 of them being unemployed. The group with the highest labor force participation rate are those with the educational attainment of bachelor's degree or higher, with 85.4% or 268 individuals in the labor force. Within the labor force, individuals with high school diploma education have the highest percentage of unemployment, with 26.1% or 46 of them being unemployed.
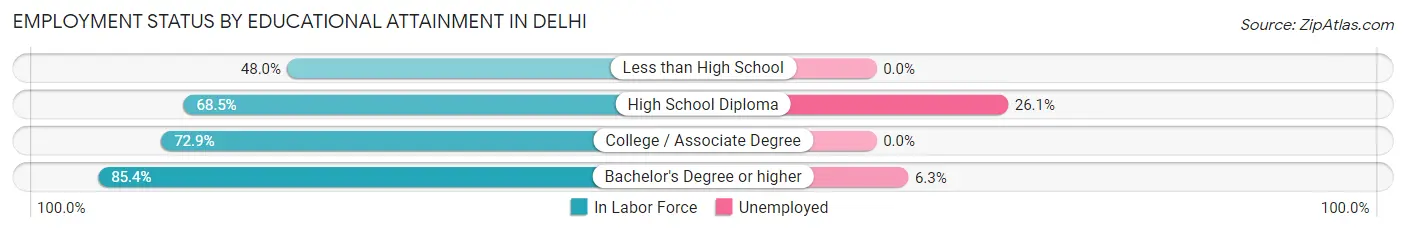
| Educational Attainment | In Labor Force | Unemployed |
| Less than High School | 24 (48.0%) | 0 (0.0%) |
| High School Diploma | 176 (68.5%) | 67 (26.1%) |
| College / Associate Degree | 164 (72.9%) | 0 (0.0%) |
| Bachelor's Degree or higher | 268 (85.4%) | 20 (6.3%) |
| Total | 632 (74.7%) | 85 (10.0%) |
Employment Occupations by Sex in Delhi
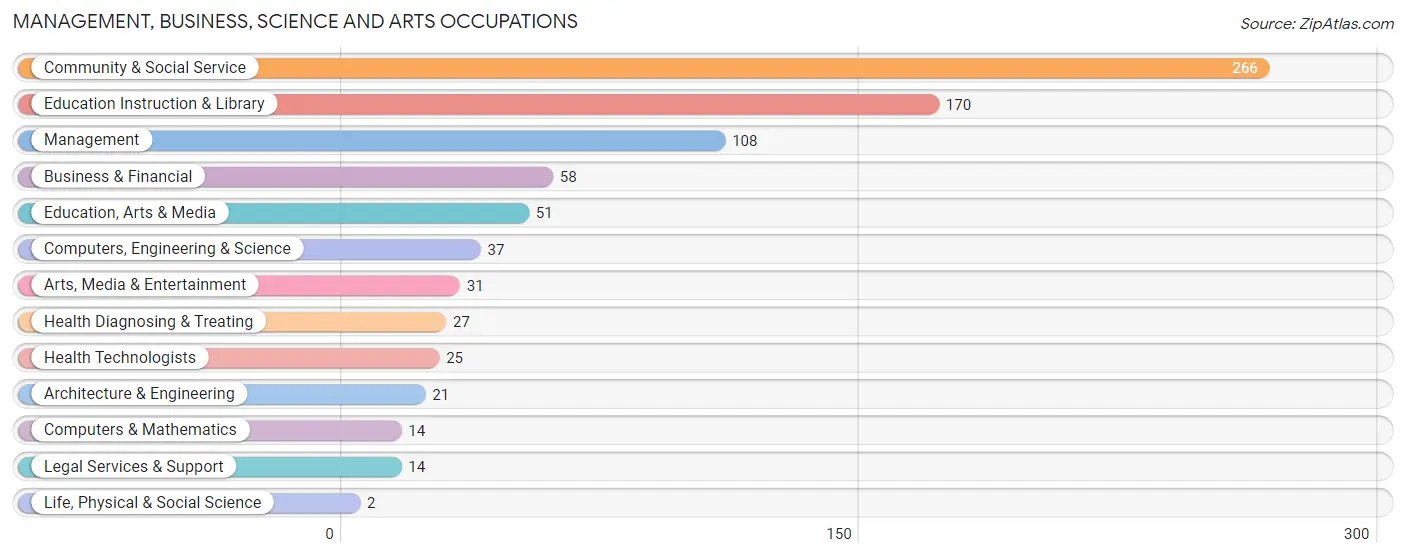
Management, Business, Science and Arts Occupations
The most common Management, Business, Science and Arts occupations in Delhi are Community & Social Service (266 | 21.2%), Education Instruction & Library (170 | 13.6%), Management (108 | 8.6%), Business & Financial (58 | 4.6%), and Education, Arts & Media (51 | 4.1%).
Management, Business, Science and Arts Occupations by Sex
Within the Management, Business, Science and Arts occupations in Delhi, the most male-oriented occupations are Computers & Mathematics (100.0%), Architecture & Engineering (100.0%), and Legal Services & Support (100.0%), while the most female-oriented occupations are Life, Physical & Social Science (100.0%), Arts, Media & Entertainment (67.7%), and Education Instruction & Library (56.5%).
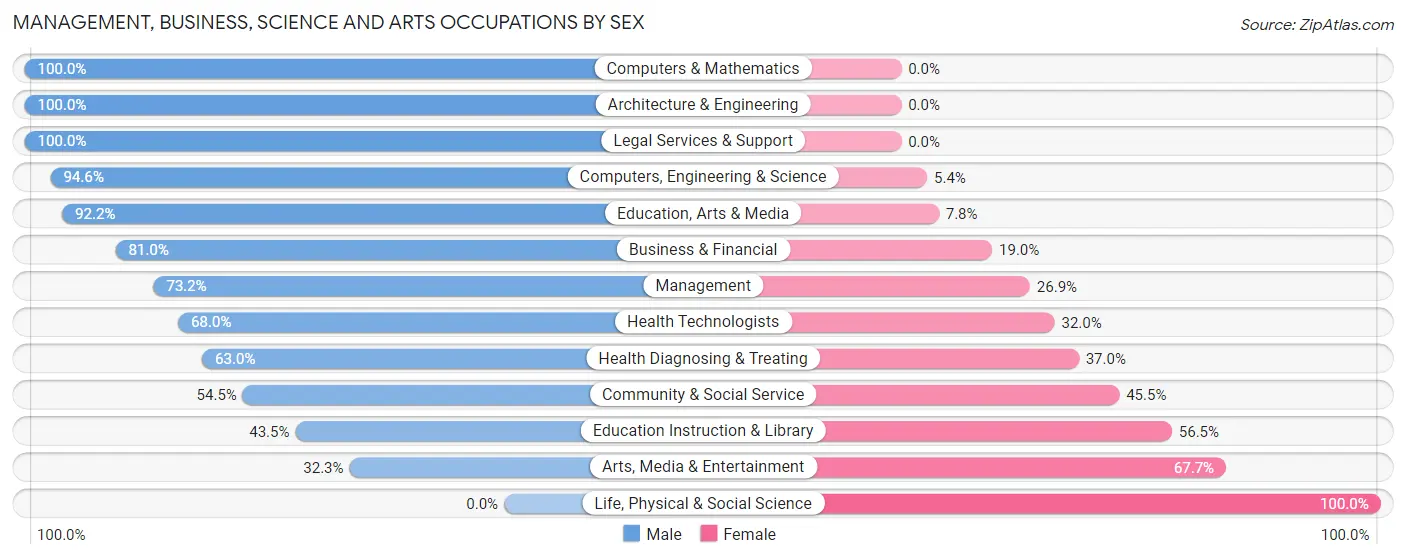
| Occupation | Male | Female |
| Management | 79 (73.2%) | 29 (26.9%) |
| Business & Financial | 47 (81.0%) | 11 (19.0%) |
| Computers, Engineering & Science | 35 (94.6%) | 2 (5.4%) |
| Computers & Mathematics | 14 (100.0%) | 0 (0.0%) |
| Architecture & Engineering | 21 (100.0%) | 0 (0.0%) |
| Life, Physical & Social Science | 0 (0.0%) | 2 (100.0%) |
| Community & Social Service | 145 (54.5%) | 121 (45.5%) |
| Education, Arts & Media | 47 (92.2%) | 4 (7.8%) |
| Legal Services & Support | 14 (100.0%) | 0 (0.0%) |
| Education Instruction & Library | 74 (43.5%) | 96 (56.5%) |
| Arts, Media & Entertainment | 10 (32.3%) | 21 (67.7%) |
| Health Diagnosing & Treating | 17 (63.0%) | 10 (37.0%) |
| Health Technologists | 17 (68.0%) | 8 (32.0%) |
| Total (Category) | 323 (65.1%) | 173 (34.9%) |
| Total (Overall) | 701 (56.0%) | 551 (44.0%) |
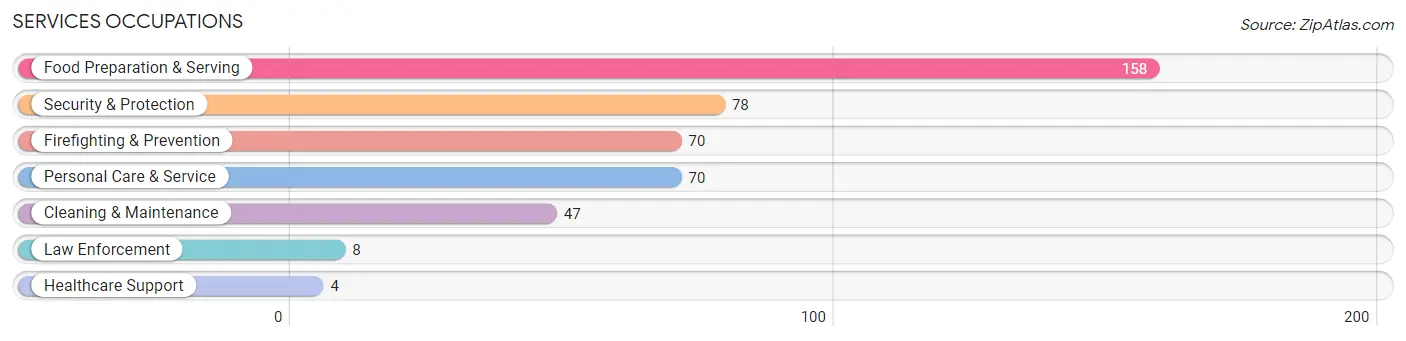
Services Occupations
The most common Services occupations in Delhi are Food Preparation & Serving (158 | 12.6%), Security & Protection (78 | 6.2%), Firefighting & Prevention (70 | 5.6%), Personal Care & Service (70 | 5.6%), and Cleaning & Maintenance (47 | 3.7%).
Services Occupations by Sex
Within the Services occupations in Delhi, the most male-oriented occupations are Law Enforcement (100.0%), Cleaning & Maintenance (91.5%), and Security & Protection (91.0%), while the most female-oriented occupations are Healthcare Support (100.0%), Personal Care & Service (71.4%), and Food Preparation & Serving (70.9%).
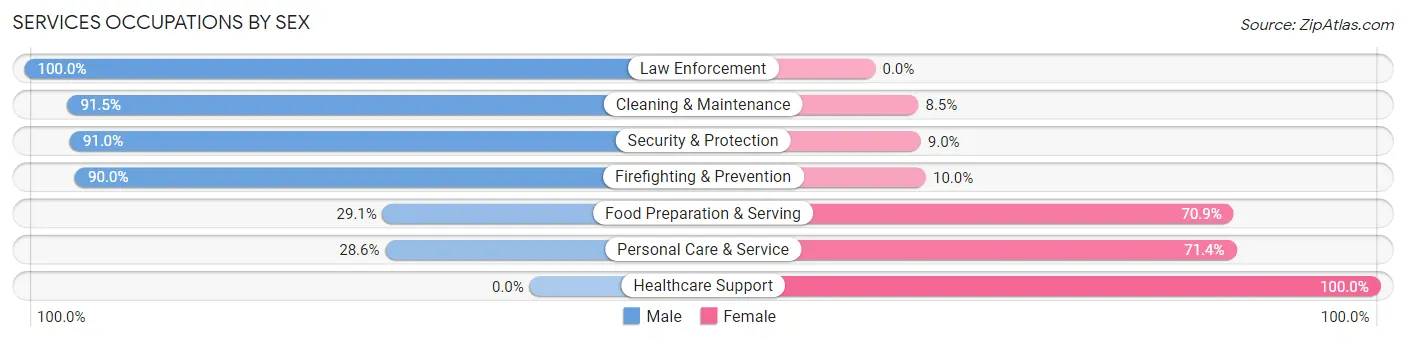
| Occupation | Male | Female |
| Healthcare Support | 0 (0.0%) | 4 (100.0%) |
| Security & Protection | 71 (91.0%) | 7 (9.0%) |
| Firefighting & Prevention | 63 (90.0%) | 7 (10.0%) |
| Law Enforcement | 8 (100.0%) | 0 (0.0%) |
| Food Preparation & Serving | 46 (29.1%) | 112 (70.9%) |
| Cleaning & Maintenance | 43 (91.5%) | 4 (8.5%) |
| Personal Care & Service | 20 (28.6%) | 50 (71.4%) |
| Total (Category) | 180 (50.4%) | 177 (49.6%) |
| Total (Overall) | 701 (56.0%) | 551 (44.0%) |
Sales and Office Occupations
The most common Sales and Office occupations in Delhi are Office & Administration (151 | 12.1%), and Sales & Related (115 | 9.2%).
Sales and Office Occupations by Sex
| Occupation | Male | Female |
| Sales & Related | 24 (20.9%) | 91 (79.1%) |
| Office & Administration | 55 (36.4%) | 96 (63.6%) |
| Total (Category) | 79 (29.7%) | 187 (70.3%) |
| Total (Overall) | 701 (56.0%) | 551 (44.0%) |
Natural Resources, Construction and Maintenance Occupations
The most common Natural Resources, Construction and Maintenance occupations in Delhi are Installation, Maintenance & Repair (14 | 1.1%), Construction & Extraction (9 | 0.7%), and Farming, Fishing & Forestry (2 | 0.2%).
Natural Resources, Construction and Maintenance Occupations by Sex
| Occupation | Male | Female |
| Farming, Fishing & Forestry | 0 (0.0%) | 2 (100.0%) |
| Construction & Extraction | 9 (100.0%) | 0 (0.0%) |
| Installation, Maintenance & Repair | 14 (100.0%) | 0 (0.0%) |
| Total (Category) | 23 (92.0%) | 2 (8.0%) |
| Total (Overall) | 701 (56.0%) | 551 (44.0%) |
Production, Transportation and Moving Occupations
The most common Production, Transportation and Moving occupations in Delhi are Material Moving (54 | 4.3%), Production (39 | 3.1%), and Transportation (15 | 1.2%).
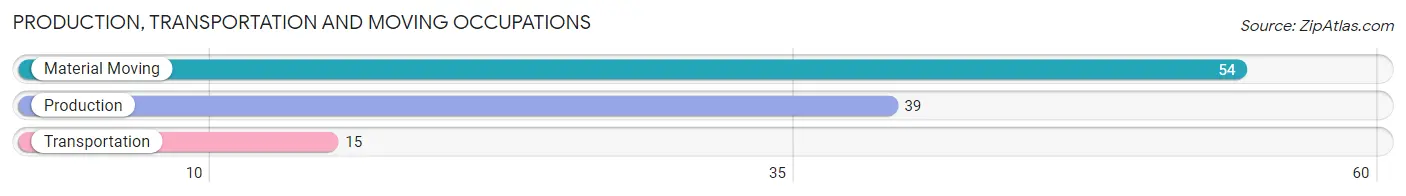
Production, Transportation and Moving Occupations by Sex
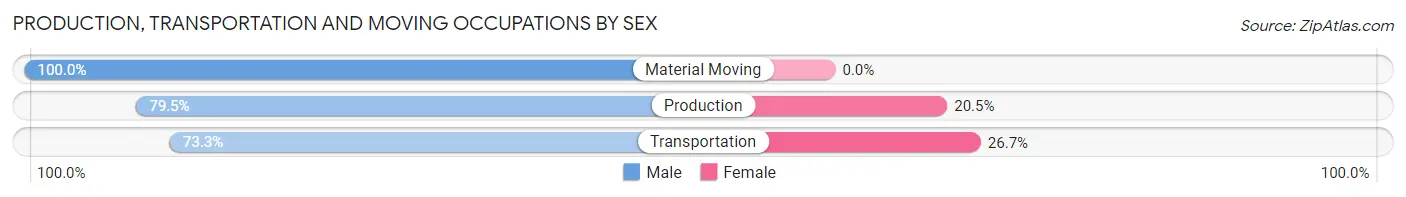
| Occupation | Male | Female |
| Production | 31 (79.5%) | 8 (20.5%) |
| Transportation | 11 (73.3%) | 4 (26.7%) |
| Material Moving | 54 (100.0%) | 0 (0.0%) |
| Total (Category) | 96 (88.9%) | 12 (11.1%) |
| Total (Overall) | 701 (56.0%) | 551 (44.0%) |
Employment Industries by Sex in Delhi
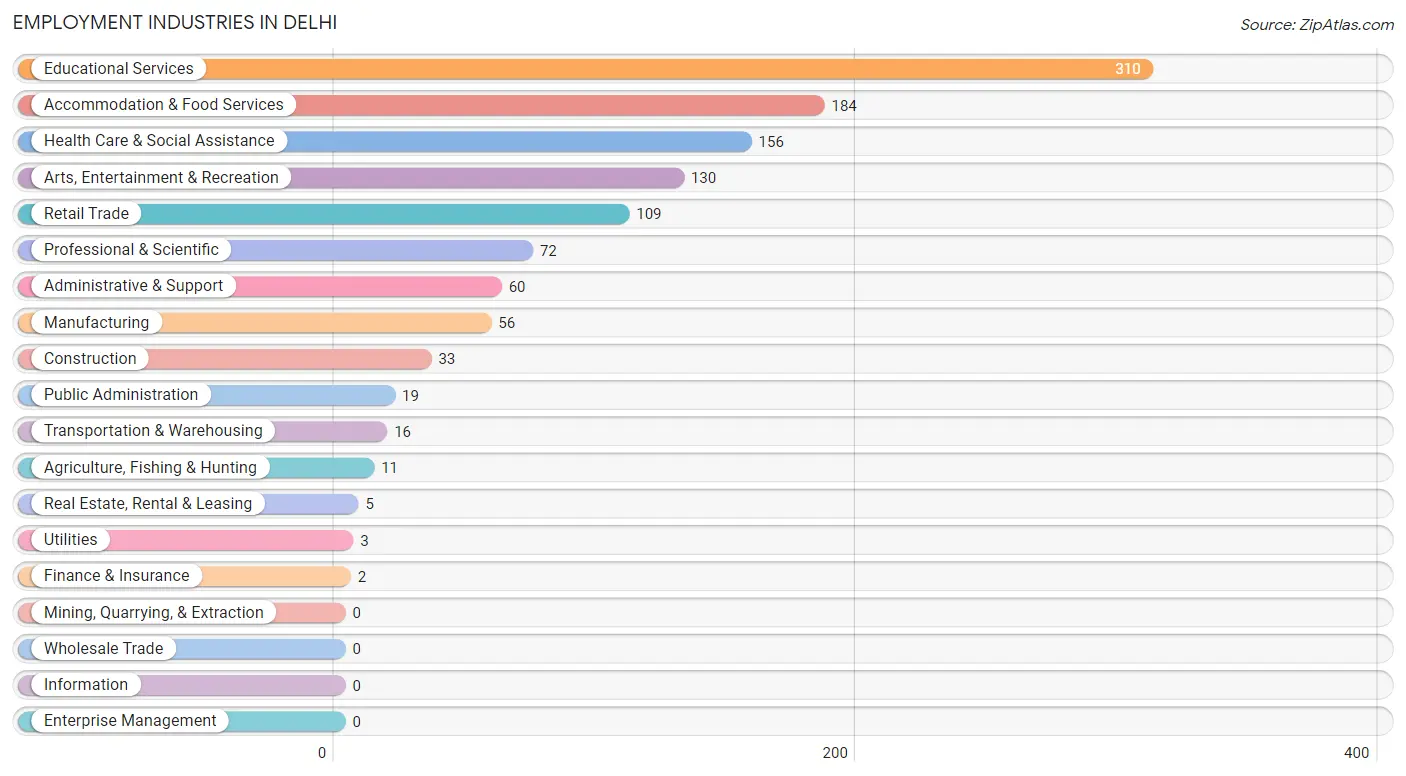
Employment Industries in Delhi
The major employment industries in Delhi include Educational Services (310 | 24.8%), Accommodation & Food Services (184 | 14.7%), Health Care & Social Assistance (156 | 12.5%), Arts, Entertainment & Recreation (130 | 10.4%), and Retail Trade (109 | 8.7%).
Employment Industries by Sex in Delhi
The Delhi industries that see more men than women are Construction (100.0%), Utilities (100.0%), and Real Estate, Rental & Leasing (100.0%), whereas the industries that tend to have a higher number of women are Accommodation & Food Services (64.1%), Health Care & Social Assistance (60.9%), and Educational Services (52.6%).
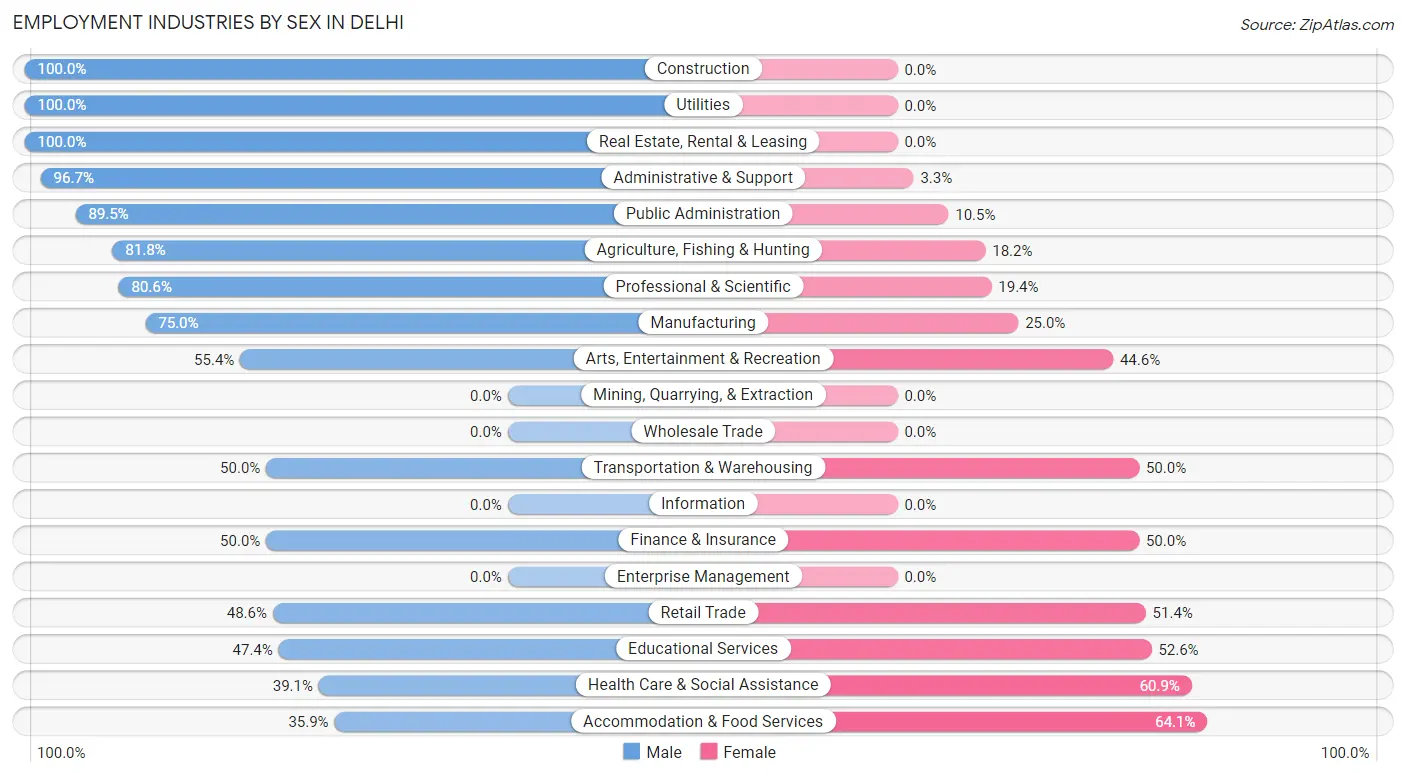
| Industry | Male | Female |
| Agriculture, Fishing & Hunting | 9 (81.8%) | 2 (18.2%) |
| Mining, Quarrying, & Extraction | 0 (0.0%) | 0 (0.0%) |
| Construction | 33 (100.0%) | 0 (0.0%) |
| Manufacturing | 42 (75.0%) | 14 (25.0%) |
| Wholesale Trade | 0 (0.0%) | 0 (0.0%) |
| Retail Trade | 53 (48.6%) | 56 (51.4%) |
| Transportation & Warehousing | 8 (50.0%) | 8 (50.0%) |
| Utilities | 3 (100.0%) | 0 (0.0%) |
| Information | 0 (0.0%) | 0 (0.0%) |
| Finance & Insurance | 1 (50.0%) | 1 (50.0%) |
| Real Estate, Rental & Leasing | 5 (100.0%) | 0 (0.0%) |
| Professional & Scientific | 58 (80.6%) | 14 (19.4%) |
| Enterprise Management | 0 (0.0%) | 0 (0.0%) |
| Administrative & Support | 58 (96.7%) | 2 (3.3%) |
| Educational Services | 147 (47.4%) | 163 (52.6%) |
| Health Care & Social Assistance | 61 (39.1%) | 95 (60.9%) |
| Arts, Entertainment & Recreation | 72 (55.4%) | 58 (44.6%) |
| Accommodation & Food Services | 66 (35.9%) | 118 (64.1%) |
| Public Administration | 17 (89.5%) | 2 (10.5%) |
| Total | 701 (56.0%) | 551 (44.0%) |
Education in Delhi
School Enrollment in Delhi
The most common levels of schooling among the 1,782 students in Delhi are college / undergraduate (1,492 | 83.7%), middle school (94 | 5.3%), and high school (81 | 4.5%).
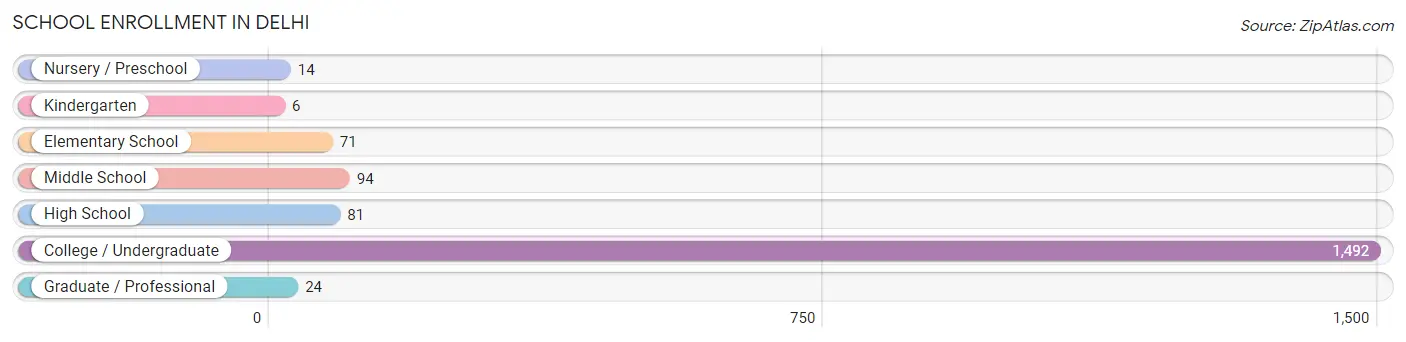
| School Level | # Students | % Students |
| Nursery / Preschool | 14 | 0.8% |
| Kindergarten | 6 | 0.3% |
| Elementary School | 71 | 4.0% |
| Middle School | 94 | 5.3% |
| High School | 81 | 4.5% |
| College / Undergraduate | 1,492 | 83.7% |
| Graduate / Professional | 24 | 1.3% |
| Total | 1,782 | 100.0% |
School Enrollment by Age by Funding Source in Delhi
Out of a total of 1,782 students who are enrolled in schools in Delhi, 36 (2.0%) attend a private institution, while the remaining 1,746 (98.0%) are enrolled in public schools. The age group of 3 to 4 year olds has the highest likelihood of being enrolled in private schools, with 12 (85.7% in the age bracket) enrolled. Conversely, the age group of 15 to 17 year olds has the lowest likelihood of being enrolled in a private school, with 96 (100.0% in the age bracket) attending a public institution.
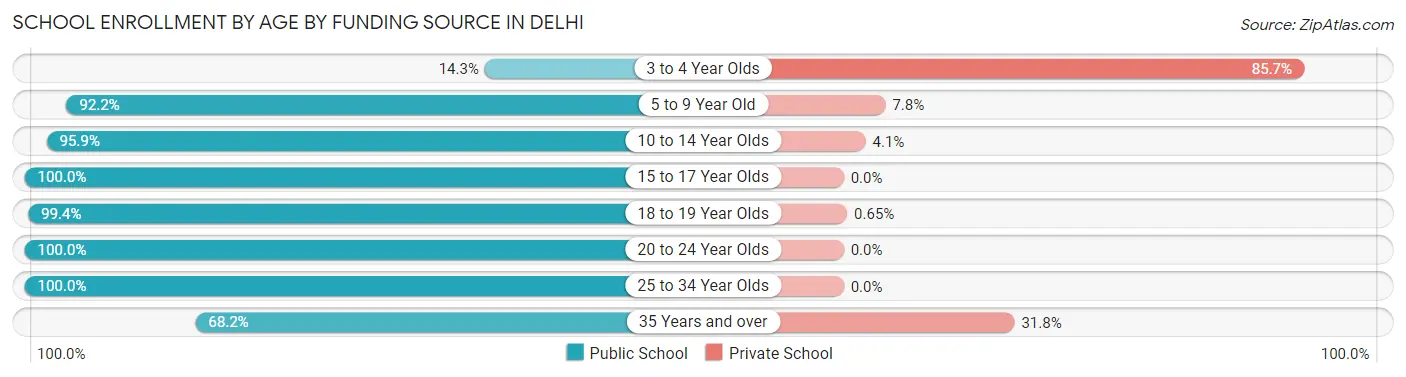
| Age Bracket | Public School | Private School |
| 3 to 4 Year Olds | 2 (14.3%) | 12 (85.7%) |
| 5 to 9 Year Old | 71 (92.2%) | 6 (7.8%) |
| 10 to 14 Year Olds | 94 (95.9%) | 4 (4.1%) |
| 15 to 17 Year Olds | 96 (100.0%) | 0 (0.0%) |
| 18 to 19 Year Olds | 915 (99.4%) | 6 (0.6%) |
| 20 to 24 Year Olds | 530 (100.0%) | 0 (0.0%) |
| 25 to 34 Year Olds | 24 (100.0%) | 0 (0.0%) |
| 35 Years and over | 15 (68.2%) | 7 (31.8%) |
| Total | 1,746 (98.0%) | 36 (2.0%) |
Educational Attainment by Field of Study in Delhi
Education (105 | 19.3%), science & technology (63 | 11.6%), social sciences (62 | 11.4%), business (54 | 9.9%), and visual & performing arts (50 | 9.2%) are the most common fields of study among 544 individuals in Delhi who have obtained a bachelor's degree or higher.
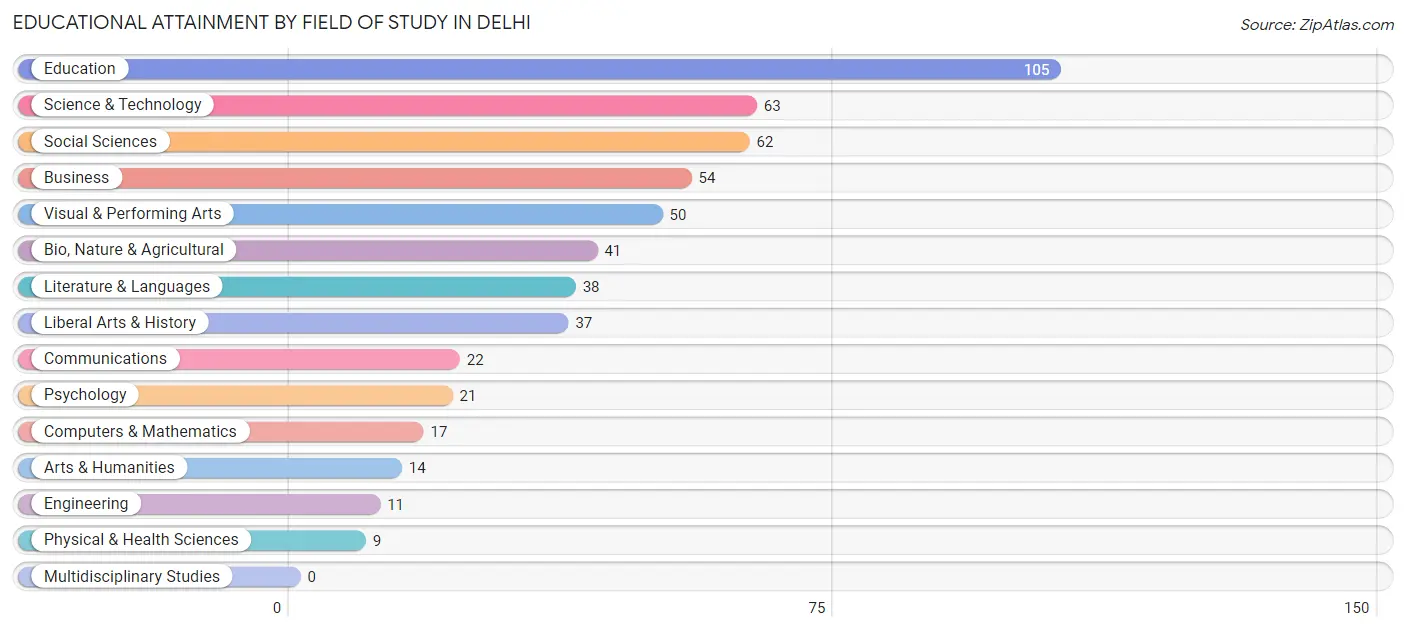
| Field of Study | # Graduates | % Graduates |
| Computers & Mathematics | 17 | 3.1% |
| Bio, Nature & Agricultural | 41 | 7.5% |
| Physical & Health Sciences | 9 | 1.7% |
| Psychology | 21 | 3.9% |
| Social Sciences | 62 | 11.4% |
| Engineering | 11 | 2.0% |
| Multidisciplinary Studies | 0 | 0.0% |
| Science & Technology | 63 | 11.6% |
| Business | 54 | 9.9% |
| Education | 105 | 19.3% |
| Literature & Languages | 38 | 7.0% |
| Liberal Arts & History | 37 | 6.8% |
| Visual & Performing Arts | 50 | 9.2% |
| Communications | 22 | 4.0% |
| Arts & Humanities | 14 | 2.6% |
| Total | 544 | 100.0% |
Transportation & Commute in Delhi
Vehicle Availability by Sex in Delhi
The most prevalent vehicle ownership categories in Delhi are males with 2 vehicles (189, accounting for 42.5%) and females with 2 vehicles (132, making up 61.6%).
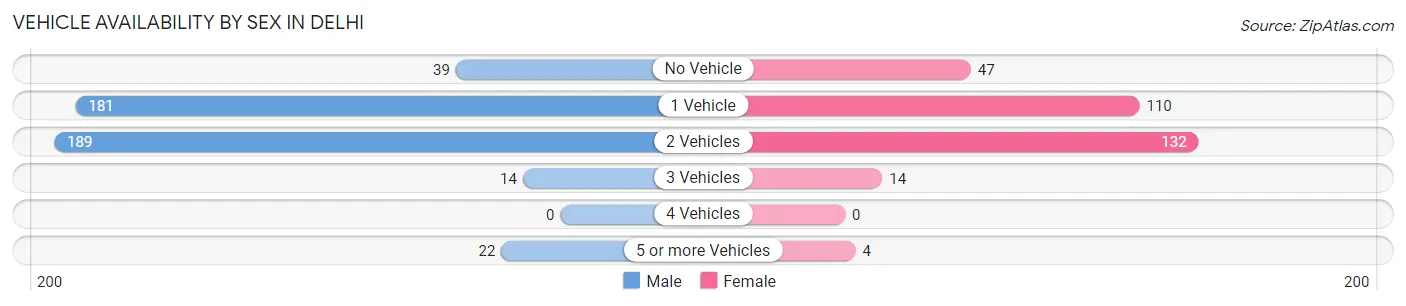
| Vehicles Available | Male | Female |
| No Vehicle | 39 (8.8%) | 47 (15.3%) |
| 1 Vehicle | 181 (40.7%) | 110 (35.8%) |
| 2 Vehicles | 189 (42.5%) | 132 (43.0%) |
| 3 Vehicles | 14 (3.2%) | 14 (4.6%) |
| 4 Vehicles | 0 (0.0%) | 0 (0.0%) |
| 5 or more Vehicles | 22 (4.9%) | 4 (1.3%) |
| Total | 445 (100.0%) | 307 (100.0%) |
Commute Time in Delhi
The most frequently occuring commute durations in Delhi are 5 to 9 minutes (405 commuters, 36.6%), 10 to 14 minutes (245 commuters, 22.2%), and less than 5 minutes (171 commuters, 15.5%).
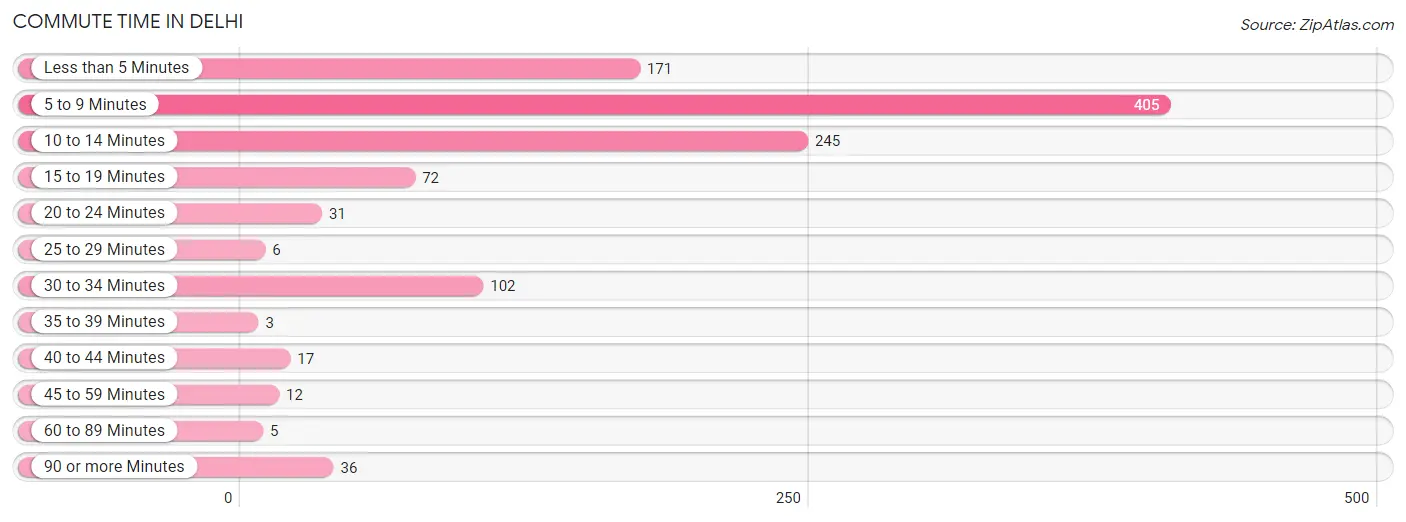
| Commute Time | # Commuters | % Commuters |
| Less than 5 Minutes | 171 | 15.5% |
| 5 to 9 Minutes | 405 | 36.6% |
| 10 to 14 Minutes | 245 | 22.2% |
| 15 to 19 Minutes | 72 | 6.5% |
| 20 to 24 Minutes | 31 | 2.8% |
| 25 to 29 Minutes | 6 | 0.5% |
| 30 to 34 Minutes | 102 | 9.2% |
| 35 to 39 Minutes | 3 | 0.3% |
| 40 to 44 Minutes | 17 | 1.5% |
| 45 to 59 Minutes | 12 | 1.1% |
| 60 to 89 Minutes | 5 | 0.4% |
| 90 or more Minutes | 36 | 3.3% |
Commute Time by Sex in Delhi
The most common commute times in Delhi are 5 to 9 minutes (232 commuters, 36.6%) for males and 5 to 9 minutes (173 commuters, 36.6%) for females.
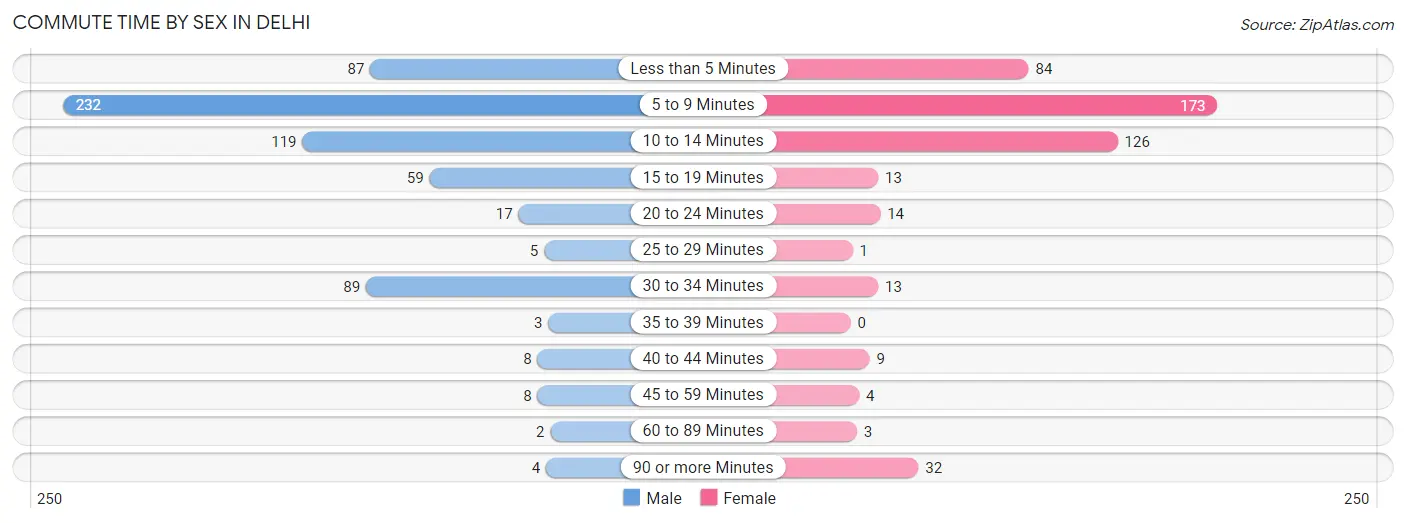
| Commute Time | Male | Female |
| Less than 5 Minutes | 87 (13.7%) | 84 (17.8%) |
| 5 to 9 Minutes | 232 (36.6%) | 173 (36.6%) |
| 10 to 14 Minutes | 119 (18.8%) | 126 (26.7%) |
| 15 to 19 Minutes | 59 (9.3%) | 13 (2.8%) |
| 20 to 24 Minutes | 17 (2.7%) | 14 (3.0%) |
| 25 to 29 Minutes | 5 (0.8%) | 1 (0.2%) |
| 30 to 34 Minutes | 89 (14.1%) | 13 (2.8%) |
| 35 to 39 Minutes | 3 (0.5%) | 0 (0.0%) |
| 40 to 44 Minutes | 8 (1.3%) | 9 (1.9%) |
| 45 to 59 Minutes | 8 (1.3%) | 4 (0.9%) |
| 60 to 89 Minutes | 2 (0.3%) | 3 (0.6%) |
| 90 or more Minutes | 4 (0.6%) | 32 (6.8%) |
Time of Departure to Work by Sex in Delhi
The most frequent times of departure to work in Delhi are 12:00 PM to 3:59 PM (133, 21.0%) for males and 7:30 AM to 7:59 AM (61, 12.9%) for females.
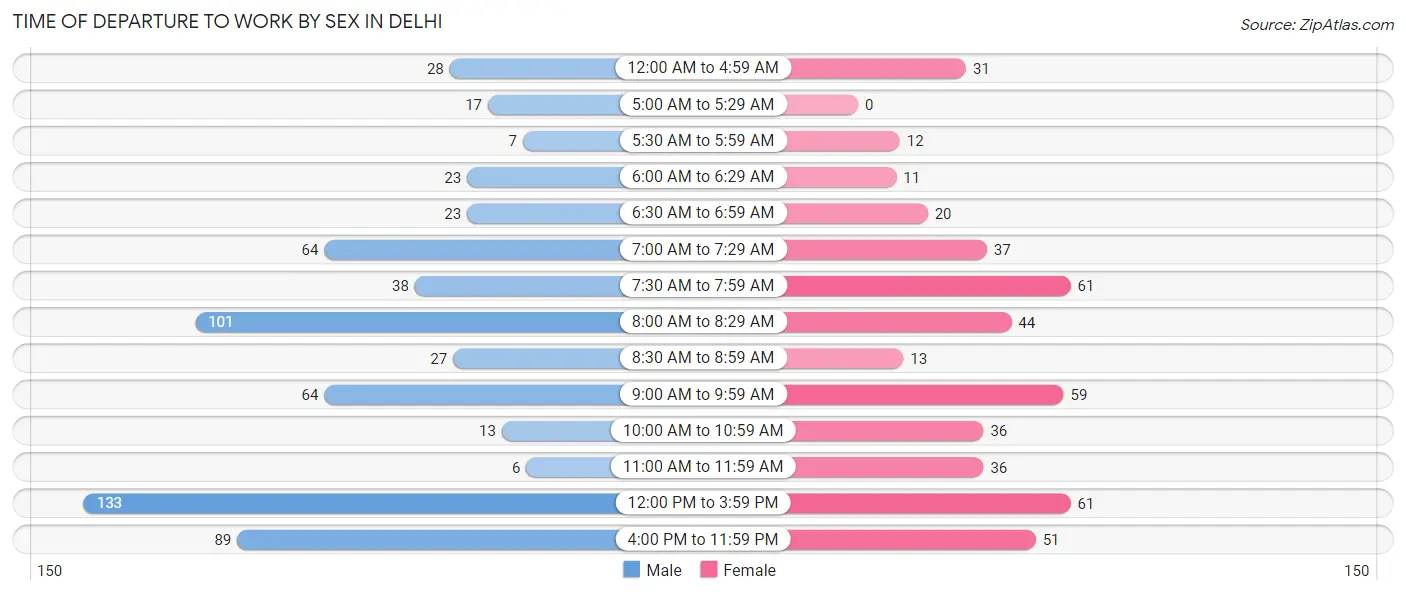
| Time of Departure | Male | Female |
| 12:00 AM to 4:59 AM | 28 (4.4%) | 31 (6.6%) |
| 5:00 AM to 5:29 AM | 17 (2.7%) | 0 (0.0%) |
| 5:30 AM to 5:59 AM | 7 (1.1%) | 12 (2.5%) |
| 6:00 AM to 6:29 AM | 23 (3.6%) | 11 (2.3%) |
| 6:30 AM to 6:59 AM | 23 (3.6%) | 20 (4.2%) |
| 7:00 AM to 7:29 AM | 64 (10.1%) | 37 (7.8%) |
| 7:30 AM to 7:59 AM | 38 (6.0%) | 61 (12.9%) |
| 8:00 AM to 8:29 AM | 101 (16.0%) | 44 (9.3%) |
| 8:30 AM to 8:59 AM | 27 (4.3%) | 13 (2.8%) |
| 9:00 AM to 9:59 AM | 64 (10.1%) | 59 (12.5%) |
| 10:00 AM to 10:59 AM | 13 (2.1%) | 36 (7.6%) |
| 11:00 AM to 11:59 AM | 6 (0.9%) | 36 (7.6%) |
| 12:00 PM to 3:59 PM | 133 (21.0%) | 61 (12.9%) |
| 4:00 PM to 11:59 PM | 89 (14.1%) | 51 (10.8%) |
| Total | 633 (100.0%) | 472 (100.0%) |
Housing Occupancy in Delhi
Occupancy by Ownership in Delhi
Of the total 801 dwellings in Delhi, owner-occupied units account for 405 (50.6%), while renter-occupied units make up 396 (49.4%).
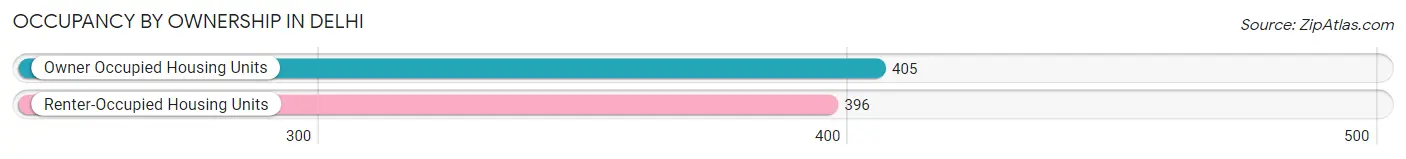
| Occupancy | # Housing Units | % Housing Units |
| Owner Occupied Housing Units | 405 | 50.6% |
| Renter-Occupied Housing Units | 396 | 49.4% |
| Total Occupied Housing Units | 801 | 100.0% |
Occupancy by Household Size in Delhi
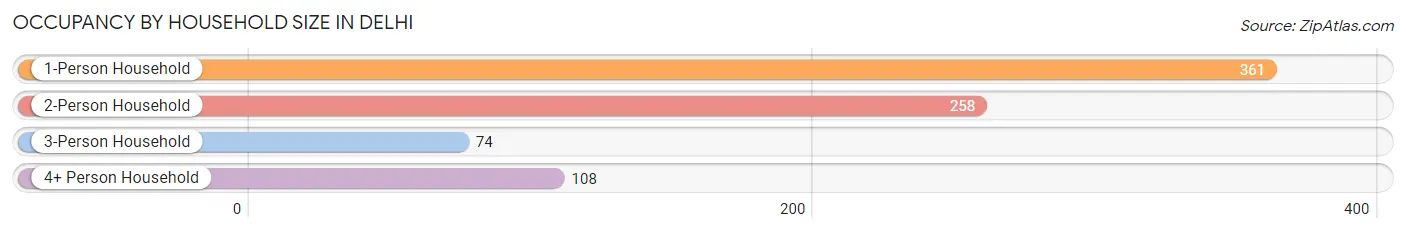
| Household Size | # Housing Units | % Housing Units |
| 1-Person Household | 361 | 45.1% |
| 2-Person Household | 258 | 32.2% |
| 3-Person Household | 74 | 9.2% |
| 4+ Person Household | 108 | 13.5% |
| Total Housing Units | 801 | 100.0% |
Occupancy by Ownership by Household Size in Delhi
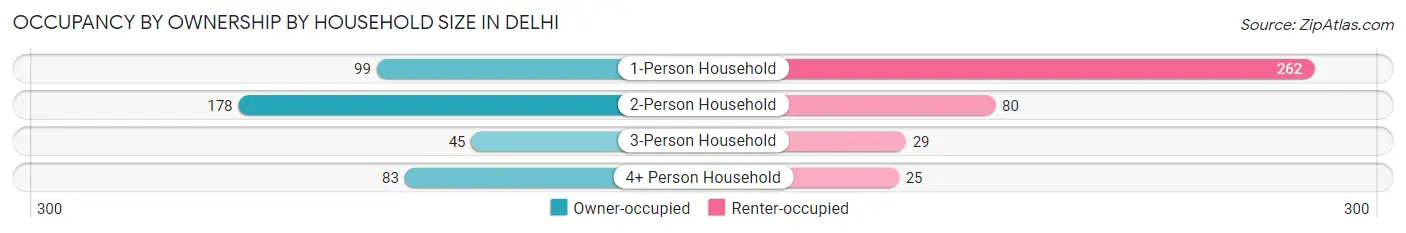
| Household Size | Owner-occupied | Renter-occupied |
| 1-Person Household | 99 (27.4%) | 262 (72.6%) |
| 2-Person Household | 178 (69.0%) | 80 (31.0%) |
| 3-Person Household | 45 (60.8%) | 29 (39.2%) |
| 4+ Person Household | 83 (76.8%) | 25 (23.2%) |
| Total Housing Units | 405 (50.6%) | 396 (49.4%) |
Occupancy by Educational Attainment in Delhi
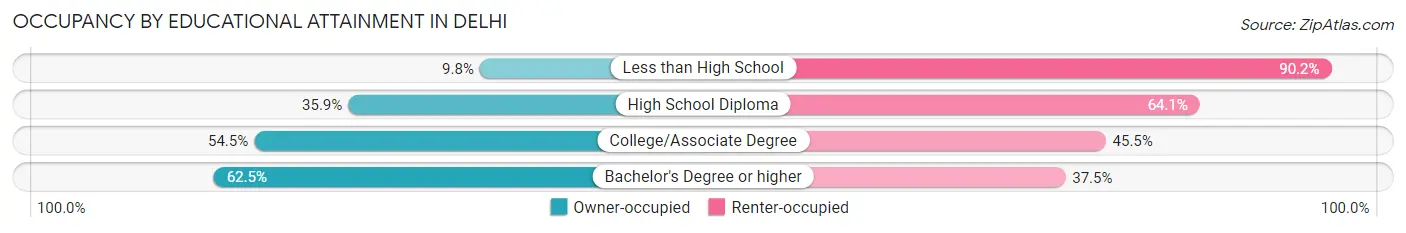
| Household Size | Owner-occupied | Renter-occupied |
| Less than High School | 4 (9.8%) | 37 (90.2%) |
| High School Diploma | 71 (35.9%) | 127 (64.1%) |
| College/Associate Degree | 145 (54.5%) | 121 (45.5%) |
| Bachelor's Degree or higher | 185 (62.5%) | 111 (37.5%) |
Occupancy by Age of Householder in Delhi
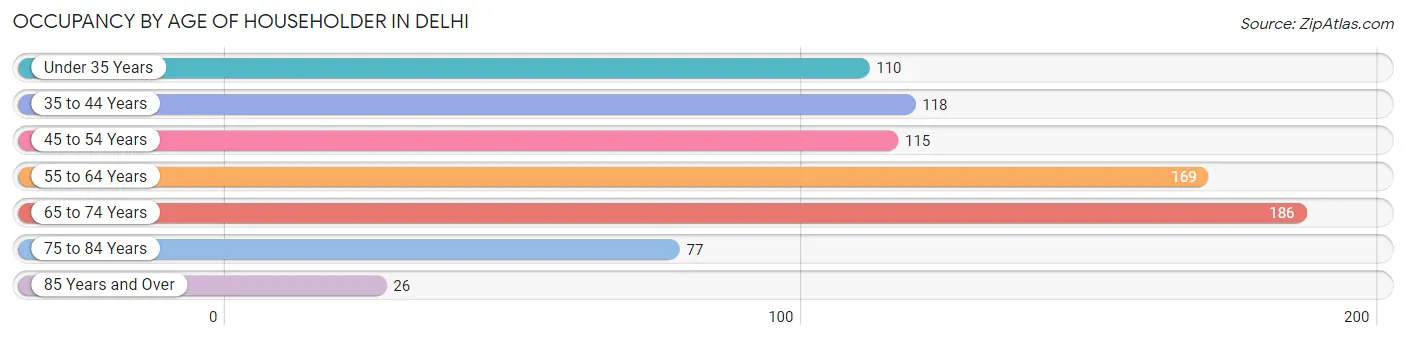
| Age Bracket | # Households | % Households |
| Under 35 Years | 110 | 13.7% |
| 35 to 44 Years | 118 | 14.7% |
| 45 to 54 Years | 115 | 14.4% |
| 55 to 64 Years | 169 | 21.1% |
| 65 to 74 Years | 186 | 23.2% |
| 75 to 84 Years | 77 | 9.6% |
| 85 Years and Over | 26 | 3.3% |
| Total | 801 | 100.0% |
Housing Finances in Delhi
Median Income by Occupancy in Delhi
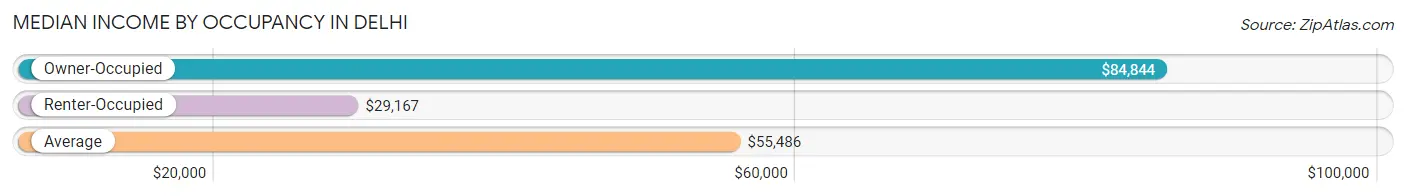
| Occupancy Type | # Households | Median Income |
| Owner-Occupied | 405 (50.6%) | $84,844 |
| Renter-Occupied | 396 (49.4%) | $29,167 |
| Average | 801 (100.0%) | $55,486 |
Occupancy by Householder Income Bracket in Delhi
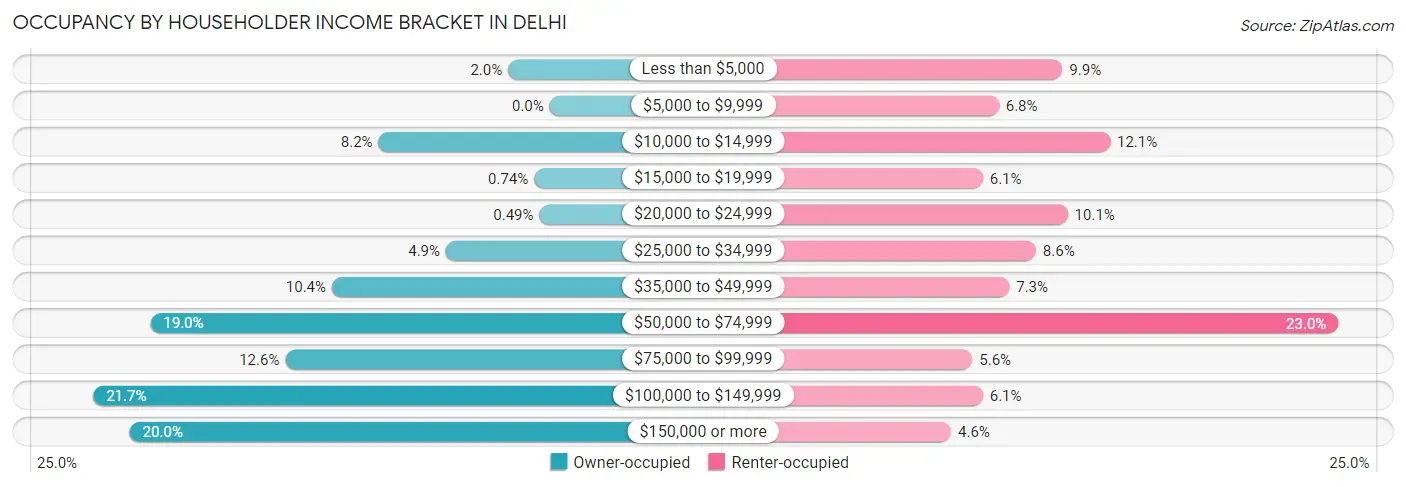
| Income Bracket | Owner-occupied | Renter-occupied |
| Less than $5,000 | 8 (2.0%) | 39 (9.9%) |
| $5,000 to $9,999 | 0 (0.0%) | 27 (6.8%) |
| $10,000 to $14,999 | 33 (8.2%) | 48 (12.1%) |
| $15,000 to $19,999 | 3 (0.7%) | 24 (6.1%) |
| $20,000 to $24,999 | 2 (0.5%) | 40 (10.1%) |
| $25,000 to $34,999 | 20 (4.9%) | 34 (8.6%) |
| $35,000 to $49,999 | 42 (10.4%) | 29 (7.3%) |
| $50,000 to $74,999 | 77 (19.0%) | 91 (23.0%) |
| $75,000 to $99,999 | 51 (12.6%) | 22 (5.6%) |
| $100,000 to $149,999 | 88 (21.7%) | 24 (6.1%) |
| $150,000 or more | 81 (20.0%) | 18 (4.5%) |
| Total | 405 (100.0%) | 396 (100.0%) |
Monthly Housing Cost Tiers in Delhi
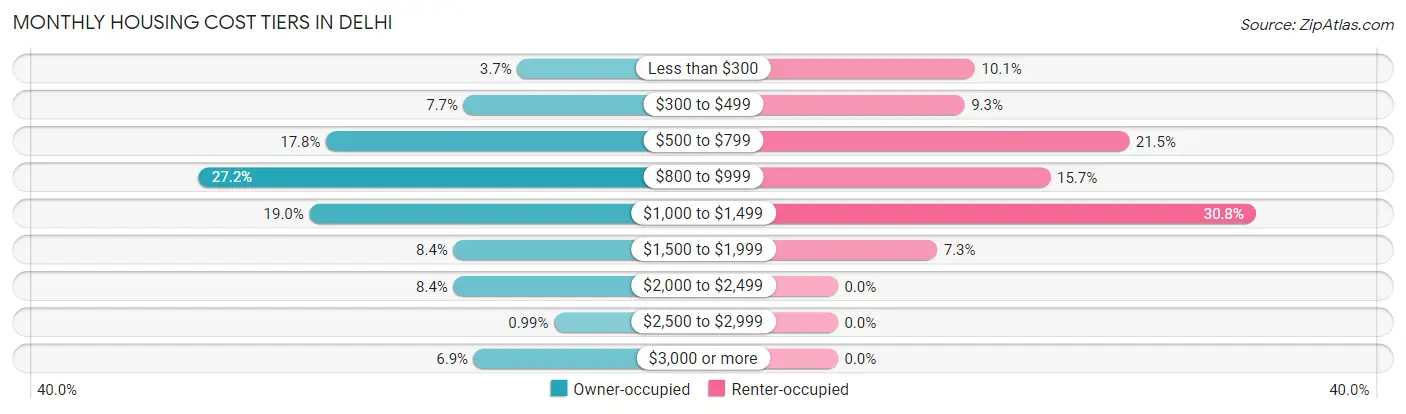
| Monthly Cost | Owner-occupied | Renter-occupied |
| Less than $300 | 15 (3.7%) | 40 (10.1%) |
| $300 to $499 | 31 (7.6%) | 37 (9.3%) |
| $500 to $799 | 72 (17.8%) | 85 (21.5%) |
| $800 to $999 | 110 (27.2%) | 62 (15.7%) |
| $1,000 to $1,499 | 77 (19.0%) | 122 (30.8%) |
| $1,500 to $1,999 | 34 (8.4%) | 29 (7.3%) |
| $2,000 to $2,499 | 34 (8.4%) | 0 (0.0%) |
| $2,500 to $2,999 | 4 (1.0%) | 0 (0.0%) |
| $3,000 or more | 28 (6.9%) | 0 (0.0%) |
| Total | 405 (100.0%) | 396 (100.0%) |
Physical Housing Characteristics in Delhi
Housing Structures in Delhi
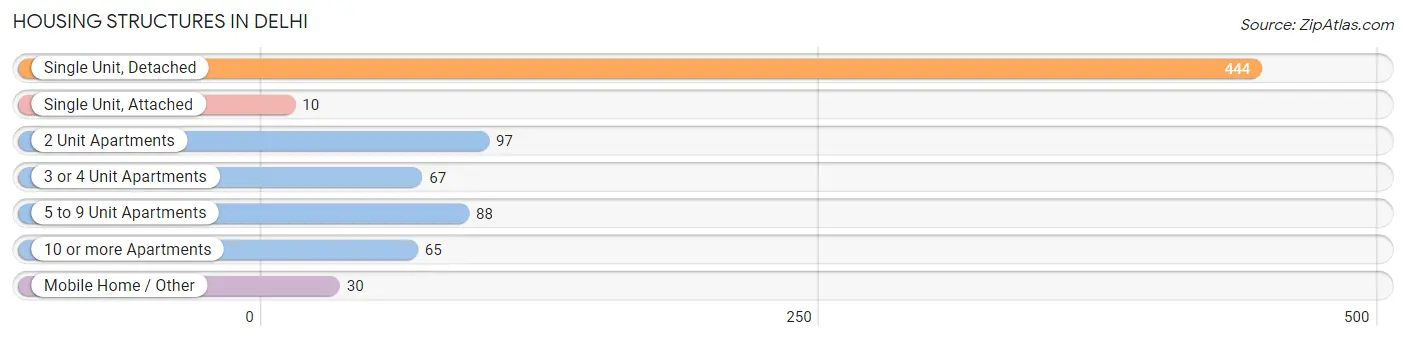
| Structure Type | # Housing Units | % Housing Units |
| Single Unit, Detached | 444 | 55.4% |
| Single Unit, Attached | 10 | 1.3% |
| 2 Unit Apartments | 97 | 12.1% |
| 3 or 4 Unit Apartments | 67 | 8.4% |
| 5 to 9 Unit Apartments | 88 | 11.0% |
| 10 or more Apartments | 65 | 8.1% |
| Mobile Home / Other | 30 | 3.7% |
| Total | 801 | 100.0% |
Housing Structures by Occupancy in Delhi
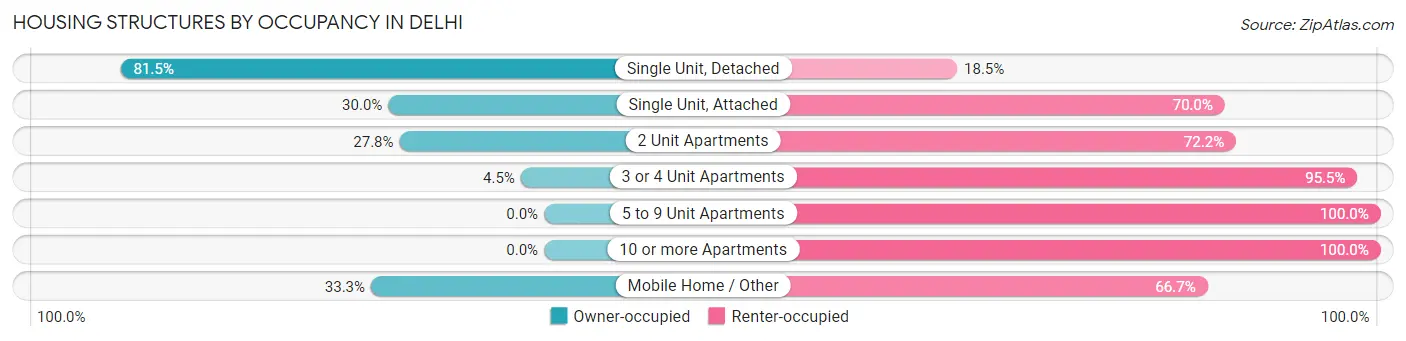
| Structure Type | Owner-occupied | Renter-occupied |
| Single Unit, Detached | 362 (81.5%) | 82 (18.5%) |
| Single Unit, Attached | 3 (30.0%) | 7 (70.0%) |
| 2 Unit Apartments | 27 (27.8%) | 70 (72.2%) |
| 3 or 4 Unit Apartments | 3 (4.5%) | 64 (95.5%) |
| 5 to 9 Unit Apartments | 0 (0.0%) | 88 (100.0%) |
| 10 or more Apartments | 0 (0.0%) | 65 (100.0%) |
| Mobile Home / Other | 10 (33.3%) | 20 (66.7%) |
| Total | 405 (50.6%) | 396 (49.4%) |
Housing Structures by Number of Rooms in Delhi
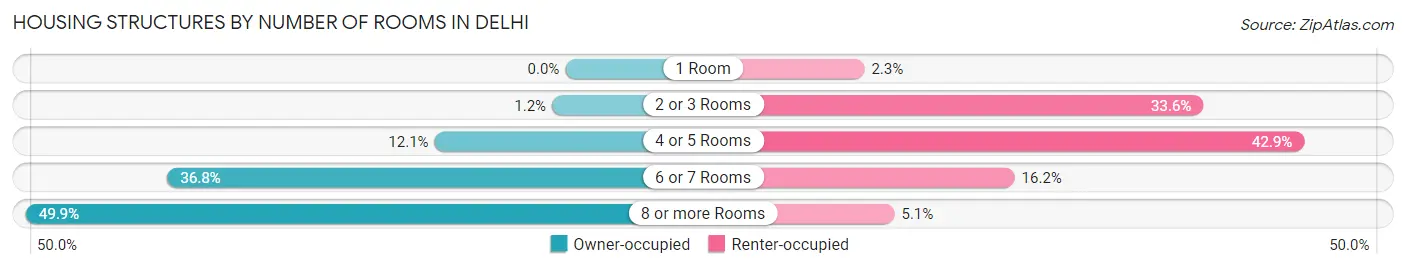
| Number of Rooms | Owner-occupied | Renter-occupied |
| 1 Room | 0 (0.0%) | 9 (2.3%) |
| 2 or 3 Rooms | 5 (1.2%) | 133 (33.6%) |
| 4 or 5 Rooms | 49 (12.1%) | 170 (42.9%) |
| 6 or 7 Rooms | 149 (36.8%) | 64 (16.2%) |
| 8 or more Rooms | 202 (49.9%) | 20 (5.1%) |
| Total | 405 (100.0%) | 396 (100.0%) |
Housing Structure by Heating Type in Delhi
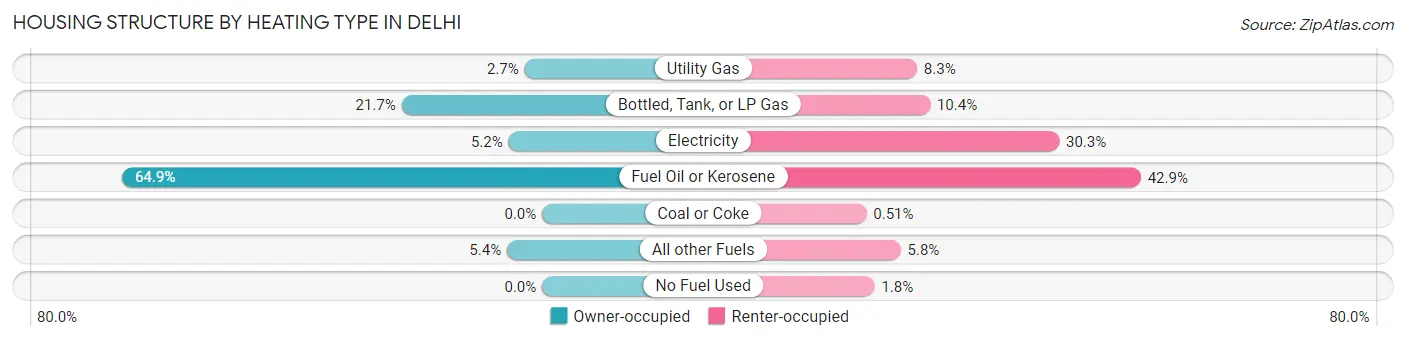
| Heating Type | Owner-occupied | Renter-occupied |
| Utility Gas | 11 (2.7%) | 33 (8.3%) |
| Bottled, Tank, or LP Gas | 88 (21.7%) | 41 (10.3%) |
| Electricity | 21 (5.2%) | 120 (30.3%) |
| Fuel Oil or Kerosene | 263 (64.9%) | 170 (42.9%) |
| Coal or Coke | 0 (0.0%) | 2 (0.5%) |
| All other Fuels | 22 (5.4%) | 23 (5.8%) |
| No Fuel Used | 0 (0.0%) | 7 (1.8%) |
| Total | 405 (100.0%) | 396 (100.0%) |
Household Vehicle Usage in Delhi
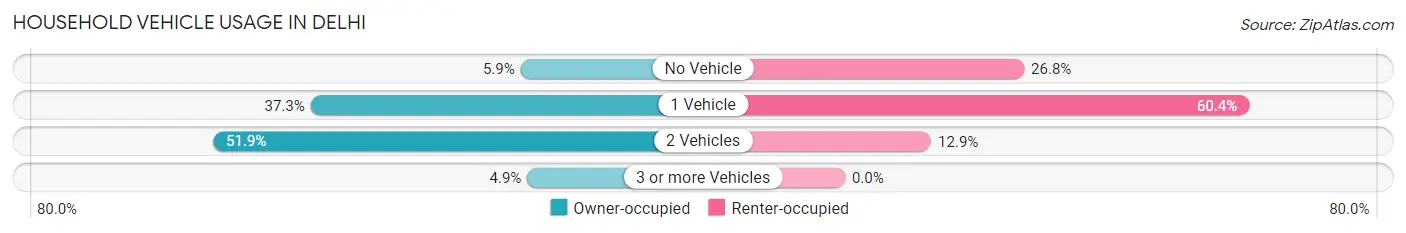
| Vehicles per Household | Owner-occupied | Renter-occupied |
| No Vehicle | 24 (5.9%) | 106 (26.8%) |
| 1 Vehicle | 151 (37.3%) | 239 (60.4%) |
| 2 Vehicles | 210 (51.8%) | 51 (12.9%) |
| 3 or more Vehicles | 20 (4.9%) | 0 (0.0%) |
| Total | 405 (100.0%) | 396 (100.0%) |
Real Estate & Mortgages in Delhi
Real Estate and Mortgage Overview in Delhi
| Characteristic | Without Mortgage | With Mortgage |
| Housing Units | 181 | 224 |
| Median Property Value | $178,000 | $177,900 |
| Median Household Income | $69,063 | $64 |
| Monthly Housing Costs | $682 | $28 |
| Real Estate Taxes | $3,865 | $0 |
Property Value by Mortgage Status in Delhi
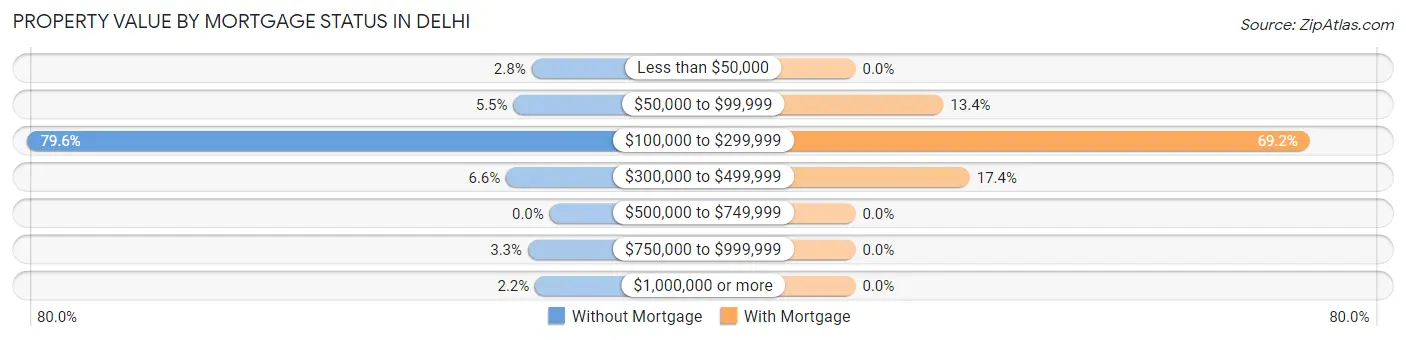
| Property Value | Without Mortgage | With Mortgage |
| Less than $50,000 | 5 (2.8%) | 0 (0.0%) |
| $50,000 to $99,999 | 10 (5.5%) | 30 (13.4%) |
| $100,000 to $299,999 | 144 (79.6%) | 155 (69.2%) |
| $300,000 to $499,999 | 12 (6.6%) | 39 (17.4%) |
| $500,000 to $749,999 | 0 (0.0%) | 0 (0.0%) |
| $750,000 to $999,999 | 6 (3.3%) | 0 (0.0%) |
| $1,000,000 or more | 4 (2.2%) | 0 (0.0%) |
| Total | 181 (100.0%) | 224 (100.0%) |
Household Income by Mortgage Status in Delhi
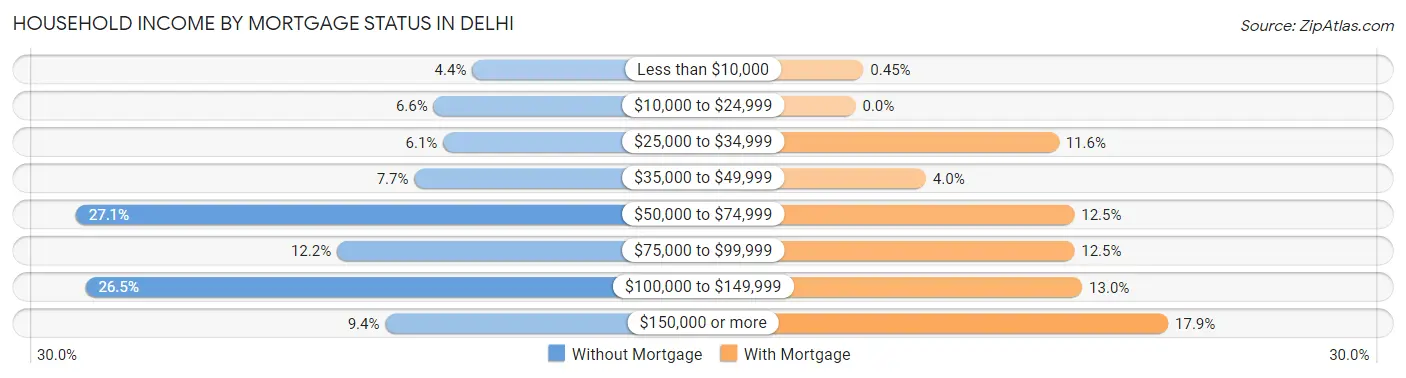
| Household Income | Without Mortgage | With Mortgage |
| Less than $10,000 | 8 (4.4%) | 1 (0.4%) |
| $10,000 to $24,999 | 12 (6.6%) | 0 (0.0%) |
| $25,000 to $34,999 | 11 (6.1%) | 26 (11.6%) |
| $35,000 to $49,999 | 14 (7.7%) | 9 (4.0%) |
| $50,000 to $74,999 | 49 (27.1%) | 28 (12.5%) |
| $75,000 to $99,999 | 22 (12.1%) | 28 (12.5%) |
| $100,000 to $149,999 | 48 (26.5%) | 29 (13.0%) |
| $150,000 or more | 17 (9.4%) | 40 (17.9%) |
| Total | 181 (100.0%) | 224 (100.0%) |
Property Value to Household Income Ratio in Delhi
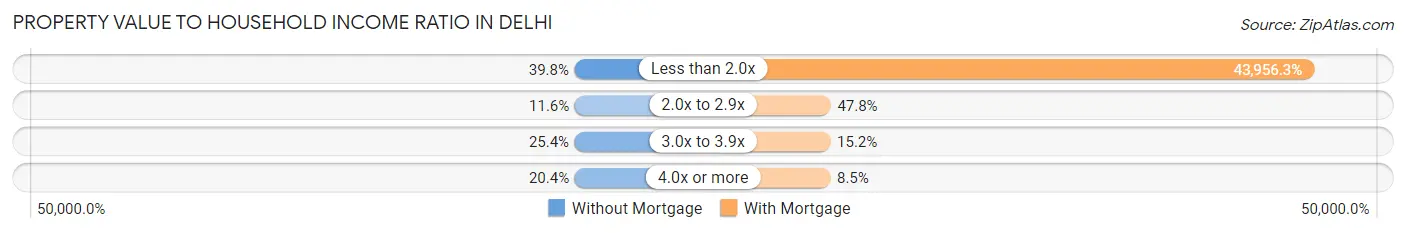
| Value-to-Income Ratio | Without Mortgage | With Mortgage |
| Less than 2.0x | 72 (39.8%) | 98,462 (43,956.2%) |
| 2.0x to 2.9x | 21 (11.6%) | 107 (47.8%) |
| 3.0x to 3.9x | 46 (25.4%) | 34 (15.2%) |
| 4.0x or more | 37 (20.4%) | 19 (8.5%) |
| Total | 181 (100.0%) | 224 (100.0%) |
Real Estate Taxes by Mortgage Status in Delhi
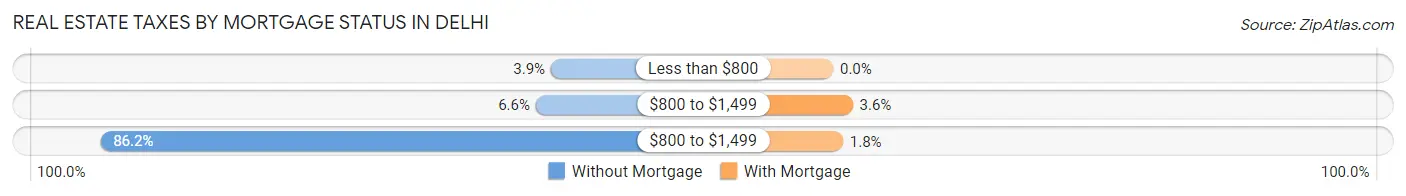
| Property Taxes | Without Mortgage | With Mortgage |
| Less than $800 | 7 (3.9%) | 0 (0.0%) |
| $800 to $1,499 | 12 (6.6%) | 8 (3.6%) |
| $800 to $1,499 | 156 (86.2%) | 4 (1.8%) |
| Total | 181 (100.0%) | 224 (100.0%) |
Health & Disability in Delhi
Health Insurance Coverage by Age in Delhi
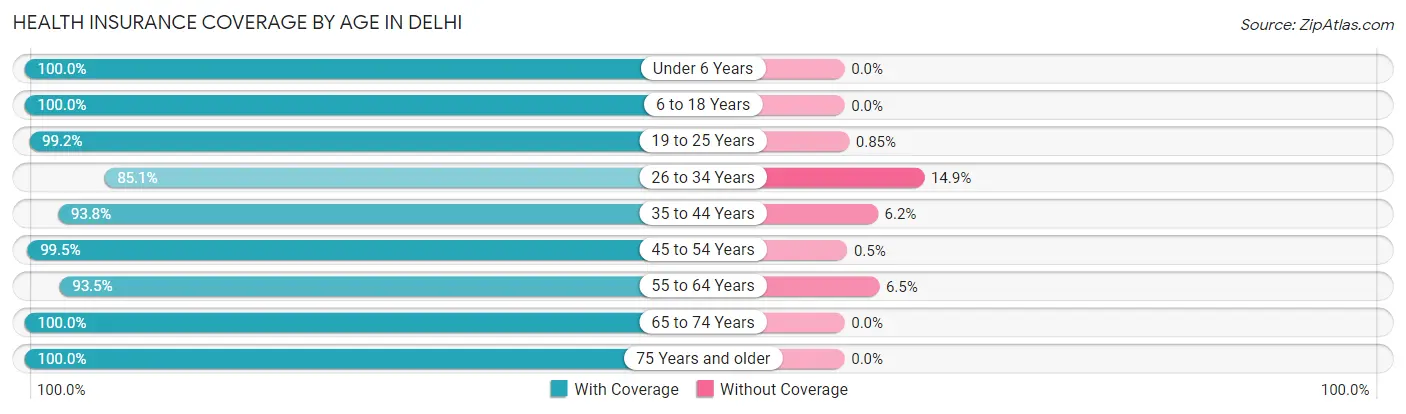
| Age Bracket | With Coverage | Without Coverage |
| Under 6 Years | 82 (100.0%) | 0 (0.0%) |
| 6 to 18 Years | 730 (100.0%) | 0 (0.0%) |
| 19 to 25 Years | 1,055 (99.2%) | 9 (0.9%) |
| 26 to 34 Years | 126 (85.1%) | 22 (14.9%) |
| 35 to 44 Years | 166 (93.8%) | 11 (6.2%) |
| 45 to 54 Years | 198 (99.5%) | 1 (0.5%) |
| 55 to 64 Years | 260 (93.5%) | 18 (6.5%) |
| 65 to 74 Years | 274 (100.0%) | 0 (0.0%) |
| 75 Years and older | 136 (100.0%) | 0 (0.0%) |
| Total | 3,027 (98.0%) | 61 (2.0%) |
Health Insurance Coverage by Citizenship Status in Delhi
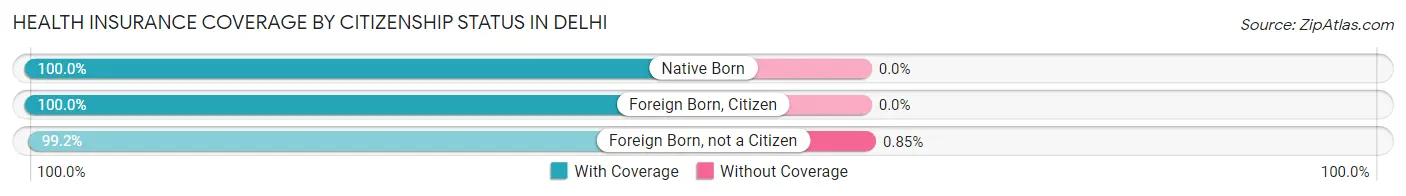
| Citizenship Status | With Coverage | Without Coverage |
| Native Born | 82 (100.0%) | 0 (0.0%) |
| Foreign Born, Citizen | 730 (100.0%) | 0 (0.0%) |
| Foreign Born, not a Citizen | 1,055 (99.2%) | 9 (0.9%) |
Health Insurance Coverage by Household Income in Delhi
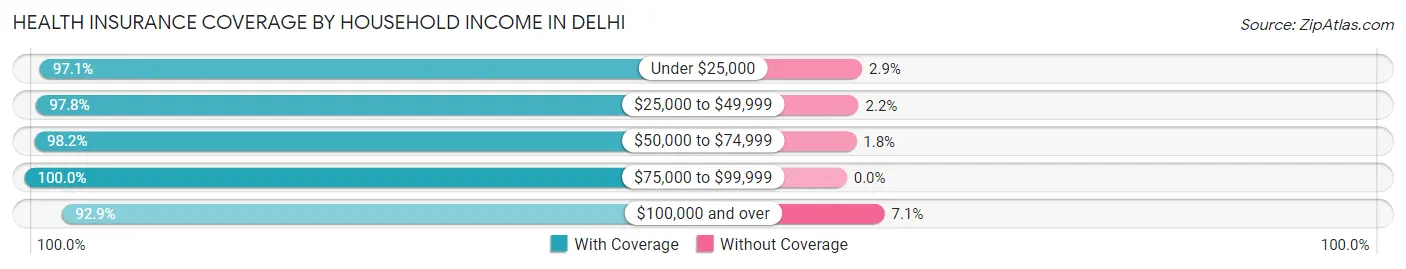
| Household Income | With Coverage | Without Coverage |
| Under $25,000 | 305 (97.1%) | 9 (2.9%) |
| $25,000 to $49,999 | 177 (97.8%) | 4 (2.2%) |
| $50,000 to $74,999 | 383 (98.2%) | 7 (1.8%) |
| $75,000 to $99,999 | 183 (100.0%) | 0 (0.0%) |
| $100,000 and over | 538 (92.9%) | 41 (7.1%) |
Public vs Private Health Insurance Coverage by Age in Delhi
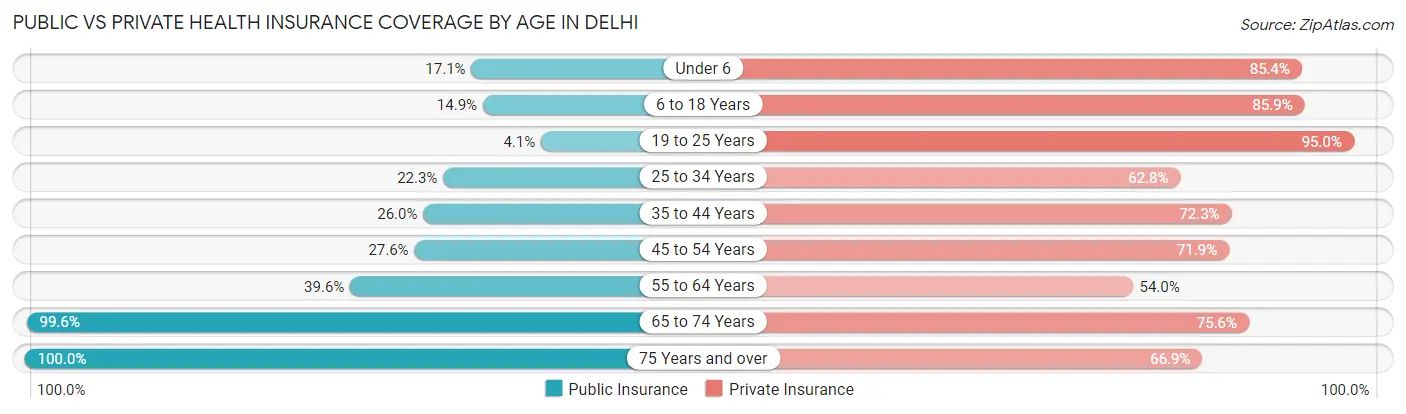
| Age Bracket | Public Insurance | Private Insurance |
| Under 6 | 14 (17.1%) | 70 (85.4%) |
| 6 to 18 Years | 109 (14.9%) | 627 (85.9%) |
| 19 to 25 Years | 44 (4.1%) | 1,011 (95.0%) |
| 25 to 34 Years | 33 (22.3%) | 93 (62.8%) |
| 35 to 44 Years | 46 (26.0%) | 128 (72.3%) |
| 45 to 54 Years | 55 (27.6%) | 143 (71.9%) |
| 55 to 64 Years | 110 (39.6%) | 150 (54.0%) |
| 65 to 74 Years | 273 (99.6%) | 207 (75.5%) |
| 75 Years and over | 136 (100.0%) | 91 (66.9%) |
| Total | 820 (26.6%) | 2,520 (81.6%) |
Disability Status by Sex by Age in Delhi
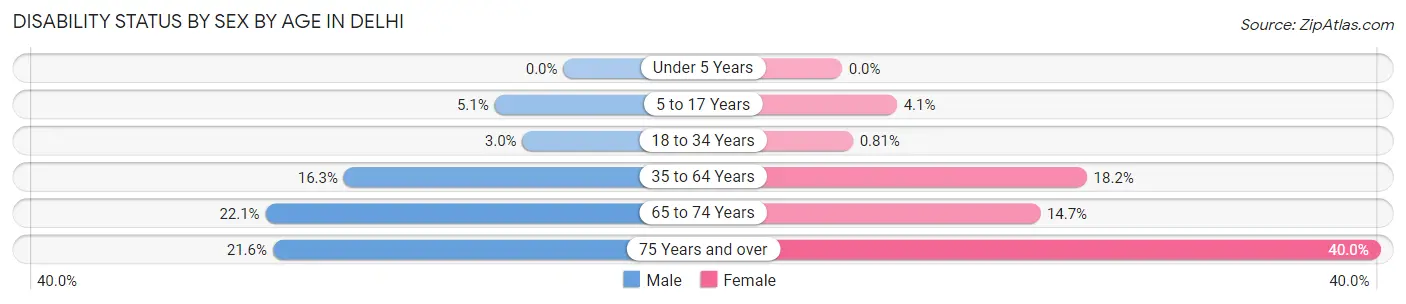
| Age Bracket | Male | Female |
| Under 5 Years | 0 (0.0%) | 0 (0.0%) |
| 5 to 17 Years | 7 (5.1%) | 6 (4.1%) |
| 18 to 34 Years | 28 (3.0%) | 6 (0.8%) |
| 35 to 64 Years | 60 (16.3%) | 52 (18.2%) |
| 65 to 74 Years | 23 (22.1%) | 25 (14.7%) |
| 75 Years and over | 11 (21.6%) | 34 (40.0%) |
Disability Class by Sex by Age in Delhi
Disability Class: Hearing Difficulty
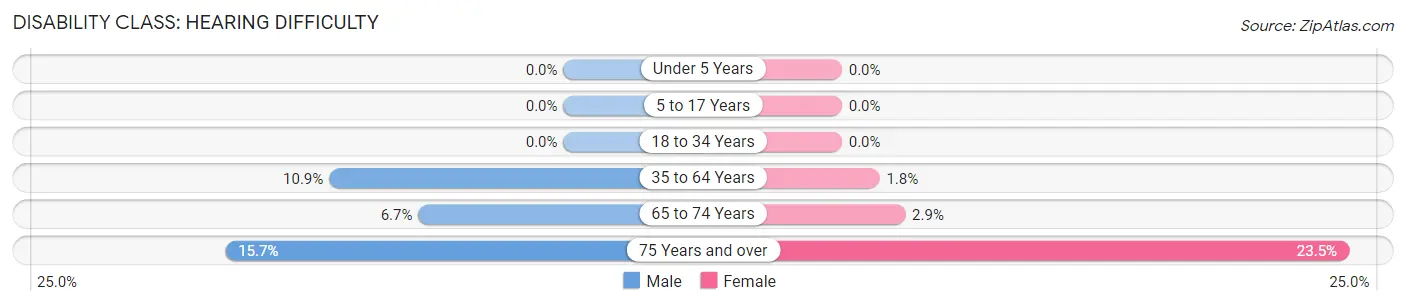
| Age Bracket | Male | Female |
| Under 5 Years | 0 (0.0%) | 0 (0.0%) |
| 5 to 17 Years | 0 (0.0%) | 0 (0.0%) |
| 18 to 34 Years | 0 (0.0%) | 0 (0.0%) |
| 35 to 64 Years | 40 (10.9%) | 5 (1.8%) |
| 65 to 74 Years | 7 (6.7%) | 5 (2.9%) |
| 75 Years and over | 8 (15.7%) | 20 (23.5%) |
Disability Class: Vision Difficulty
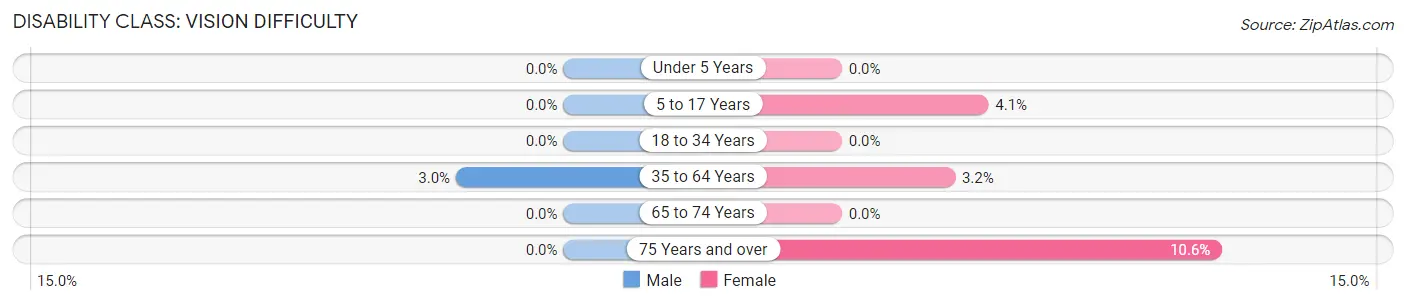
| Age Bracket | Male | Female |
| Under 5 Years | 0 (0.0%) | 0 (0.0%) |
| 5 to 17 Years | 0 (0.0%) | 6 (4.1%) |
| 18 to 34 Years | 0 (0.0%) | 0 (0.0%) |
| 35 to 64 Years | 11 (3.0%) | 9 (3.2%) |
| 65 to 74 Years | 0 (0.0%) | 0 (0.0%) |
| 75 Years and over | 0 (0.0%) | 9 (10.6%) |
Disability Class: Cognitive Difficulty
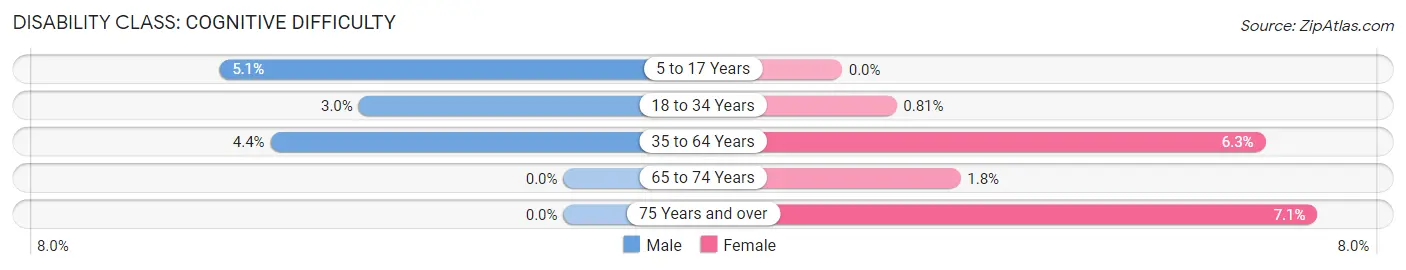
| Age Bracket | Male | Female |
| 5 to 17 Years | 7 (5.1%) | 0 (0.0%) |
| 18 to 34 Years | 28 (3.0%) | 6 (0.8%) |
| 35 to 64 Years | 16 (4.3%) | 18 (6.3%) |
| 65 to 74 Years | 0 (0.0%) | 3 (1.8%) |
| 75 Years and over | 0 (0.0%) | 6 (7.1%) |
Disability Class: Ambulatory Difficulty
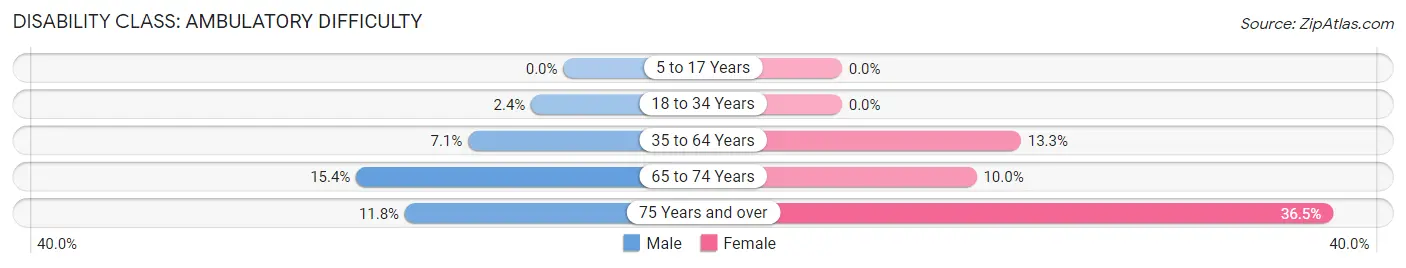
| Age Bracket | Male | Female |
| 5 to 17 Years | 0 (0.0%) | 0 (0.0%) |
| 18 to 34 Years | 22 (2.4%) | 0 (0.0%) |
| 35 to 64 Years | 26 (7.1%) | 38 (13.3%) |
| 65 to 74 Years | 16 (15.4%) | 17 (10.0%) |
| 75 Years and over | 6 (11.8%) | 31 (36.5%) |
Disability Class: Self-Care Difficulty
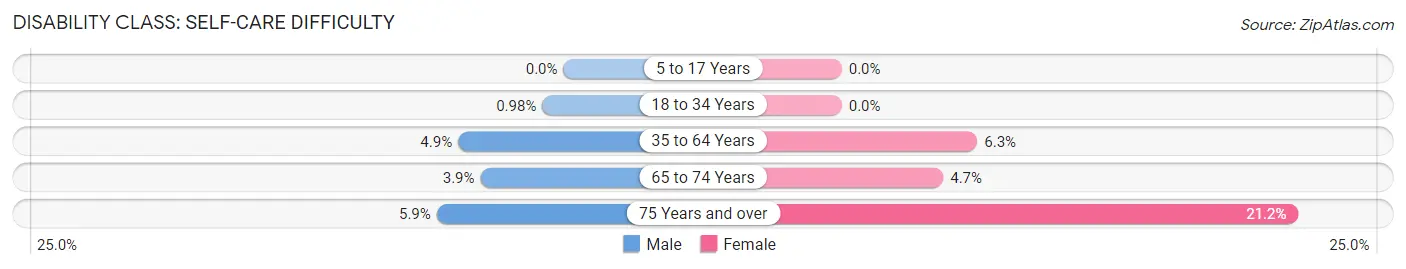
| Age Bracket | Male | Female |
| 5 to 17 Years | 0 (0.0%) | 0 (0.0%) |
| 18 to 34 Years | 9 (1.0%) | 0 (0.0%) |
| 35 to 64 Years | 18 (4.9%) | 18 (6.3%) |
| 65 to 74 Years | 4 (3.8%) | 8 (4.7%) |
| 75 Years and over | 3 (5.9%) | 18 (21.2%) |
Technology Access in Delhi
Computing Device Access in Delhi
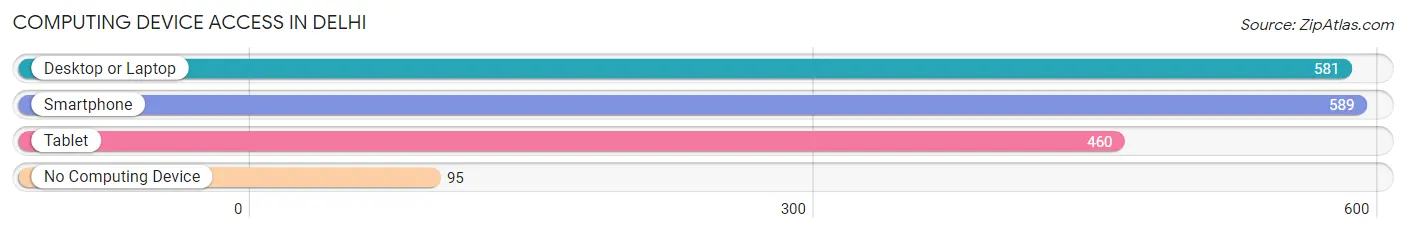
| Device Type | # Households | % Households |
| Desktop or Laptop | 581 | 72.5% |
| Smartphone | 589 | 73.5% |
| Tablet | 460 | 57.4% |
| No Computing Device | 95 | 11.9% |
| Total | 801 | 100.0% |
Internet Access in Delhi
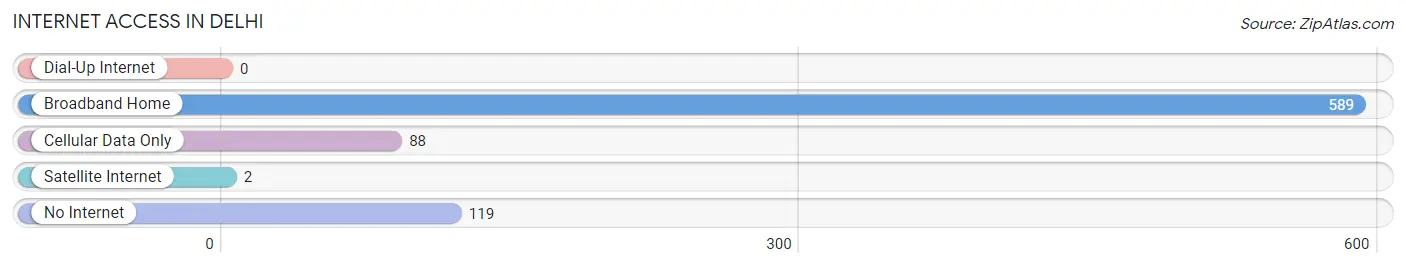
| Internet Type | # Households | % Households |
| Dial-Up Internet | 0 | 0.0% |
| Broadband Home | 589 | 73.5% |
| Cellular Data Only | 88 | 11.0% |
| Satellite Internet | 2 | 0.3% |
| No Internet | 119 | 14.9% |
| Total | 801 | 100.0% |
Delhi Summary
Delhi is a town located in the Catskill Mountains of Delaware County, New York, United States. The population was 3,097 at the 2010 census. The town is named after the capital of India.
Geography
Delhi is located in the western part of Delaware County, in the Catskill Mountains. It is bordered to the north by the town of Andes, to the east by the town of Bovina, to the south by the town of Hamden, and to the west by the town of Middletown.
According to the United States Census Bureau, the town has a total area of 39.7sqmi, of which 39.6sqmi is land and 0.1sqmi, or 0.25%, is water.
The east town line is the border of Ulster County
History
Delhi was first settled around 1790 The town was formed in 1798 from the town of Middletown
The town was named after the capital of India Delhi
Demographics
As of the census of 2000, there were 3,072 people, 1,093 households, and 790 families residing in the town. The population density was 77.6 people per square mile (29.9/km^2). There were 1,541 housing units at an average density of 38.8 per square mile (15.0/km^2). The racial makeup of the town was 97.45% White, 0.36% African American, 0.13% Native American, 0.36% Asian, 0.03% Pacific Islander, 0.59% from other races, and 0.99% from two or more races. Hispanic or Latino of any race were 1.45% of the population.
There were 1,093 households, out of which 33.7% had children under the age of 18 living with them, 57.2% were married couples living together, 9.7% had a female householder with no husband present, and 28.7% were non-families. 22.7% of all households were made up of individuals, and 10.2% had someone living alone who was 65 years of age or older. The average household size was 2.60 and the average family size was 3.04.
In the town, the population was spread out, with 25.2% under the age of 18, 7.2% from 18 to 24, 28.2% from 25 to 44, 24.2% from 45 to 64, and 15.2% who were 65 years of age or older. The median age was 38 years. For every 100 females, there were 97.2 males. For every 100 females age 18 and over, there were 94.2 males.
The median income for a household in the town was $35,938, and the median income for a family was $41,250. Males had a median income of $30,917 versus $22,917 for females. The per capita income for the town was $16,945. About 8.2% of families and 11.2% of the population were below the poverty line, including 14.2% of those under age 18 and 8.2% of those age 65 or over.
Economy
Delhi is a rural community with a strong agricultural base. Dairy farming is the primary agricultural activity, with many farms producing milk for sale to local dairy cooperatives. Other agricultural activities include beef and sheep production, as well as vegetable and fruit production.
The town is also home to several small businesses, including a few restaurants, a few retail stores, and a few service businesses. The town is also home to a few small manufacturing businesses, including a furniture manufacturer and a woodworking shop.
The town is served by the Delaware County Industrial Development Agency, which provides assistance to businesses in the area. The agency provides assistance with financing, tax incentives, and other services.
Delhi is also home to a few tourist attractions, including the Catskill Mountain Railroad, a scenic railway that runs through the town. The town is also home to the Delhi Historical Society, which operates a museum and offers educational programs.
Common Questions
What is Per Capita Income in Delhi?
Per Capita income in Delhi is $20,954.
What is the Median Family Income in Delhi?
Median Family Income in Delhi is $90,909.
What is the Median Household income in Delhi?
Median Household Income in Delhi is $55,486.
What is Income or Wage Gap in Delhi?
Income or Wage Gap in Delhi is 24.9%.
Women in Delhi earn 75.1 cents for every dollar earned by a man.
What is Family Income Deficit in Delhi?
Family Income Deficit in Delhi is $8,438.
Families that are below poverty line in Delhi earn $8,438 less on average than the poverty threshold level.
What is Inequality or Gini Index in Delhi?
Inequality or Gini Index in Delhi is 0.46.
What is the Total Population of Delhi?
Total Population of Delhi is 3,148.
What is the Total Male Population of Delhi?
Total Male Population of Delhi is 1,671.
What is the Total Female Population of Delhi?
Total Female Population of Delhi is 1,477.
What is the Ratio of Males per 100 Females in Delhi?
There are 113.13 Males per 100 Females in Delhi.
What is the Ratio of Females per 100 Males in Delhi?
There are 88.39 Females per 100 Males in Delhi.
What is the Median Population Age in Delhi?
Median Population Age in Delhi is 20.9 Years.
What is the Average Family Size in Delhi
Average Family Size in Delhi is 2.9 People.
What is the Average Household Size in Delhi
Average Household Size in Delhi is 2.1 People.
How Large is the Labor Force in Delhi?
There are 1,324 People in the Labor Forcein in Delhi.
What is the Percentage of People in the Labor Force in Delhi?
46.0% of People are in the Labor Force in Delhi.
What is the Unemployment Rate in Delhi?
Unemployment Rate in Delhi is 5.5%.