Cities with the Highest Percentage of Population with a Degree in Business in New York
RELATED REPORTS & OPTIONS
Business
New York
Compare Cities
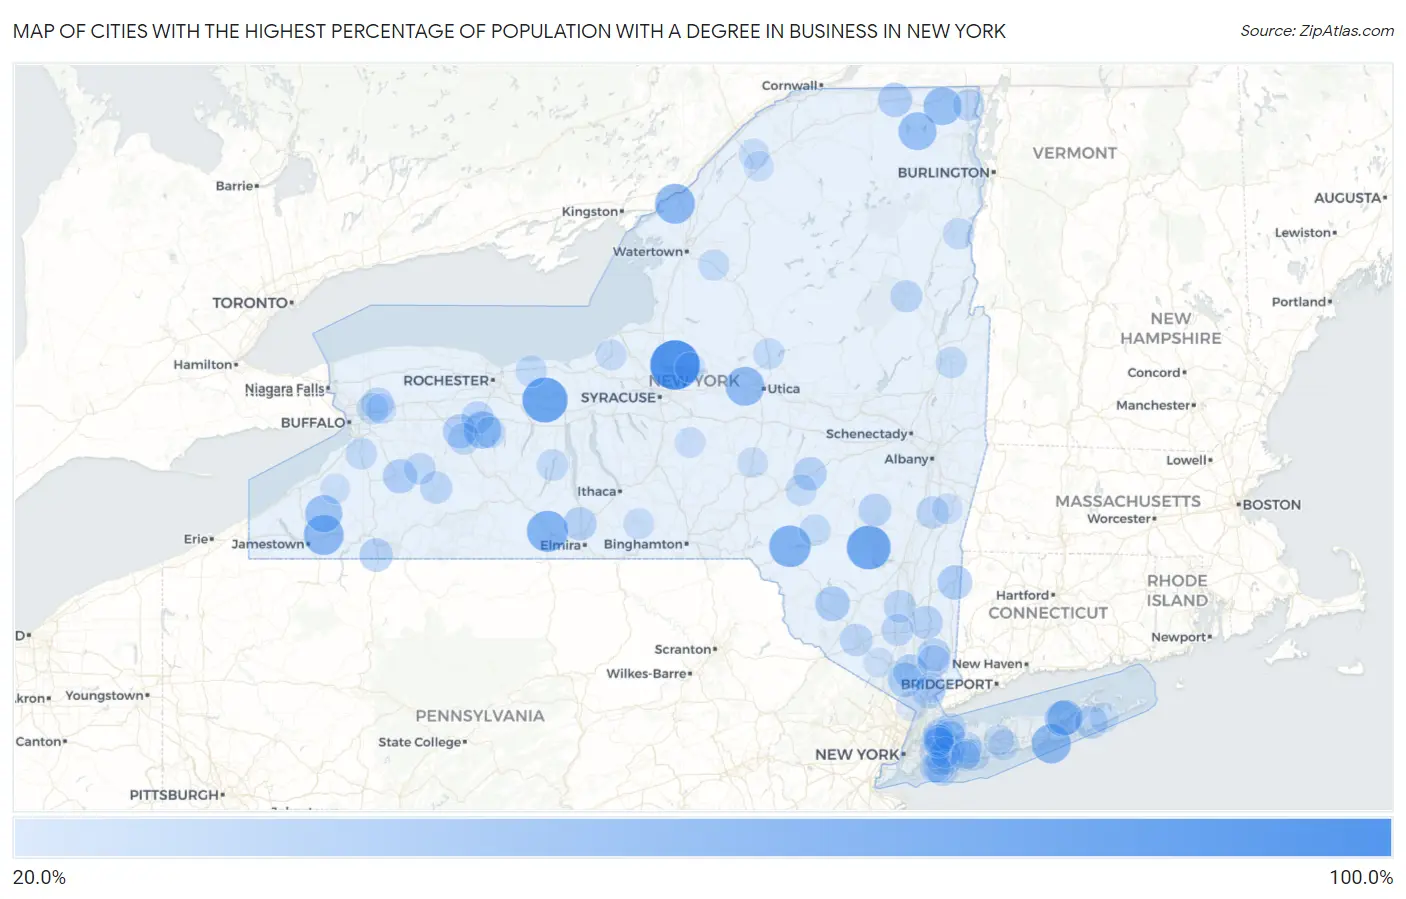
Map of Cities with the Highest Percentage of Population with a Degree in Business in New York
0.0%
100.0%
Cities with the Highest Percentage of Population with a Degree in Business in New York
| City | % Graduates | vs State | vs National | |
| 1. | Captree | 83.1% | 17.8%(+65.3)#1 | 19.5%(+63.6)#329 |
| 2. | Constantia | 82.5% | 17.8%(+64.7)#2 | 19.5%(+63.0)#330 |
| 3. | Port Gibson | 69.9% | 17.8%(+52.2)#3 | 19.5%(+50.4)#476 |
| 4. | Phoenicia | 66.7% | 17.8%(+48.9)#4 | 19.5%(+47.2)#522 |
| 5. | Downsville | 60.0% | 17.8%(+42.2)#5 | 19.5%(+40.5)#677 |
| 6. | Coopers Plains | 58.9% | 17.8%(+41.1)#6 | 19.5%(+39.4)#710 |
| 7. | Kennedy | 55.6% | 17.8%(+37.8)#7 | 19.5%(+36.1)#814 |
| 8. | Fishers Landing | 55.6% | 17.8%(+37.8)#8 | 19.5%(+36.1)#824 |
| 9. | West Hampton Dunes | 53.7% | 17.8%(+35.9)#9 | 19.5%(+34.2)#877 |
| 10. | Upper Red Hook | 53.6% | 17.8%(+35.8)#10 | 19.5%(+34.1)#883 |
| 11. | Westmoreland | 52.6% | 17.8%(+34.9)#11 | 19.5%(+33.1)#924 |
| 12. | Altona | 50.0% | 17.8%(+32.2)#12 | 19.5%(+30.5)#1,011 |
| 13. | Lyon Mountain | 50.0% | 17.8%(+32.2)#13 | 19.5%(+30.5)#1,045 |
| 14. | Marcy | 49.6% | 17.8%(+31.8)#14 | 19.5%(+30.1)#1,162 |
| 15. | Lakeville | 48.4% | 17.8%(+30.6)#15 | 19.5%(+28.9)#1,204 |
| 16. | Cherry Creek | 48.0% | 17.8%(+30.2)#16 | 19.5%(+28.5)#1,220 |
| 17. | Aquebogue | 43.6% | 17.8%(+25.9)#17 | 19.5%(+24.1)#1,486 |
| 18. | Jamesport | 42.9% | 17.8%(+25.1)#18 | 19.5%(+23.4)#1,524 |
| 19. | South Fallsburg | 41.4% | 17.8%(+23.6)#19 | 19.5%(+21.9)#1,675 |
| 20. | Amenia | 40.5% | 17.8%(+22.7)#20 | 19.5%(+21.0)#1,751 |
| 21. | Arcade | 40.2% | 17.8%(+22.4)#21 | 19.5%(+20.7)#1,780 |
| 22. | West Haverstraw | 39.9% | 17.8%(+22.1)#22 | 19.5%(+20.4)#1,888 |
| 23. | Chateaugay | 39.7% | 17.8%(+21.9)#23 | 19.5%(+20.2)#1,907 |
| 24. | Greigsville | 39.5% | 17.8%(+21.8)#24 | 19.5%(+20.0)#1,923 |
| 25. | Buchanan | 39.3% | 17.8%(+21.6)#25 | 19.5%(+19.8)#1,942 |
| 26. | Westford | 38.9% | 17.8%(+21.1)#26 | 19.5%(+19.4)#1,999 |
| 27. | Springfield Center | 38.5% | 17.8%(+20.7)#27 | 19.5%(+19.0)#2,049 |
| 28. | Pine Valley | 38.1% | 17.8%(+20.3)#28 | 19.5%(+18.6)#2,098 |
| 29. | Limestone | 37.7% | 17.8%(+20.0)#29 | 19.5%(+18.2)#2,129 |
| 30. | Mahopac | 37.6% | 17.8%(+19.8)#30 | 19.5%(+18.1)#2,149 |
| 31. | Hopewell Junction | 37.5% | 17.8%(+19.7)#31 | 19.5%(+18.0)#2,155 |
| 32. | Schenevus | 37.5% | 17.8%(+19.7)#32 | 19.5%(+18.0)#2,164 |
| 33. | Wingdale | 36.8% | 17.8%(+19.1)#33 | 19.5%(+17.3)#2,258 |
| 34. | Water Mill | 36.4% | 17.8%(+18.6)#34 | 19.5%(+16.9)#2,316 |
| 35. | Windham | 35.9% | 17.8%(+18.1)#35 | 19.5%(+16.4)#2,411 |
| 36. | Washington Heights | 35.8% | 17.8%(+18.0)#36 | 19.5%(+16.3)#2,426 |
| 37. | Plandome Heights | 35.4% | 17.8%(+17.6)#37 | 19.5%(+15.9)#2,499 |
| 38. | Clintondale | 35.3% | 17.8%(+17.6)#38 | 19.5%(+15.8)#2,509 |
| 39. | Clarence Center | 35.3% | 17.8%(+17.6)#39 | 19.5%(+15.8)#2,510 |
| 40. | Nassau Lake | 35.3% | 17.8%(+17.6)#40 | 19.5%(+15.8)#2,511 |
| 41. | Avon | 35.3% | 17.8%(+17.5)#41 | 19.5%(+15.8)#2,512 |
| 42. | Stottville | 34.9% | 17.8%(+17.1)#42 | 19.5%(+15.4)#2,576 |
| 43. | Shenorock | 34.6% | 17.8%(+16.9)#43 | 19.5%(+15.1)#2,619 |
| 44. | Thornwood | 34.6% | 17.8%(+16.9)#44 | 19.5%(+15.1)#2,623 |
| 45. | Fillmore | 34.6% | 17.8%(+16.8)#45 | 19.5%(+15.1)#2,626 |
| 46. | Chazy | 34.5% | 17.8%(+16.8)#46 | 19.5%(+15.0)#2,652 |
| 47. | Gardnertown | 34.3% | 17.8%(+16.5)#47 | 19.5%(+14.8)#2,703 |
| 48. | Carle Place | 34.1% | 17.8%(+16.4)#48 | 19.5%(+14.6)#2,734 |
| 49. | North Creek | 34.1% | 17.8%(+16.3)#49 | 19.5%(+14.6)#2,744 |
| 50. | Flower Hill | 33.9% | 17.8%(+16.1)#50 | 19.5%(+14.4)#2,771 |
| 51. | Cuylerville | 33.7% | 17.8%(+15.9)#51 | 19.5%(+14.2)#2,798 |
| 52. | Bliss | 33.3% | 17.8%(+15.6)#52 | 19.5%(+13.8)#2,886 |
| 53. | Portlandville | 33.3% | 17.8%(+15.6)#53 | 19.5%(+13.8)#2,980 |
| 54. | Harbor Isle | 33.3% | 17.8%(+15.5)#54 | 19.5%(+13.8)#3,031 |
| 55. | North Boston | 32.9% | 17.8%(+15.2)#55 | 19.5%(+13.4)#3,078 |
| 56. | North Lindenhurst | 32.9% | 17.8%(+15.2)#56 | 19.5%(+13.4)#3,079 |
| 57. | Keuka Park | 32.9% | 17.8%(+15.1)#57 | 19.5%(+13.4)#3,092 |
| 58. | Harris Hill | 32.8% | 17.8%(+15.0)#58 | 19.5%(+13.3)#3,107 |
| 59. | Ontario | 32.8% | 17.8%(+15.0)#59 | 19.5%(+13.3)#3,111 |
| 60. | Livonia Center | 32.7% | 17.8%(+15.0)#60 | 19.5%(+13.2)#3,133 |
| 61. | Old Bethpage | 32.6% | 17.8%(+14.8)#61 | 19.5%(+13.1)#3,167 |
| 62. | Davenport Center | 32.5% | 17.8%(+14.7)#62 | 19.5%(+13.0)#3,187 |
| 63. | Andes | 32.5% | 17.8%(+14.7)#63 | 19.5%(+13.0)#3,189 |
| 64. | Fort Edward | 32.4% | 17.8%(+14.6)#64 | 19.5%(+12.9)#3,206 |
| 65. | South Hempstead | 32.4% | 17.8%(+14.6)#65 | 19.5%(+12.9)#3,215 |
| 66. | Mineville | 32.2% | 17.8%(+14.4)#66 | 19.5%(+12.7)#3,254 |
| 67. | Hewlett Neck | 32.1% | 17.8%(+14.3)#67 | 19.5%(+12.6)#3,289 |
| 68. | Remsen | 32.0% | 17.8%(+14.2)#68 | 19.5%(+12.5)#3,311 |
| 69. | North Lynbrook | 31.8% | 17.8%(+14.1)#69 | 19.5%(+12.3)#3,357 |
| 70. | Copenhagen | 31.7% | 17.8%(+14.0)#70 | 19.5%(+12.2)#3,382 |
| 71. | Port Washington North | 31.7% | 17.8%(+14.0)#71 | 19.5%(+12.2)#3,384 |
| 72. | Burlington Flats | 31.6% | 17.8%(+13.8)#72 | 19.5%(+12.1)#3,432 |
| 73. | Oak Beach | 31.5% | 17.8%(+13.8)#73 | 19.5%(+12.0)#3,443 |
| 74. | Locust Valley | 31.4% | 17.8%(+13.6)#74 | 19.5%(+11.9)#3,472 |
| 75. | Glen Head | 31.2% | 17.8%(+13.4)#75 | 19.5%(+11.7)#3,537 |
| 76. | Candor | 31.2% | 17.8%(+13.4)#76 | 19.5%(+11.7)#3,540 |
| 77. | Greenville Cdp Greene County | 31.1% | 17.8%(+13.3)#77 | 19.5%(+11.6)#3,560 |
| 78. | Bellerose Terrace | 31.1% | 17.8%(+13.3)#78 | 19.5%(+11.6)#3,568 |
| 79. | Bohemia | 31.0% | 17.8%(+13.3)#79 | 19.5%(+11.5)#3,576 |
| 80. | Islandia | 30.8% | 17.8%(+13.0)#80 | 19.5%(+11.3)#3,649 |
| 81. | Hannibal | 30.8% | 17.8%(+13.0)#81 | 19.5%(+11.3)#3,659 |
| 82. | Old Brookville | 30.6% | 17.8%(+12.9)#82 | 19.5%(+11.1)#3,707 |
| 83. | Garden City | 30.6% | 17.8%(+12.9)#83 | 19.5%(+11.1)#3,712 |
| 84. | Plandome | 30.6% | 17.8%(+12.8)#84 | 19.5%(+11.1)#3,732 |
| 85. | New Berlin | 30.4% | 17.8%(+12.7)#85 | 19.5%(+10.9)#3,765 |
| 86. | Clarence | 30.2% | 17.8%(+12.4)#86 | 19.5%(+10.7)#3,826 |
| 87. | Rensselaer Falls | 30.1% | 17.8%(+12.4)#87 | 19.5%(+10.6)#3,864 |
| 88. | Deruyter | 30.1% | 17.8%(+12.4)#88 | 19.5%(+10.6)#3,865 |
| 89. | Ghent | 30.1% | 17.8%(+12.3)#89 | 19.5%(+10.6)#3,878 |
| 90. | Dekalb Junction | 30.0% | 17.8%(+12.2)#90 | 19.5%(+10.5)#3,889 |
| 91. | Chappaqua | 29.8% | 17.8%(+12.1)#91 | 19.5%(+10.3)#3,960 |
| 92. | Cedarhurst | 29.7% | 17.8%(+11.9)#92 | 19.5%(+10.2)#4,001 |
| 93. | South Farmingdale | 29.7% | 17.8%(+11.9)#93 | 19.5%(+10.2)#4,009 |
| 94. | Cleveland | 29.5% | 17.8%(+11.8)#94 | 19.5%(+10.0)#4,059 |
| 95. | Sparkill | 29.4% | 17.8%(+11.7)#95 | 19.5%(+9.93)#4,090 |
| 96. | Walton Park | 29.4% | 17.8%(+11.6)#96 | 19.5%(+9.88)#4,117 |
| 97. | North Massapequa | 29.4% | 17.8%(+11.6)#97 | 19.5%(+9.86)#4,121 |
| 98. | Manhasset | 29.3% | 17.8%(+11.6)#98 | 19.5%(+9.84)#4,132 |
| 99. | Perrysburg | 29.2% | 17.8%(+11.5)#99 | 19.5%(+9.73)#4,166 |
| 100. | Wainscott | 29.0% | 17.8%(+11.3)#100 | 19.5%(+9.52)#4,233 |
Common Questions
What are the Top 10 Cities with the Highest Percentage of Population with a Degree in Business in New York?
Top 10 Cities with the Highest Percentage of Population with a Degree in Business in New York are:
#1
82.5%
#2
69.9%
#3
66.7%
#4
60.0%
#5
58.9%
#6
55.6%
#7
55.6%
#8
53.7%
#9
52.6%
#10
50.0%
What city has the Highest Percentage of Population with a Degree in Business in New York?
Constantia has the Highest Percentage of Population with a Degree in Business in New York with 82.5%.
What is the Percentage of Population with a Degree in Business in the State of New York?
Percentage of Population with a Degree in Business in New York is 17.8%.
What is the Percentage of Population with a Degree in Business in the United States?
Percentage of Population with a Degree in Business in the United States is 19.5%.