Cities with the Highest Percentage of French Canadian Population in New York
RELATED REPORTS & OPTIONS
French Canadian
New York
Compare Cities
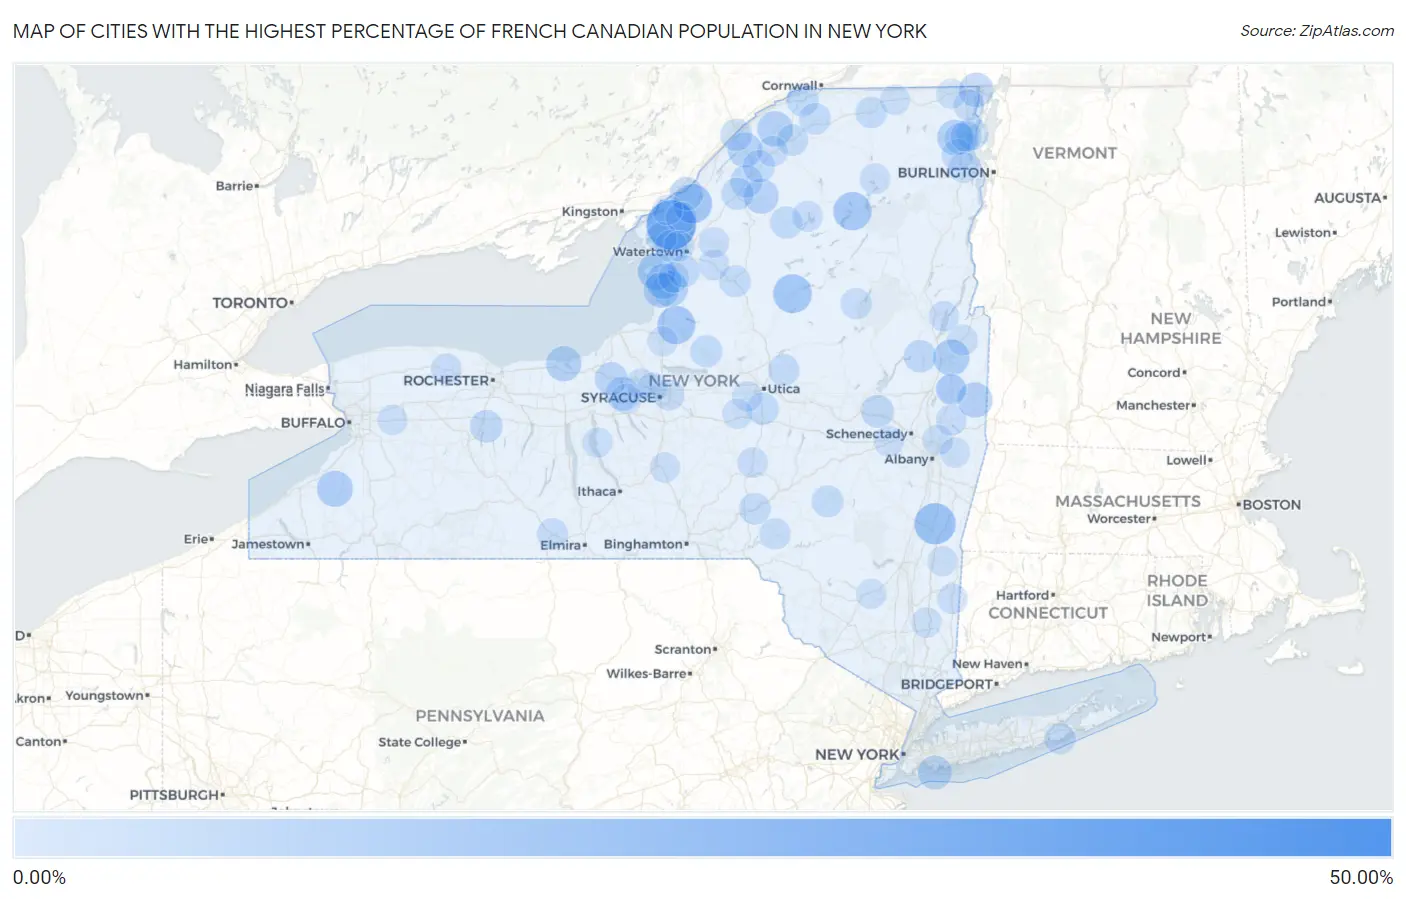
Map of Cities with the Highest Percentage of French Canadian Population in New York
0.00%
50.00%
Cities with the Highest Percentage of French Canadian Population in New York
| City | French Canadian | vs State | vs National | |
| 1. | Eagle Bay | 50.00% | 0.55%(+49.5)#1 | 0.54%(+49.5)#5 |
| 2. | Depauville | 34.02% | 0.55%(+33.5)#2 | 0.54%(+33.5)#20 |
| 3. | Claverack Red Mills | 20.83% | 0.55%(+20.3)#3 | 0.54%(+20.3)#48 |
| 4. | Plessis | 17.67% | 0.55%(+17.1)#4 | 0.54%(+17.1)#80 |
| 5. | Walworth | 16.88% | 0.55%(+16.3)#5 | 0.54%(+16.3)#93 |
| 6. | Old Forge | 16.75% | 0.55%(+16.2)#6 | 0.54%(+16.2)#94 |
| 7. | Tupper Lake | 16.33% | 0.55%(+15.8)#7 | 0.54%(+15.8)#100 |
| 8. | Altmar | 15.81% | 0.55%(+15.3)#8 | 0.54%(+15.3)#107 |
| 9. | Henderson | 14.29% | 0.55%(+13.7)#9 | 0.54%(+13.7)#125 |
| 10. | Fort Covington | 14.06% | 0.55%(+13.5)#10 | 0.54%(+13.5)#131 |
| 11. | Hudson Falls | 13.12% | 0.55%(+12.6)#11 | 0.54%(+12.6)#145 |
| 12. | Perrysburg | 12.76% | 0.55%(+12.2)#12 | 0.54%(+12.2)#150 |
| 13. | Pierrepont Manor | 12.20% | 0.55%(+11.6)#13 | 0.54%(+11.7)#164 |
| 14. | Morrisonville | 11.96% | 0.55%(+11.4)#14 | 0.54%(+11.4)#176 |
| 15. | Belleville | 11.76% | 0.55%(+11.2)#15 | 0.54%(+11.2)#184 |
| 16. | Ellisburg | 11.70% | 0.55%(+11.2)#16 | 0.54%(+11.2)#186 |
| 17. | Madrid | 11.68% | 0.55%(+11.1)#17 | 0.54%(+11.1)#188 |
| 18. | Sodus Point | 11.59% | 0.55%(+11.0)#18 | 0.54%(+11.0)#190 |
| 19. | Lake Huntington | 11.44% | 0.55%(+10.9)#19 | 0.54%(+10.9)#194 |
| 20. | Cambridge | 11.26% | 0.55%(+10.7)#20 | 0.54%(+10.7)#200 |
| 21. | Edwards | 10.93% | 0.55%(+10.4)#21 | 0.54%(+10.4)#210 |
| 22. | Heuvelton | 10.50% | 0.55%(+9.95)#22 | 0.54%(+9.96)#233 |
| 23. | Rouses Point | 10.12% | 0.55%(+9.57)#23 | 0.54%(+9.57)#253 |
| 24. | Atlantic Beach | 9.54% | 0.55%(+8.99)#24 | 0.54%(+8.99)#273 |
| 25. | Jordan | 9.46% | 0.55%(+8.91)#25 | 0.54%(+8.91)#279 |
| 26. | Willsboro Point | 9.45% | 0.55%(+8.91)#26 | 0.54%(+8.91)#280 |
| 27. | Copake | 8.94% | 0.55%(+8.39)#27 | 0.54%(+8.39)#318 |
| 28. | Alexandria Bay | 8.75% | 0.55%(+8.21)#28 | 0.54%(+8.21)#331 |
| 29. | Cato | 8.19% | 0.55%(+7.64)#29 | 0.54%(+7.64)#367 |
| 30. | Fort Johnson | 7.84% | 0.55%(+7.30)#30 | 0.54%(+7.30)#389 |
| 31. | Cadyville | 7.65% | 0.55%(+7.10)#31 | 0.54%(+7.11)#401 |
| 32. | South Lima | 7.56% | 0.55%(+7.01)#32 | 0.54%(+7.02)#408 |
| 33. | Richville | 7.35% | 0.55%(+6.81)#33 | 0.54%(+6.81)#437 |
| 34. | Hadley | 7.28% | 0.55%(+6.73)#34 | 0.54%(+6.73)#447 |
| 35. | Star Lake | 7.09% | 0.55%(+6.54)#35 | 0.54%(+6.54)#461 |
| 36. | Cumberland Head | 7.00% | 0.55%(+6.45)#36 | 0.54%(+6.46)#469 |
| 37. | Dekalb Junction | 6.98% | 0.55%(+6.43)#37 | 0.54%(+6.43)#471 |
| 38. | Gouverneur | 6.97% | 0.55%(+6.42)#38 | 0.54%(+6.42)#474 |
| 39. | Clayville | 6.88% | 0.55%(+6.34)#39 | 0.54%(+6.34)#482 |
| 40. | Dexter | 6.82% | 0.55%(+6.27)#40 | 0.54%(+6.27)#487 |
| 41. | Ogdensburg | 6.81% | 0.55%(+6.26)#41 | 0.54%(+6.26)#489 |
| 42. | Massena | 6.80% | 0.55%(+6.26)#42 | 0.54%(+6.26)#490 |
| 43. | Rodman | 6.74% | 0.55%(+6.19)#43 | 0.54%(+6.19)#496 |
| 44. | Camden | 6.56% | 0.55%(+6.01)#44 | 0.54%(+6.01)#515 |
| 45. | Varna | 6.44% | 0.55%(+5.89)#45 | 0.54%(+5.89)#528 |
| 46. | East Frankfort | 6.41% | 0.55%(+5.87)#46 | 0.54%(+5.87)#530 |
| 47. | Brasher Falls | 6.27% | 0.55%(+5.73)#47 | 0.54%(+5.73)#558 |
| 48. | Hobart | 6.25% | 0.55%(+5.70)#48 | 0.54%(+5.71)#564 |
| 49. | Lowville | 6.08% | 0.55%(+5.54)#49 | 0.54%(+5.54)#583 |
| 50. | Unadilla | 5.93% | 0.55%(+5.38)#50 | 0.54%(+5.38)#595 |
| 51. | Peru | 5.92% | 0.55%(+5.37)#51 | 0.54%(+5.38)#596 |
| 52. | Plattsburgh West | 5.81% | 0.55%(+5.27)#52 | 0.54%(+5.27)#606 |
| 53. | Poland | 5.81% | 0.55%(+5.27)#53 | 0.54%(+5.27)#607 |
| 54. | Malone | 5.77% | 0.55%(+5.23)#54 | 0.54%(+5.23)#615 |
| 55. | Potsdam | 5.73% | 0.55%(+5.18)#55 | 0.54%(+5.18)#622 |
| 56. | Plattsburgh | 5.70% | 0.55%(+5.15)#56 | 0.54%(+5.16)#628 |
| 57. | Quiogue | 5.59% | 0.55%(+5.04)#57 | 0.54%(+5.05)#645 |
| 58. | Walton | 5.51% | 0.55%(+4.97)#58 | 0.54%(+4.97)#653 |
| 59. | East Syracuse | 5.42% | 0.55%(+4.87)#59 | 0.54%(+4.87)#674 |
| 60. | Chazy | 5.25% | 0.55%(+4.71)#60 | 0.54%(+4.71)#698 |
| 61. | Speculator | 5.15% | 0.55%(+4.61)#61 | 0.54%(+4.61)#718 |
| 62. | Painted Post | 5.13% | 0.55%(+4.58)#62 | 0.54%(+4.59)#725 |
| 63. | Chaumont | 5.10% | 0.55%(+4.56)#63 | 0.54%(+4.56)#731 |
| 64. | Cranberry Lake | 4.84% | 0.55%(+4.29)#64 | 0.54%(+4.29)#773 |
| 65. | Keeseville | 4.83% | 0.55%(+4.29)#65 | 0.54%(+4.29)#776 |
| 66. | Lake Delta | 4.78% | 0.55%(+4.23)#66 | 0.54%(+4.24)#785 |
| 67. | La Fargeville | 4.72% | 0.55%(+4.17)#67 | 0.54%(+4.17)#798 |
| 68. | Fort Ann | 4.70% | 0.55%(+4.15)#68 | 0.54%(+4.15)#803 |
| 69. | Brownville | 4.61% | 0.55%(+4.06)#69 | 0.54%(+4.06)#819 |
| 70. | Holley | 4.59% | 0.55%(+4.05)#70 | 0.54%(+4.05)#821 |
| 71. | Canton | 4.57% | 0.55%(+4.02)#71 | 0.54%(+4.02)#827 |
| 72. | Copenhagen | 4.56% | 0.55%(+4.02)#72 | 0.54%(+4.02)#829 |
| 73. | Paul Smiths | 4.55% | 0.55%(+4.00)#73 | 0.54%(+4.00)#835 |
| 74. | Deferiet | 4.53% | 0.55%(+3.99)#74 | 0.54%(+3.99)#841 |
| 75. | Adams | 4.47% | 0.55%(+3.93)#75 | 0.54%(+3.93)#850 |
| 76. | Schaghticoke | 4.44% | 0.55%(+3.89)#76 | 0.54%(+3.89)#859 |
| 77. | Village Green | 4.43% | 0.55%(+3.88)#77 | 0.54%(+3.89)#860 |
| 78. | Cohoes | 4.40% | 0.55%(+3.85)#78 | 0.54%(+3.85)#867 |
| 79. | Dover Plains | 4.33% | 0.55%(+3.79)#79 | 0.54%(+3.79)#882 |
| 80. | Victory | 4.32% | 0.55%(+3.78)#80 | 0.54%(+3.78)#885 |
| 81. | Bolton Landing | 4.31% | 0.55%(+3.76)#81 | 0.54%(+3.76)#888 |
| 82. | Duanesburg | 4.29% | 0.55%(+3.75)#82 | 0.54%(+3.75)#890 |
| 83. | New Berlin | 4.22% | 0.55%(+3.68)#83 | 0.54%(+3.68)#914 |
| 84. | Clinton | 4.15% | 0.55%(+3.60)#84 | 0.54%(+3.60)#940 |
| 85. | Brooktondale | 4.07% | 0.55%(+3.52)#85 | 0.54%(+3.52)#955 |
| 86. | Alden | 4.07% | 0.55%(+3.52)#86 | 0.54%(+3.52)#956 |
| 87. | Elbridge | 4.05% | 0.55%(+3.50)#87 | 0.54%(+3.50)#963 |
| 88. | Mcgraw | 4.04% | 0.55%(+3.50)#88 | 0.54%(+3.50)#964 |
| 89. | Pine Plains | 4.02% | 0.55%(+3.48)#89 | 0.54%(+3.48)#970 |
| 90. | Mooers | 4.01% | 0.55%(+3.46)#90 | 0.54%(+3.46)#977 |
| 91. | Hopewell Junction | 4.00% | 0.55%(+3.46)#91 | 0.54%(+3.46)#978 |
| 92. | Poestenkill | 3.98% | 0.55%(+3.43)#92 | 0.54%(+3.43)#987 |
| 93. | Kerhonkson | 3.97% | 0.55%(+3.43)#93 | 0.54%(+3.43)#988 |
| 94. | Oriskany Falls | 3.97% | 0.55%(+3.42)#94 | 0.54%(+3.42)#989 |
| 95. | Chateaugay | 3.97% | 0.55%(+3.42)#95 | 0.54%(+3.42)#990 |
| 96. | Aurora | 3.90% | 0.55%(+3.36)#96 | 0.54%(+3.36)#1,019 |
| 97. | Clayton | 3.80% | 0.55%(+3.25)#97 | 0.54%(+3.25)#1,037 |
| 98. | Parish | 3.78% | 0.55%(+3.24)#98 | 0.54%(+3.24)#1,041 |
| 99. | Schuylerville | 3.78% | 0.55%(+3.23)#99 | 0.54%(+3.24)#1,044 |
| 100. | Liverpool | 3.78% | 0.55%(+3.23)#100 | 0.54%(+3.23)#1,045 |
Common Questions
What are the Top 10 Cities with the Highest Percentage of French Canadian Population in New York?
Top 10 Cities with the Highest Percentage of French Canadian Population in New York are:
#1
34.02%
#2
20.83%
#3
17.67%
#4
16.75%
#5
16.33%
#6
15.81%
#7
14.29%
#8
13.12%
#9
12.76%
#10
12.20%
What city has the Highest Percentage of French Canadian Population in New York?
Depauville has the Highest Percentage of French Canadian Population in New York with 34.02%.
What is the Percentage of French Canadian Population in the State of New York?
Percentage of French Canadian Population in New York is 0.55%.
What is the Percentage of French Canadian Population in the United States?
Percentage of French Canadian Population in the United States is 0.54%.