Cities with the Largest Australian Community in New York
RELATED REPORTS & OPTIONS
Australian
New York
Compare Cities
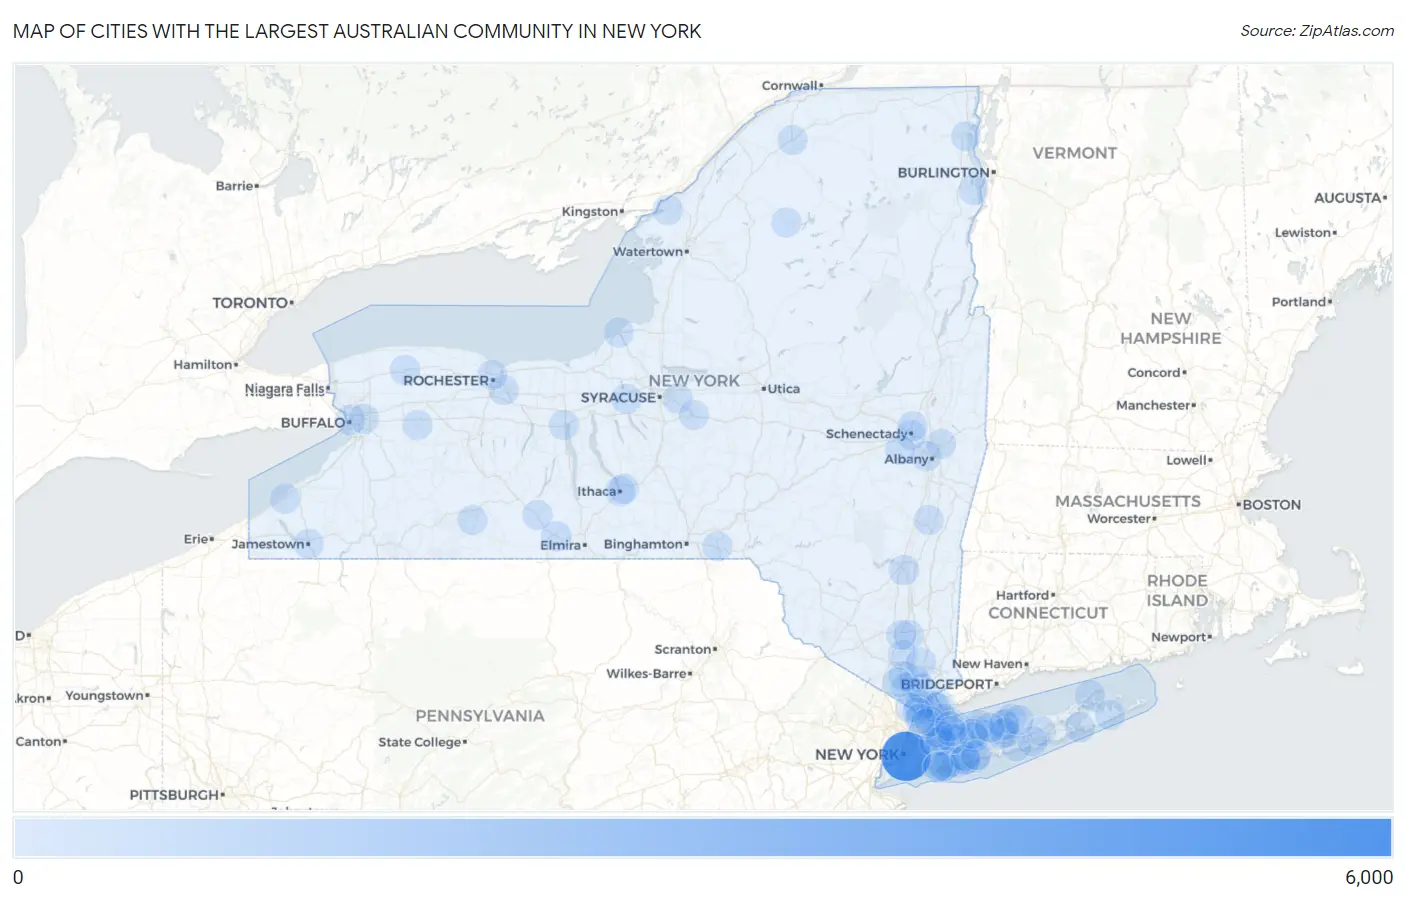
Map of Cities with the Largest Australian Community in New York
0
6,000
Cities with the Largest Australian Community in New York
| City | Australian | vs State | vs National | |
| 1. | New York | 5,682 | 8,078(70.34%)#1 | 96,505(5.89%)#1 |
| 2. | White Plains | 140 | 8,078(1.73%)#2 | 96,505(0.15%)#87 |
| 3. | Kingston | 88 | 8,078(1.09%)#3 | 96,505(0.09%)#177 |
| 4. | Corning | 78 | 8,078(0.97%)#4 | 96,505(0.08%)#202 |
| 5. | Rye | 73 | 8,078(0.90%)#5 | 96,505(0.08%)#220 |
| 6. | Croton On Hudson | 59 | 8,078(0.73%)#6 | 96,505(0.06%)#299 |
| 7. | Baldwin | 53 | 8,078(0.66%)#7 | 96,505(0.05%)#338 |
| 8. | Port Washington | 53 | 8,078(0.66%)#8 | 96,505(0.05%)#341 |
| 9. | Great Neck Plaza | 53 | 8,078(0.66%)#9 | 96,505(0.05%)#342 |
| 10. | Stony Brook University | 52 | 8,078(0.64%)#10 | 96,505(0.05%)#347 |
| 11. | Beacon | 46 | 8,078(0.57%)#11 | 96,505(0.05%)#391 |
| 12. | Stony Point | 39 | 8,078(0.48%)#12 | 96,505(0.04%)#473 |
| 13. | Buffalo | 37 | 8,078(0.46%)#13 | 96,505(0.04%)#499 |
| 14. | Hudson | 35 | 8,078(0.43%)#14 | 96,505(0.04%)#535 |
| 15. | Commack | 34 | 8,078(0.42%)#15 | 96,505(0.04%)#548 |
| 16. | Bellmore | 34 | 8,078(0.42%)#16 | 96,505(0.04%)#553 |
| 17. | Greenlawn | 33 | 8,078(0.41%)#17 | 96,505(0.03%)#563 |
| 18. | Shinnecock Hills | 31 | 8,078(0.38%)#18 | 96,505(0.03%)#595 |
| 19. | Irvington | 30 | 8,078(0.37%)#19 | 96,505(0.03%)#610 |
| 20. | Massapequa Park | 29 | 8,078(0.36%)#20 | 96,505(0.03%)#622 |
| 21. | Flower Hill | 29 | 8,078(0.36%)#21 | 96,505(0.03%)#628 |
| 22. | New City | 27 | 8,078(0.33%)#22 | 96,505(0.03%)#656 |
| 23. | Dobbs Ferry | 23 | 8,078(0.28%)#23 | 96,505(0.02%)#745 |
| 24. | Bayville | 22 | 8,078(0.27%)#24 | 96,505(0.02%)#778 |
| 25. | Nesconset | 21 | 8,078(0.26%)#25 | 96,505(0.02%)#791 |
| 26. | Briarcliff Manor | 21 | 8,078(0.26%)#26 | 96,505(0.02%)#793 |
| 27. | Greenport | 20 | 8,078(0.25%)#27 | 96,505(0.02%)#829 |
| 28. | Harrison | 19 | 8,078(0.24%)#28 | 96,505(0.02%)#844 |
| 29. | Oswego | 19 | 8,078(0.24%)#29 | 96,505(0.02%)#850 |
| 30. | Northport | 19 | 8,078(0.24%)#30 | 96,505(0.02%)#859 |
| 31. | East Hampton North | 19 | 8,078(0.24%)#31 | 96,505(0.02%)#861 |
| 32. | Albany | 18 | 8,078(0.22%)#32 | 96,505(0.02%)#873 |
| 33. | Schenectady | 18 | 8,078(0.22%)#33 | 96,505(0.02%)#877 |
| 34. | Lindenhurst | 18 | 8,078(0.22%)#34 | 96,505(0.02%)#889 |
| 35. | Plattsburgh | 18 | 8,078(0.22%)#35 | 96,505(0.02%)#894 |
| 36. | Syosset | 18 | 8,078(0.22%)#36 | 96,505(0.02%)#897 |
| 37. | Geneva | 18 | 8,078(0.22%)#37 | 96,505(0.02%)#899 |
| 38. | Stony Brook | 18 | 8,078(0.22%)#38 | 96,505(0.02%)#900 |
| 39. | Sands Point | 18 | 8,078(0.22%)#39 | 96,505(0.02%)#914 |
| 40. | Woodsburgh | 18 | 8,078(0.22%)#40 | 96,505(0.02%)#917 |
| 41. | South Huntington | 17 | 8,078(0.21%)#41 | 96,505(0.02%)#947 |
| 42. | West Point | 17 | 8,078(0.21%)#42 | 96,505(0.02%)#950 |
| 43. | Manorville | 16 | 8,078(0.20%)#43 | 96,505(0.02%)#1,002 |
| 44. | Fayetteville | 16 | 8,078(0.20%)#44 | 96,505(0.02%)#1,012 |
| 45. | Newburgh | 15 | 8,078(0.19%)#45 | 96,505(0.02%)#1,044 |
| 46. | Munsey Park | 15 | 8,078(0.19%)#46 | 96,505(0.02%)#1,064 |
| 47. | Pittsford | 15 | 8,078(0.19%)#47 | 96,505(0.02%)#1,067 |
| 48. | Troy | 14 | 8,078(0.17%)#48 | 96,505(0.01%)#1,081 |
| 49. | Bay Park | 14 | 8,078(0.17%)#49 | 96,505(0.01%)#1,121 |
| 50. | Rye Brook | 13 | 8,078(0.16%)#50 | 96,505(0.01%)#1,152 |
| 51. | Hastings On Hudson | 13 | 8,078(0.16%)#51 | 96,505(0.01%)#1,156 |
| 52. | Patchogue | 12 | 8,078(0.15%)#52 | 96,505(0.01%)#1,200 |
| 53. | Pelham | 12 | 8,078(0.15%)#53 | 96,505(0.01%)#1,209 |
| 54. | Tappan | 11 | 8,078(0.14%)#54 | 96,505(0.01%)#1,282 |
| 55. | Lake Mohegan | 11 | 8,078(0.14%)#55 | 96,505(0.01%)#1,284 |
| 56. | Alfred | 11 | 8,078(0.14%)#56 | 96,505(0.01%)#1,288 |
| 57. | New Rochelle | 10 | 8,078(0.12%)#57 | 96,505(0.01%)#1,310 |
| 58. | Oceanside | 10 | 8,078(0.12%)#58 | 96,505(0.01%)#1,325 |
| 59. | North Massapequa | 9 | 8,078(0.11%)#59 | 96,505(0.01%)#1,391 |
| 60. | Port Jefferson | 9 | 8,078(0.11%)#60 | 96,505(0.01%)#1,412 |
| 61. | Medina | 9 | 8,078(0.11%)#61 | 96,505(0.01%)#1,416 |
| 62. | Attica | 9 | 8,078(0.11%)#62 | 96,505(0.01%)#1,429 |
| 63. | Yonkers | 8 | 8,078(0.10%)#63 | 96,505(0.01%)#1,441 |
| 64. | Ithaca | 8 | 8,078(0.10%)#64 | 96,505(0.01%)#1,457 |
| 65. | Massapequa | 8 | 8,078(0.10%)#65 | 96,505(0.01%)#1,465 |
| 66. | Potsdam | 8 | 8,078(0.10%)#66 | 96,505(0.01%)#1,479 |
| 67. | Willsboro | 8 | 8,078(0.10%)#67 | 96,505(0.01%)#1,504 |
| 68. | Cheektowaga | 7 | 8,078(0.09%)#68 | 96,505(0.01%)#1,514 |
| 69. | Huntington Station | 7 | 8,078(0.09%)#69 | 96,505(0.01%)#1,525 |
| 70. | Lake Grove | 7 | 8,078(0.09%)#70 | 96,505(0.01%)#1,540 |
| 71. | Rochester Institute Of Technology | 7 | 8,078(0.09%)#71 | 96,505(0.01%)#1,551 |
| 72. | Pomona | 7 | 8,078(0.09%)#72 | 96,505(0.01%)#1,556 |
| 73. | Cazenovia | 7 | 8,078(0.09%)#73 | 96,505(0.01%)#1,562 |
| 74. | Hewlett Bay Park | 7 | 8,078(0.09%)#74 | 96,505(0.01%)#1,571 |
| 75. | Jamestown | 6 | 8,078(0.07%)#75 | 96,505(0.01%)#1,594 |
| 76. | West Babylon | 5 | 8,078(0.06%)#76 | 96,505(0.01%)#1,658 |
| 77. | Shirley | 5 | 8,078(0.06%)#77 | 96,505(0.01%)#1,667 |
| 78. | Miller Place | 5 | 8,078(0.06%)#78 | 96,505(0.01%)#1,683 |
| 79. | East Glenville | 5 | 8,078(0.06%)#79 | 96,505(0.01%)#1,685 |
| 80. | Brookville | 5 | 8,078(0.06%)#80 | 96,505(0.01%)#1,702 |
| 81. | Altamont | 5 | 8,078(0.06%)#81 | 96,505(0.01%)#1,715 |
| 82. | Clayton | 5 | 8,078(0.06%)#82 | 96,505(0.01%)#1,716 |
| 83. | Lattingtown | 4 | 8,078(0.05%)#83 | 96,505(0.00%)#1,769 |
| 84. | Forest Home | 4 | 8,078(0.05%)#84 | 96,505(0.00%)#1,777 |
| 85. | Rochester | 3 | 8,078(0.04%)#85 | 96,505(0.00%)#1,787 |
| 86. | Brocton | 3 | 8,078(0.04%)#86 | 96,505(0.00%)#1,824 |
| 87. | Elbridge | 3 | 8,078(0.04%)#87 | 96,505(0.00%)#1,828 |
| 88. | Savona | 3 | 8,078(0.04%)#88 | 96,505(0.00%)#1,845 |
| 89. | Star Lake | 3 | 8,078(0.04%)#89 | 96,505(0.00%)#1,847 |
| 90. | Kings Park | 2 | 8,078(0.02%)#90 | 96,505(0.00%)#1,865 |
| 91. | Matinecock | 2 | 8,078(0.02%)#91 | 96,505(0.00%)#1,894 |
| 92. | Windsor | 1 | 8,078(0.01%)#92 | 96,505(0.00%)#1,954 |
Common Questions
What are the Top 10 Cities with the Largest Australian Community in New York?
Top 10 Cities with the Largest Australian Community in New York are:
#1
5,682
#2
140
#3
88
#4
78
#5
73
#6
59
#7
53
#8
53
#9
53
#10
52
What city has the Largest Australian Community in New York?
New York has the Largest Australian Community in New York with 5,682.
What is the Total Australian Population in the State of New York?
Total Australian Population in New York is 8,078.
What is the Total Australian Population in the United States?
Total Australian Population in the United States is 96,505.