Cities with the Highest Percentage of Ecuadorian Population in New York
RELATED REPORTS & OPTIONS
Ecuadorian
New York
Compare Cities
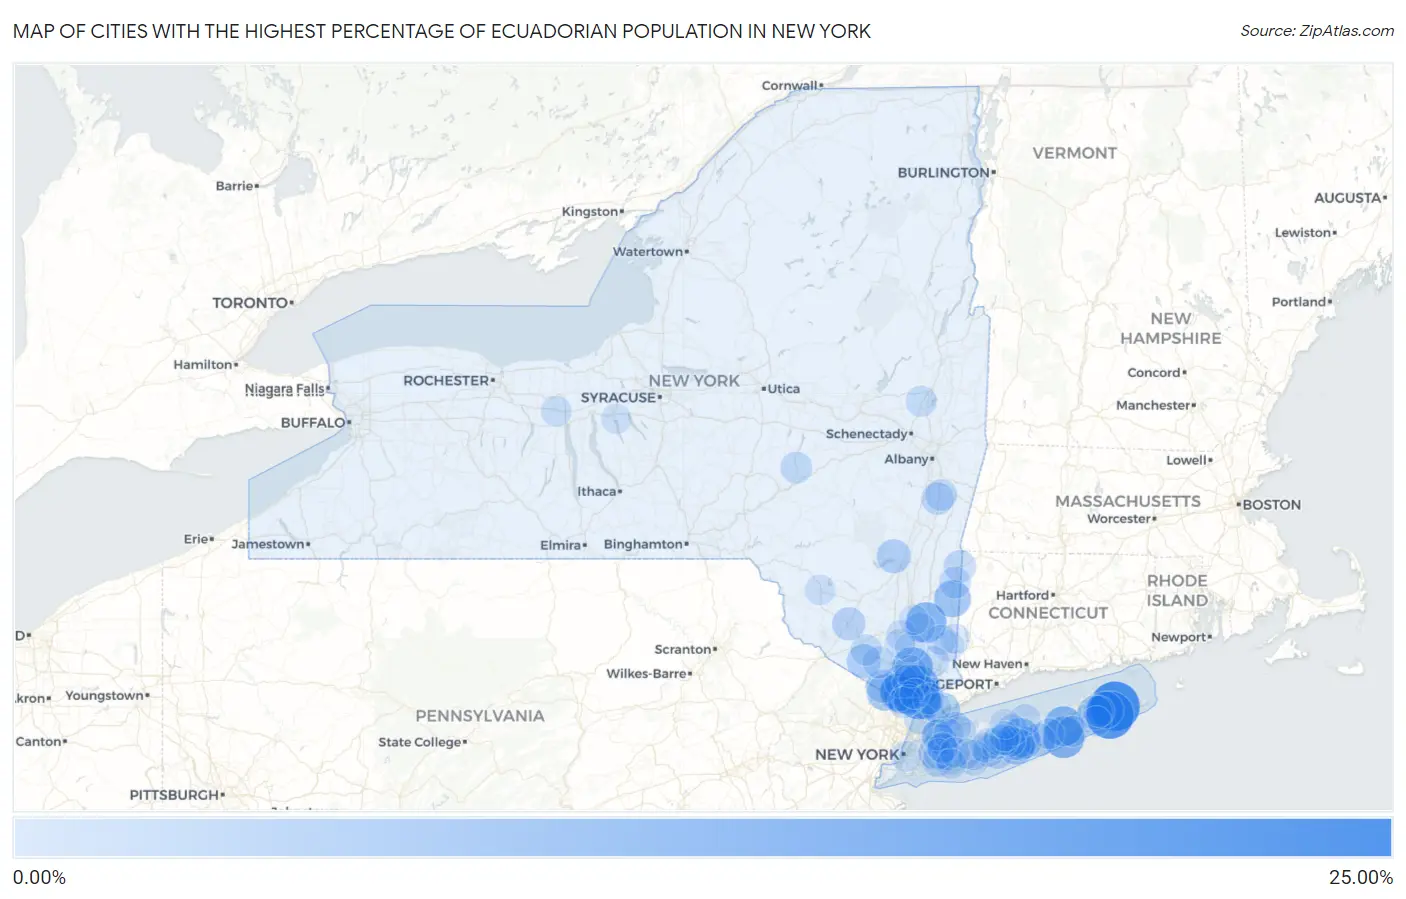
Map of Cities with the Highest Percentage of Ecuadorian Population in New York
0.00%
25.00%
Cities with the Highest Percentage of Ecuadorian Population in New York
| City | Ecuadorian | vs State | vs National | |
| 1. | Springs | 24.90% | 1.43%(+23.5)#1 | 0.24%(+24.7)#4 |
| 2. | East Hampton North | 22.68% | 1.43%(+21.3)#2 | 0.24%(+22.4)#6 |
| 3. | Sleepy Hollow | 17.45% | 1.43%(+16.0)#3 | 0.24%(+17.2)#11 |
| 4. | Ossining | 14.88% | 1.43%(+13.5)#4 | 0.24%(+14.6)#14 |
| 5. | Quogue | 14.84% | 1.43%(+13.4)#5 | 0.24%(+14.6)#15 |
| 6. | Peekskill | 13.89% | 1.43%(+12.5)#6 | 0.24%(+13.6)#17 |
| 7. | Hopewell Junction | 13.71% | 1.43%(+12.3)#7 | 0.24%(+13.5)#19 |
| 8. | Flanders | 13.12% | 1.43%(+11.7)#8 | 0.24%(+12.9)#20 |
| 9. | Medford | 11.80% | 1.43%(+10.4)#9 | 0.24%(+11.6)#24 |
| 10. | Hillcrest | 11.36% | 1.43%(+9.93)#10 | 0.24%(+11.1)#25 |
| 11. | Spring Valley | 10.20% | 1.43%(+8.77)#11 | 0.24%(+9.95)#29 |
| 12. | Northwest Harbor | 9.91% | 1.43%(+8.49)#12 | 0.24%(+9.67)#32 |
| 13. | Nanuet | 9.73% | 1.43%(+8.30)#13 | 0.24%(+9.48)#33 |
| 14. | Dover Plains | 9.62% | 1.43%(+8.19)#14 | 0.24%(+9.38)#34 |
| 15. | Patchogue | 9.34% | 1.43%(+7.91)#15 | 0.24%(+9.10)#35 |
| 16. | Fairview Cdp Westchester County | 8.86% | 1.43%(+7.43)#16 | 0.24%(+8.61)#36 |
| 17. | Hillburn | 8.84% | 1.43%(+7.41)#17 | 0.24%(+8.60)#37 |
| 18. | Port Chester | 7.44% | 1.43%(+6.01)#18 | 0.24%(+7.20)#50 |
| 19. | Bellerose | 7.41% | 1.43%(+5.98)#19 | 0.24%(+7.16)#51 |
| 20. | Baxter Estates | 6.79% | 1.43%(+5.37)#20 | 0.24%(+6.55)#59 |
| 21. | Brewster Heights | 6.42% | 1.43%(+4.99)#21 | 0.24%(+6.18)#62 |
| 22. | Noyack | 6.38% | 1.43%(+4.95)#22 | 0.24%(+6.14)#63 |
| 23. | Florida | 6.33% | 1.43%(+4.91)#23 | 0.24%(+6.09)#64 |
| 24. | Zena | 6.20% | 1.43%(+4.77)#24 | 0.24%(+5.96)#67 |
| 25. | Elmsford | 5.80% | 1.43%(+4.37)#25 | 0.24%(+5.55)#72 |
| 26. | Mount Ivy | 5.61% | 1.43%(+4.19)#26 | 0.24%(+5.37)#74 |
| 27. | Wurtsboro | 5.25% | 1.43%(+3.83)#27 | 0.24%(+5.01)#78 |
| 28. | Sloatsburg | 5.07% | 1.43%(+3.64)#28 | 0.24%(+4.82)#82 |
| 29. | Moriches | 4.99% | 1.43%(+3.56)#29 | 0.24%(+4.75)#85 |
| 30. | Haverstraw | 4.64% | 1.43%(+3.21)#30 | 0.24%(+4.40)#92 |
| 31. | North Bellport | 4.54% | 1.43%(+3.11)#31 | 0.24%(+4.30)#93 |
| 32. | Croton On Hudson | 4.53% | 1.43%(+3.10)#32 | 0.24%(+4.29)#94 |
| 33. | East Islip | 4.50% | 1.43%(+3.07)#33 | 0.24%(+4.26)#96 |
| 34. | West Nyack | 4.49% | 1.43%(+3.06)#34 | 0.24%(+4.24)#97 |
| 35. | Buchanan | 4.36% | 1.43%(+2.93)#35 | 0.24%(+4.11)#99 |
| 36. | North Patchogue | 4.19% | 1.43%(+2.77)#36 | 0.24%(+3.95)#103 |
| 37. | Kinderhook | 4.07% | 1.43%(+2.64)#37 | 0.24%(+3.83)#106 |
| 38. | Millerton | 4.06% | 1.43%(+2.63)#38 | 0.24%(+3.82)#107 |
| 39. | Oyster Bay Cove | 3.91% | 1.43%(+2.49)#39 | 0.24%(+3.67)#109 |
| 40. | Amenia | 3.73% | 1.43%(+2.30)#40 | 0.24%(+3.49)#111 |
| 41. | Walton Park | 3.70% | 1.43%(+2.27)#41 | 0.24%(+3.45)#112 |
| 42. | Milford | 3.46% | 1.43%(+2.04)#42 | 0.24%(+3.22)#126 |
| 43. | Mill Neck | 3.43% | 1.43%(+2.00)#43 | 0.24%(+3.19)#127 |
| 44. | Valatie | 3.42% | 1.43%(+1.99)#44 | 0.24%(+3.17)#128 |
| 45. | Rocky Point | 3.38% | 1.43%(+1.96)#45 | 0.24%(+3.14)#132 |
| 46. | Bay Shore | 3.37% | 1.43%(+1.94)#46 | 0.24%(+3.13)#134 |
| 47. | Valley Stream | 3.30% | 1.43%(+1.87)#47 | 0.24%(+3.05)#137 |
| 48. | Yonkers | 3.26% | 1.43%(+1.83)#48 | 0.24%(+3.02)#139 |
| 49. | East Patchogue | 3.26% | 1.43%(+1.83)#49 | 0.24%(+3.02)#141 |
| 50. | Brentwood | 3.14% | 1.43%(+1.71)#50 | 0.24%(+2.90)#146 |
| 51. | Selden | 3.12% | 1.43%(+1.69)#51 | 0.24%(+2.87)#148 |
| 52. | Goshen | 3.03% | 1.43%(+1.61)#52 | 0.24%(+2.79)#153 |
| 53. | Pearl River | 3.03% | 1.43%(+1.60)#53 | 0.24%(+2.78)#154 |
| 54. | Central Islip | 2.90% | 1.43%(+1.48)#54 | 0.24%(+2.66)#157 |
| 55. | Valhalla | 2.88% | 1.43%(+1.46)#55 | 0.24%(+2.64)#158 |
| 56. | Sag Harbor | 2.82% | 1.43%(+1.39)#56 | 0.24%(+2.58)#162 |
| 57. | Roosevelt | 2.81% | 1.43%(+1.38)#57 | 0.24%(+2.56)#164 |
| 58. | North Ballston Spa | 2.81% | 1.43%(+1.38)#58 | 0.24%(+2.56)#165 |
| 59. | Islandia | 2.80% | 1.43%(+1.38)#59 | 0.24%(+2.56)#166 |
| 60. | Flower Hill | 2.72% | 1.43%(+1.29)#60 | 0.24%(+2.47)#175 |
| 61. | Brewster Hill | 2.57% | 1.43%(+1.14)#61 | 0.24%(+2.33)#189 |
| 62. | Eastport | 2.53% | 1.43%(+1.10)#62 | 0.24%(+2.29)#191 |
| 63. | Shenorock | 2.50% | 1.43%(+1.07)#63 | 0.24%(+2.25)#193 |
| 64. | Copiague | 2.50% | 1.43%(+1.07)#64 | 0.24%(+2.25)#194 |
| 65. | Hampton Bays | 2.44% | 1.43%(+1.02)#65 | 0.24%(+2.20)#202 |
| 66. | Holbrook | 2.44% | 1.43%(+1.01)#66 | 0.24%(+2.20)#204 |
| 67. | Tuxedo | 2.41% | 1.43%(+0.982)#67 | 0.24%(+2.17)#211 |
| 68. | Ronkonkoma | 2.38% | 1.43%(+0.951)#68 | 0.24%(+2.14)#215 |
| 69. | Greenville Cdp Westchester County | 2.35% | 1.43%(+0.920)#69 | 0.24%(+2.10)#219 |
| 70. | New York | 2.30% | 1.43%(+0.875)#70 | 0.24%(+2.06)#223 |
| 71. | Phelps | 2.26% | 1.43%(+0.833)#71 | 0.24%(+2.02)#226 |
| 72. | North Lindenhurst | 2.20% | 1.43%(+0.769)#72 | 0.24%(+1.95)#229 |
| 73. | Garden City Park | 2.15% | 1.43%(+0.721)#73 | 0.24%(+1.91)#233 |
| 74. | South Farmingdale | 2.14% | 1.43%(+0.716)#74 | 0.24%(+1.90)#235 |
| 75. | Hempstead | 2.14% | 1.43%(+0.714)#75 | 0.24%(+1.90)#236 |
| 76. | Manorhaven | 2.14% | 1.43%(+0.709)#76 | 0.24%(+1.89)#238 |
| 77. | Blauvelt | 2.08% | 1.43%(+0.649)#77 | 0.24%(+1.83)#247 |
| 78. | Lake Carmel | 2.06% | 1.43%(+0.637)#78 | 0.24%(+1.82)#249 |
| 79. | Newburgh | 2.06% | 1.43%(+0.632)#79 | 0.24%(+1.82)#251 |
| 80. | Glen Head | 2.04% | 1.43%(+0.614)#80 | 0.24%(+1.80)#253 |
| 81. | Varna | 2.00% | 1.43%(+0.576)#81 | 0.24%(+1.76)#260 |
| 82. | Liberty | 1.97% | 1.43%(+0.541)#82 | 0.24%(+1.73)#269 |
| 83. | New Hamburg | 1.95% | 1.43%(+0.527)#83 | 0.24%(+1.71)#272 |
| 84. | South Floral Park | 1.92% | 1.43%(+0.492)#84 | 0.24%(+1.68)#280 |
| 85. | Upper Nyack | 1.91% | 1.43%(+0.487)#85 | 0.24%(+1.67)#283 |
| 86. | Bridgehampton | 1.90% | 1.43%(+0.477)#86 | 0.24%(+1.66)#285 |
| 87. | Herricks | 1.85% | 1.43%(+0.419)#87 | 0.24%(+1.60)#293 |
| 88. | Cold Spring | 1.84% | 1.43%(+0.417)#88 | 0.24%(+1.60)#295 |
| 89. | Brinckerhoff | 1.83% | 1.43%(+0.399)#89 | 0.24%(+1.58)#298 |
| 90. | Firthcliffe | 1.77% | 1.43%(+0.340)#90 | 0.24%(+1.52)#307 |
| 91. | East Meadow | 1.76% | 1.43%(+0.328)#91 | 0.24%(+1.51)#308 |
| 92. | Melrose Park | 1.75% | 1.43%(+0.326)#92 | 0.24%(+1.51)#309 |
| 93. | Niagara University | 1.72% | 1.43%(+0.297)#93 | 0.24%(+1.48)#315 |
| 94. | Wappingers Falls | 1.70% | 1.43%(+0.270)#94 | 0.24%(+1.45)#318 |
| 95. | Harrison | 1.68% | 1.43%(+0.255)#95 | 0.24%(+1.44)#325 |
| 96. | Stony Brook University | 1.67% | 1.43%(+0.241)#96 | 0.24%(+1.42)#329 |
| 97. | Lake Ronkonkoma | 1.66% | 1.43%(+0.236)#97 | 0.24%(+1.42)#330 |
| 98. | Freeport | 1.65% | 1.43%(+0.226)#98 | 0.24%(+1.41)#332 |
| 99. | Putnam Lake | 1.62% | 1.43%(+0.193)#99 | 0.24%(+1.38)#337 |
| 100. | Baywood | 1.61% | 1.43%(+0.187)#100 | 0.24%(+1.37)#339 |
Common Questions
What are the Top 10 Cities with the Highest Percentage of Ecuadorian Population in New York?
Top 10 Cities with the Highest Percentage of Ecuadorian Population in New York are:
#1
24.90%
#2
22.68%
#3
17.45%
#4
14.88%
#5
14.84%
#6
13.89%
#7
13.71%
#8
13.12%
#9
11.80%
#10
11.36%
What city has the Highest Percentage of Ecuadorian Population in New York?
Springs has the Highest Percentage of Ecuadorian Population in New York with 24.90%.
What is the Percentage of Ecuadorian Population in the State of New York?
Percentage of Ecuadorian Population in New York is 1.43%.
What is the Percentage of Ecuadorian Population in the United States?
Percentage of Ecuadorian Population in the United States is 0.24%.