Zip Codes with the Highest Percentage of Population Employed in Food Preparation & Serving in Watertown, NY
RELATED REPORTS & OPTIONS
Food Preparation & Serving
Watertown
Compare Zip Codes
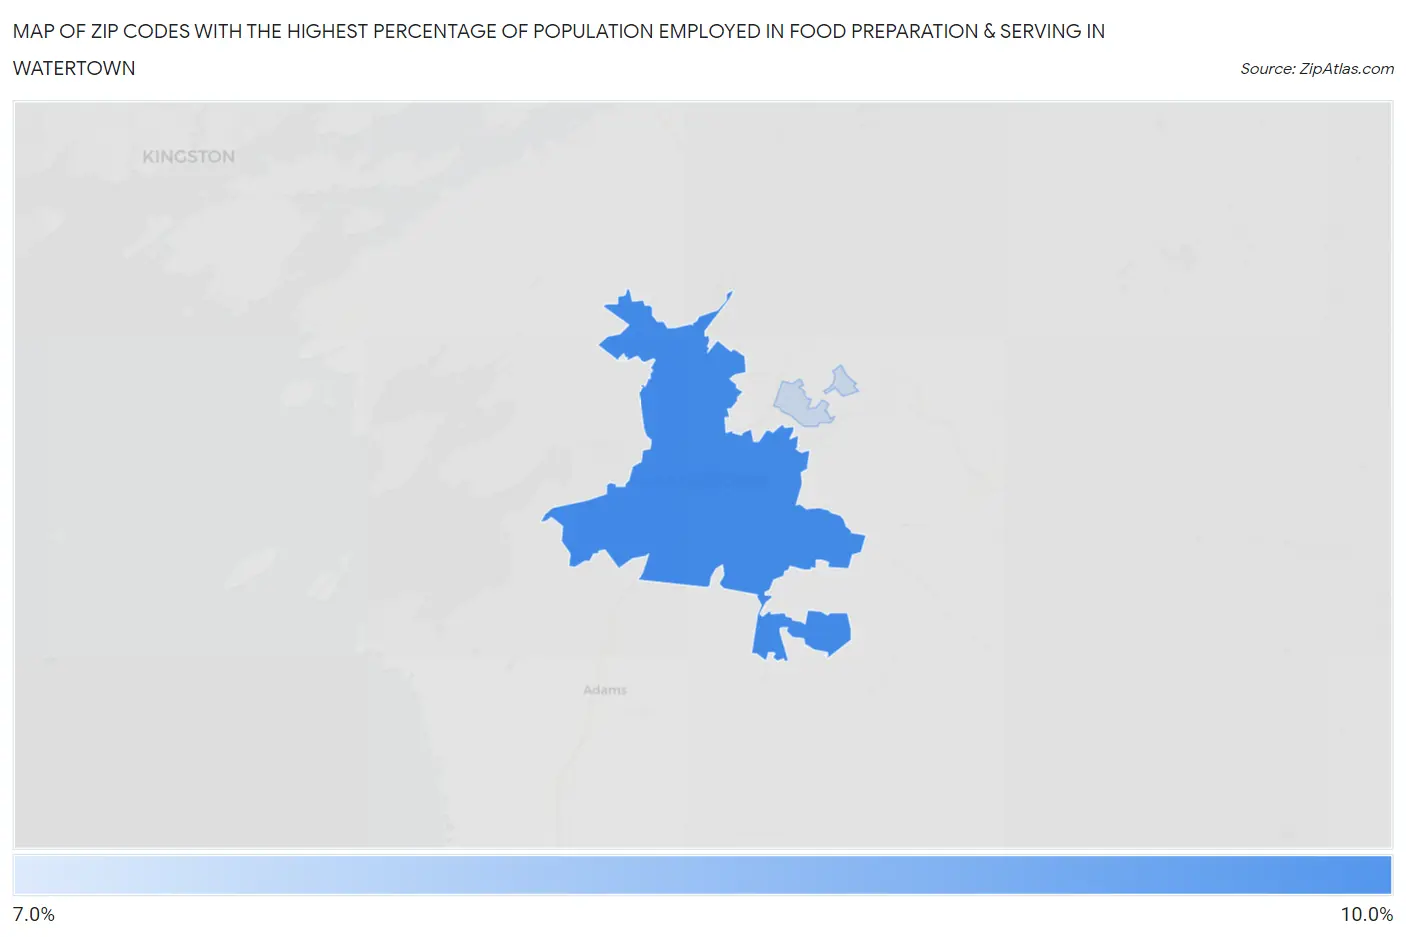
Map of Zip Codes with the Highest Percentage of Population Employed in Food Preparation & Serving in Watertown
7.3%
8.7%
Zip Codes with the Highest Percentage of Population Employed in Food Preparation & Serving in Watertown, NY
| Zip Code | % Employed | vs State | vs National | |
| 1. | 13601 | 8.7% | 4.8%(+3.87)#197 | 5.3%(+3.40)#3,873 |
| 2. | 13603 | 7.3% | 4.8%(+2.44)#300 | 5.3%(+1.97)#6,024 |
1
Common Questions
What are the Top Zip Codes with the Highest Percentage of Population Employed in Food Preparation & Serving in Watertown, NY?
Top Zip Codes with the Highest Percentage of Population Employed in Food Preparation & Serving in Watertown, NY are:
What zip code has the Highest Percentage of Population Employed in Food Preparation & Serving in Watertown, NY?
13601 has the Highest Percentage of Population Employed in Food Preparation & Serving in Watertown, NY with 8.7%.
What is the Percentage of Population Employed in Food Preparation & Serving in Watertown, NY?
Percentage of Population Employed in Food Preparation & Serving in Watertown is 11.2%.
What is the Percentage of Population Employed in Food Preparation & Serving in New York?
Percentage of Population Employed in Food Preparation & Serving in New York is 4.8%.
What is the Percentage of Population Employed in Food Preparation & Serving in the United States?
Percentage of Population Employed in Food Preparation & Serving in the United States is 5.3%.