Zip Codes with the Highest Percentage of Population Employed in Food Preparation & Serving in New York, NY

RELATED REPORTS & OPTIONS

Food Preparation & Serving
Population
Families and Households
Female Fertility
Female Fertility (Unmarried)
Race (Community Size)
Race (Percentage)
Ancestry (Community Size)
AfghanAfricanAlbanianAlsatianAmericanApacheArabArgentineanArmenianAssyrian / Chaldean / SyriacAustralianAustrianBahamianBarbadianBasqueBelgianBelizeanBermudanBhutaneseBlackfeetBolivianBrazilianBritishBritish West IndianBulgarianBurmeseCajunCambodianCanadianCape VerdeanCarpatho RusynCelticCentral AmericanCentral American IndianCherokeeChickasawChileanChippewaChoctawColombianCosta RicanCreekCroatianCubanCypriotCzechCzechoslovakianDanishDelawareDominicanDutchDutch West IndianEastern EuropeanEcuadorianEgyptianEnglishEstonianEthiopianEuropeanFilipinoFinnishFrenchFrench American IndianFrench CanadianGermanGhanaianGreekGuamanian / ChamorroGuatemalanGuyaneseHaitianHmongHonduranHungarianIcelanderIndian (Asian)IndonesianIranianIraqiIrishIroquoisIsraeliItalianJamaicanJapaneseJordanianKenyanKoreanLaotianLatvianLebaneseLiberianLithuanianLuxembourgerMacedonianMalaysianMalteseMexicanMexican American IndianMongolianMoroccanNative HawaiianNew ZealanderNicaraguanNigerianNorthern EuropeanNorwegianOkinawanPakistaniPalestinianPanamanianParaguayanPennsylvania GermanPeruvianPolishPortuguesePuebloPuerto RicanRomanianRussianSalvadoranSamoanScandinavianScotch-IrishScottishSenegaleseSerbianSierra LeoneanSiouxSlavicSlovakSloveneSomaliSouth AfricanSouth AmericanSouth American IndianSoviet UnionSpaniardSpanishSpanish AmericanSpanish American IndianSri LankanSubsaharan AfricanSudaneseSwedishSwissSyrianThaiTrinidadian and TobagonianTurkishU.S. Virgin IslanderUgandanUkrainianUruguayanVenezuelanVietnameseWelshWest IndianYugoslavianZimbabwean
Ancestry (Percentage)
AfghanAfricanAlbanianAlsatianAmericanApacheArabArgentineanArmenianAssyrian / Chaldean / SyriacAustralianAustrianBahamianBarbadianBasqueBelgianBelizeanBermudanBhutaneseBlackfeetBolivianBrazilianBritishBritish West IndianBulgarianBurmeseCajunCambodianCanadianCape VerdeanCarpatho RusynCelticCentral AmericanCentral American IndianCherokeeChickasawChileanChippewaChoctawColombianCosta RicanCreekCroatianCubanCypriotCzechCzechoslovakianDanishDelawareDominicanDutchDutch West IndianEastern EuropeanEcuadorianEgyptianEnglishEstonianEthiopianEuropeanFilipinoFinnishFrenchFrench American IndianFrench CanadianGermanGhanaianGreekGuamanian / ChamorroGuatemalanGuyaneseHaitianHmongHonduranHungarianIcelanderIndian (Asian)IndonesianIranianIraqiIrishIroquoisIsraeliItalianJamaicanJapaneseJordanianKenyanKoreanLaotianLatvianLebaneseLiberianLithuanianLuxembourgerMacedonianMalaysianMalteseMexicanMexican American IndianMongolianMoroccanNative HawaiianNew ZealanderNicaraguanNigerianNorthern EuropeanNorwegianOkinawanPakistaniPalestinianPanamanianParaguayanPennsylvania GermanPeruvianPolishPortuguesePuebloPuerto RicanRomanianRussianSalvadoranSamoanScandinavianScotch-IrishScottishSenegaleseSerbianSierra LeoneanSiouxSlavicSlovakSloveneSomaliSouth AfricanSouth AmericanSouth American IndianSoviet UnionSpaniardSpanishSpanish AmericanSpanish American IndianSri LankanSubsaharan AfricanSudaneseSwedishSwissSyrianThaiTrinidadian and TobagonianTurkishU.S. Virgin IslanderUgandanUkrainianUruguayanVenezuelanVietnameseWelshWest IndianYugoslavianZimbabwean
Immigrant Origin (Total)
AfghanistanAfricaAlbaniaArgentinaArmeniaAsiaAustraliaAustriaBahamasBangladeshBarbadosBelarusBelgiumBelizeBoliviaBosnia and HerzegovinaBrazilBulgariaBurma / MyanmarCambodiaCameroonCanadaCaribbeanCentral AmericaChileChinaColombiaCongoCosta RicaCroatiaCubaCzechoslovakiaDenmarkDominicaDominican RepublicEastern AfricaEastern AsiaEastern EuropeEcuadorEgyptEl SalvadorEnglandEritreaEthiopiaEuropeFranceGermanyGhanaGreeceGrenadaGuatemalaGuyanaHaitiHondurasHong KongHungaryIndiaIndonesiaIranIraqIrelandIsraelItalyJamaicaJapanJordanKazakhstanKenyaKoreaKuwaitLatin AmericaLatviaLebanonLiberiaLithuaniaMalaysiaMexicoMiddle AfricaMoldovaMoroccoNepalNetherlandsNicaraguaNigeriaNorth MacedoniaNorthern AfricaNorthern EuropeNorwayOceaniaPakistanPanamaPeruPhilippinesPolandPortugalRomaniaRussiaSaudi ArabiaScotlandSenegalSerbiaSierra LeoneSingaporeSomaliaSouth AfricaSouth AmericaSouth Central AsiaSouth Eastern AsiaSouthern EuropeSpainSri LankaSt. Vincent and the GrenadinesSudanSwedenSwitzerlandSyriaTaiwanThailandTrinidad and TobagoTurkeyUgandaUkraineUruguayUzbekistanVenezuelaVietnamWest IndiesWestern AfricaWestern AsiaWestern EuropeYemenZaireZimbabwe
Immigrant Origin (Percentage)
AfghanistanAfricaAlbaniaArgentinaArmeniaAsiaAustraliaAustriaBahamasBangladeshBarbadosBelarusBelgiumBelizeBoliviaBosnia and HerzegovinaBrazilBulgariaBurma / MyanmarCambodiaCameroonCanadaCaribbeanCentral AmericaChileChinaColombiaCongoCosta RicaCroatiaCubaCzechoslovakiaDenmarkDominicaDominican RepublicEastern AfricaEastern AsiaEastern EuropeEcuadorEgyptEl SalvadorEnglandEritreaEthiopiaEuropeFranceGermanyGhanaGreeceGrenadaGuatemalaGuyanaHaitiHondurasHong KongHungaryIndiaIndonesiaIranIraqIrelandIsraelItalyJamaicaJapanJordanKazakhstanKenyaKoreaKuwaitLatin AmericaLatviaLebanonLiberiaLithuaniaMalaysiaMexicoMiddle AfricaMoldovaMoroccoNepalNetherlandsNicaraguaNigeriaNorth MacedoniaNorthern AfricaNorthern EuropeNorwayOceaniaPakistanPanamaPeruPhilippinesPolandPortugalRomaniaRussiaSaudi ArabiaScotlandSenegalSerbiaSierra LeoneSingaporeSomaliaSouth AfricaSouth AmericaSouth Central AsiaSouth Eastern AsiaSouthern EuropeSpainSri LankaSt. Vincent and the GrenadinesSudanSwedenSwitzerlandSyriaTaiwanThailandTrinidad and TobagoTurkeyUgandaUkraineUruguayUzbekistanVenezuelaVietnamWest IndiesWestern AfricaWestern AsiaWestern EuropeYemenZaireZimbabwe
Income
Income (Families)
Income (Households)
Poverty
Poverty (Families)
Unemployment
Employment Occupations
Employment Industries
Employer Class
Commute Time
Commute Means
School Enrollment
Education by Degree Field
Occupancy
Finances
Physical Characteristics
New York
Compare Zip Codes
Comparison Subject

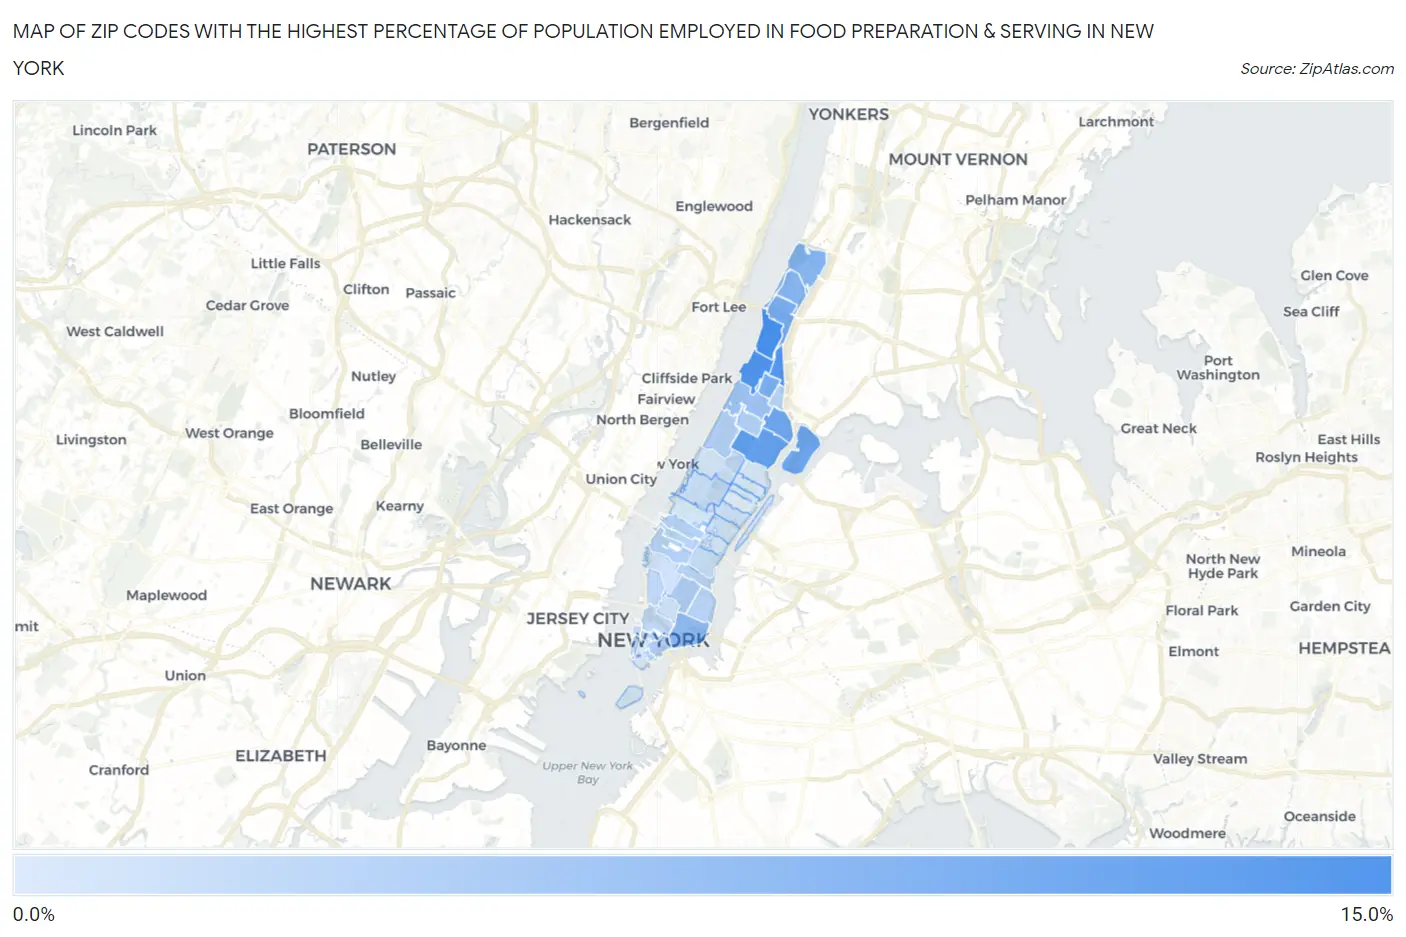
Map of Zip Codes with the Highest Percentage of Population Employed in Food Preparation & Serving in New York

0.0%
15.0%
Zip Codes with the Highest Percentage of Population Employed in Food Preparation & Serving in New York Map

Zip Codes with the Highest Percentage of Population Employed in Food Preparation & Serving in New York, NY

Zip Code % Employed vs State vs National
1.1003210.2%4.8%(+5.41)#1265.3%(+4.94)#2,465
2.100319.8%4.8%(+4.95)#1405.3%(+4.48)#2,832
3.100399.5%4.8%(+4.70)#1555.3%(+4.23)#3,042
4.100298.3%4.8%(+3.50)#2205.3%(+3.03)#4,297
5.100357.6%4.8%(+2.77)#2725.3%(+2.30)#5,396
6.100307.0%4.8%(+2.17)#3305.3%(+1.70)#6,603
7.100336.9%4.8%(+2.07)#3405.3%(+1.60)#6,862
8.101626.5%4.8%(+1.71)#3865.3%(+1.24)#7,804
9.100346.0%4.8%(+1.21)#4445.3%(+0.739)#9,260
10.100406.0%4.8%(+1.19)#4465.3%(+0.715)#9,341
11.100025.5%4.8%(+0.690)#5375.3%(+0.220)#11,048
12.100274.6%4.8%(-0.230)#7135.3%(-0.701)#14,673
13.100033.6%4.8%(-1.25)#9555.3%(-1.72)#18,920
14.100263.5%4.8%(-1.32)#9735.3%(-1.79)#19,210
15.100383.5%4.8%(-1.36)#9885.3%(-1.84)#19,395
16.100253.4%4.8%(-1.39)#9955.3%(-1.86)#19,494
17.100013.2%4.8%(-1.60)#1,0455.3%(-2.07)#20,408
18.100363.2%4.8%(-1.66)#1,0575.3%(-2.13)#20,632
19.100073.0%4.8%(-1.79)#1,0915.3%(-2.26)#21,151
20.100053.0%4.8%(-1.81)#1,1015.3%(-2.28)#21,241
21.100373.0%4.8%(-1.83)#1,1055.3%(-2.30)#21,313
22.100102.9%4.8%(-1.87)#1,1165.3%(-2.34)#21,449
23.100092.9%4.8%(-1.92)#1,1265.3%(-2.39)#21,667
24.100182.7%4.8%(-2.10)#1,1805.3%(-2.57)#22,384
25.102802.7%4.8%(-2.15)#1,1885.3%(-2.63)#22,561
26.100132.4%4.8%(-2.37)#1,2345.3%(-2.84)#23,326
27.100142.4%4.8%(-2.41)#1,2425.3%(-2.88)#23,459
28.102822.3%4.8%(-2.50)#1,2655.3%(-2.97)#23,735
29.100162.0%4.8%(-2.82)#1,3165.3%(-3.29)#24,717
30.100231.8%4.8%(-3.02)#1,3565.3%(-3.49)#25,260
31.100651.7%4.8%(-3.11)#1,3695.3%(-3.58)#25,514
32.100121.6%4.8%(-3.19)#1,3835.3%(-3.66)#25,710
33.100221.5%4.8%(-3.30)#1,3945.3%(-3.77)#25,954
34.100241.3%4.8%(-3.53)#1,4185.3%(-4.00)#26,450
35.100111.2%4.8%(-3.57)#1,4225.3%(-4.04)#26,508
36.100441.2%4.8%(-3.61)#1,4295.3%(-4.08)#26,580
37.100751.1%4.8%(-3.67)#1,4395.3%(-4.14)#26,711
38.100171.1%4.8%(-3.69)#1,4425.3%(-4.16)#26,757
39.101281.0%4.8%(-3.77)#1,4485.3%(-4.24)#26,893
40.100190.99%4.8%(-3.83)#1,4545.3%(-4.30)#26,987
41.100280.98%4.8%(-3.84)#1,4565.3%(-4.31)#27,015
42.100040.90%4.8%(-3.92)#1,4645.3%(-4.39)#27,158
43.100060.88%4.8%(-3.93)#1,4665.3%(-4.40)#27,179
44.100210.59%4.8%(-4.23)#1,4945.3%(-4.70)#27,594

Common Questions

What are the Top 10 Zip Codes with the Highest Percentage of Population Employed in Food Preparation & Serving in New York, NY?
Top 10 Zip Codes with the Highest Percentage of Population Employed in Food Preparation & Serving in New York, NY are:
#1
10.2%
#2
9.8%
#3
9.5%
#4
8.3%
#5
7.6%
#6
7.0%
#7
6.9%
#8
6.5%
#9
6.0%
#10
6.0%
What zip code has the Highest Percentage of Population Employed in Food Preparation & Serving in New York, NY?
10032 has the Highest Percentage of Population Employed in Food Preparation & Serving in New York, NY with 10.2%.
What is the Percentage of Population Employed in Food Preparation & Serving in New York, NY?
Percentage of Population Employed in Food Preparation & Serving in New York is 5.0%.
What is the Percentage of Population Employed in Food Preparation & Serving in New York?
Percentage of Population Employed in Food Preparation & Serving in New York is 4.8%.
What is the Percentage of Population Employed in Food Preparation & Serving in the United States?
Percentage of Population Employed in Food Preparation & Serving in the United States is 5.3%.