Pine Hill, NY Map & Demographics
Pine Hill Map
Pine Hill Overview
$52,013
PER CAPITA INCOME
$81,181
AVG HOUSEHOLD INCOME
0.44
INEQUALITY / GINI INDEX
360
TOTAL POPULATION
239
MALE POPULATION
121
FEMALE POPULATION
197.52
MALES / 100 FEMALES
50.63
FEMALES / 100 MALES
55.5
MEDIAN AGE
2.8
AVG FAMILY SIZE
2.1
AVG HOUSEHOLD SIZE
185
LABOR FORCE [ PEOPLE ]
54.1%
PERCENT IN LABOR FORCE
Pine Hill Zip Codes
Pine Hill Area Codes
Income in Pine Hill
Income Overview in Pine Hill
| Characteristic | Number | Measure |
| Per Capita Income | 360 | $52,013 |
| Median Family Income | 97 | $0 |
| Mean Family Income | 97 | $155,145 |
| Median Household Income | 175 | $81,181 |
| Mean Household Income | 175 | $111,583 |
| Income Deficit | 97 | $0 |
| Wage / Income Gap (%) | 360 | 0.00% |
| Wage / Income Gap ($) | 360 | 100.00¢ per $1 |
| Gini / Inequality Index | 360 | 0.44 |
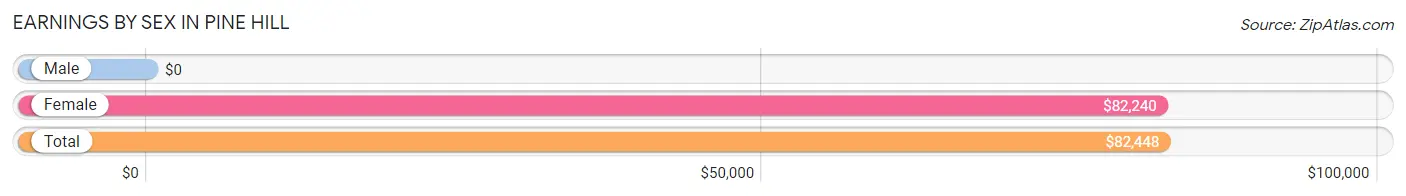
Earnings by Sex in Pine Hill
| Sex | Number | Average Earnings |
| Male | 104 (56.2%) | $0 |
| Female | 81 (43.8%) | $82,240 |
| Total | 185 (100.0%) | $82,448 |
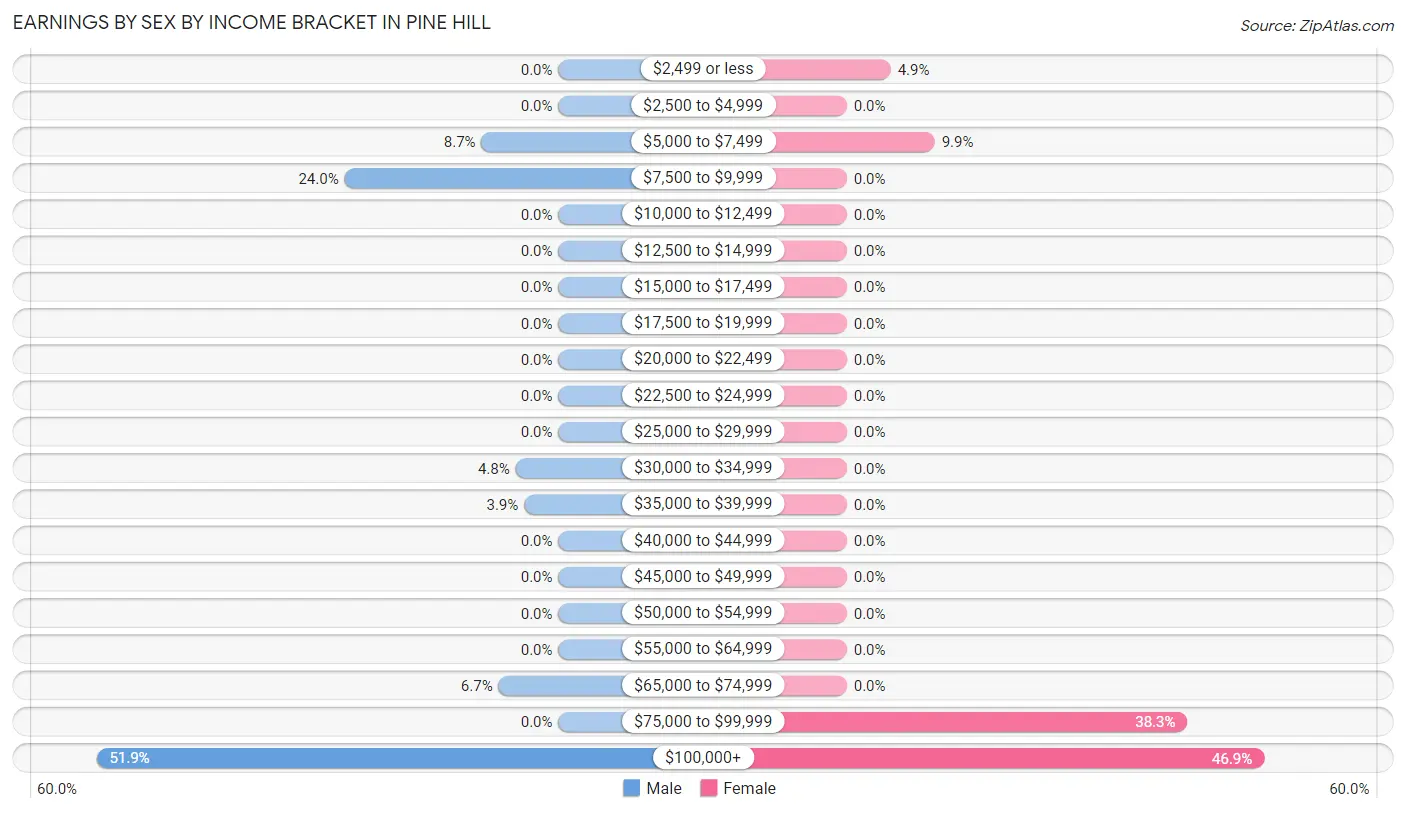
Earnings by Sex by Income Bracket in Pine Hill
The most common earnings brackets in Pine Hill are $100,000+ for men (54 | 51.9%) and $100,000+ for women (38 | 46.9%).
| Income | Male | Female |
| $2,499 or less | 0 (0.0%) | 4 (4.9%) |
| $2,500 to $4,999 | 0 (0.0%) | 0 (0.0%) |
| $5,000 to $7,499 | 9 (8.6%) | 8 (9.9%) |
| $7,500 to $9,999 | 25 (24.0%) | 0 (0.0%) |
| $10,000 to $12,499 | 0 (0.0%) | 0 (0.0%) |
| $12,500 to $14,999 | 0 (0.0%) | 0 (0.0%) |
| $15,000 to $17,499 | 0 (0.0%) | 0 (0.0%) |
| $17,500 to $19,999 | 0 (0.0%) | 0 (0.0%) |
| $20,000 to $22,499 | 0 (0.0%) | 0 (0.0%) |
| $22,500 to $24,999 | 0 (0.0%) | 0 (0.0%) |
| $25,000 to $29,999 | 0 (0.0%) | 0 (0.0%) |
| $30,000 to $34,999 | 5 (4.8%) | 0 (0.0%) |
| $35,000 to $39,999 | 4 (3.8%) | 0 (0.0%) |
| $40,000 to $44,999 | 0 (0.0%) | 0 (0.0%) |
| $45,000 to $49,999 | 0 (0.0%) | 0 (0.0%) |
| $50,000 to $54,999 | 0 (0.0%) | 0 (0.0%) |
| $55,000 to $64,999 | 0 (0.0%) | 0 (0.0%) |
| $65,000 to $74,999 | 7 (6.7%) | 0 (0.0%) |
| $75,000 to $99,999 | 0 (0.0%) | 31 (38.3%) |
| $100,000+ | 54 (51.9%) | 38 (46.9%) |
| Total | 104 (100.0%) | 81 (100.0%) |
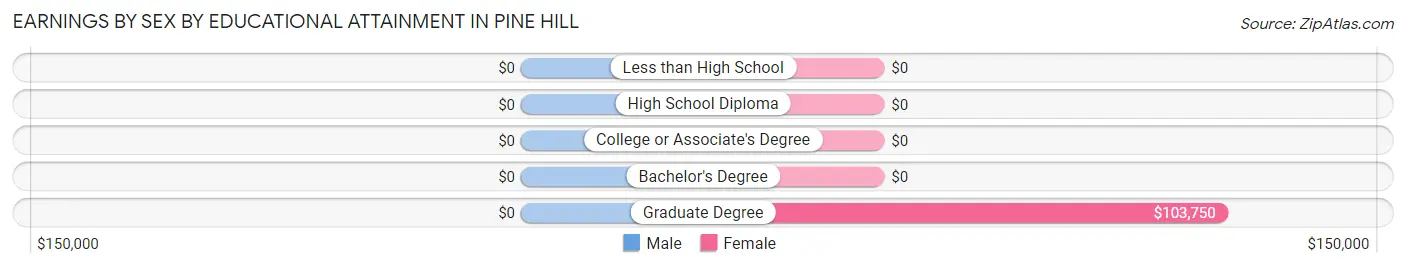
Earnings by Sex by Educational Attainment in Pine Hill
| Educational Attainment | Male Income | Female Income |
| Less than High School | - | - |
| High School Diploma | - | - |
| College or Associate's Degree | - | - |
| Bachelor's Degree | - | - |
| Graduate Degree | - | - |
| Total | - | - |
Family Income in Pine Hill
Family Income Brackets in Pine Hill
According to the Pine Hill family income data, there are 46 families falling into the $200,000+ income range, which is the most common income bracket and makes up 47.4% of all families.
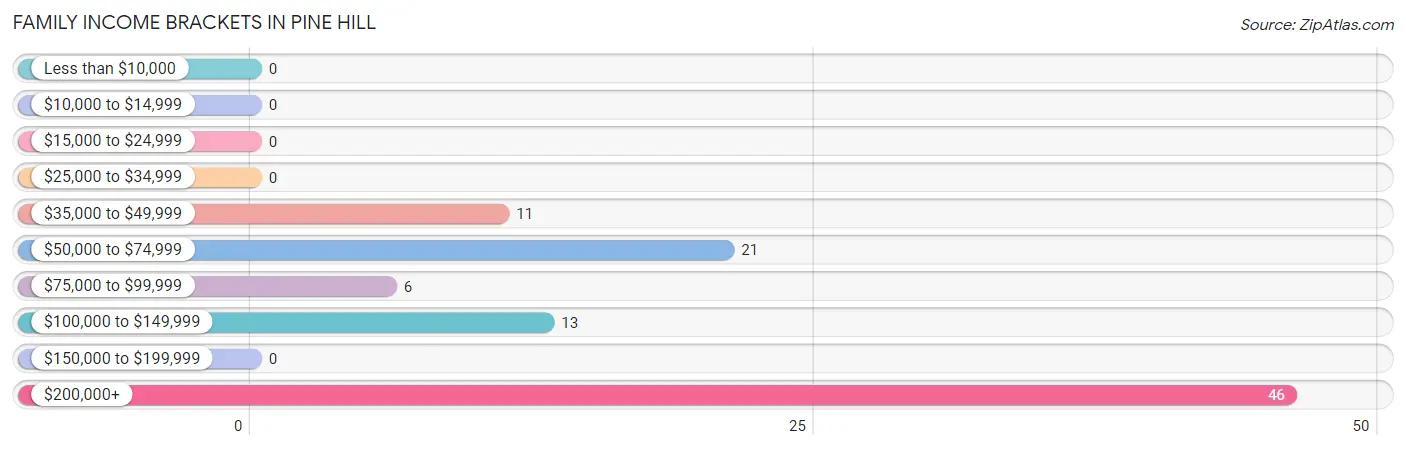
| Income Bracket | # Families | % Families |
| Less than $10,000 | 0 | 0.0% |
| $10,000 to $14,999 | 0 | 0.0% |
| $15,000 to $24,999 | 0 | 0.0% |
| $25,000 to $34,999 | 0 | 0.0% |
| $35,000 to $49,999 | 11 | 11.3% |
| $50,000 to $74,999 | 21 | 21.6% |
| $75,000 to $99,999 | 6 | 6.2% |
| $100,000 to $149,999 | 13 | 13.4% |
| $150,000 to $199,999 | 0 | 0.0% |
| $200,000+ | 46 | 47.4% |
Family Income by Famaliy Size in Pine Hill
2-person families (43 | 44.3%) account for the highest median family income in Pine Hill with $66,250 per family, while 2-person families (43 | 44.3%) have the highest median income of $33,125 per family member.
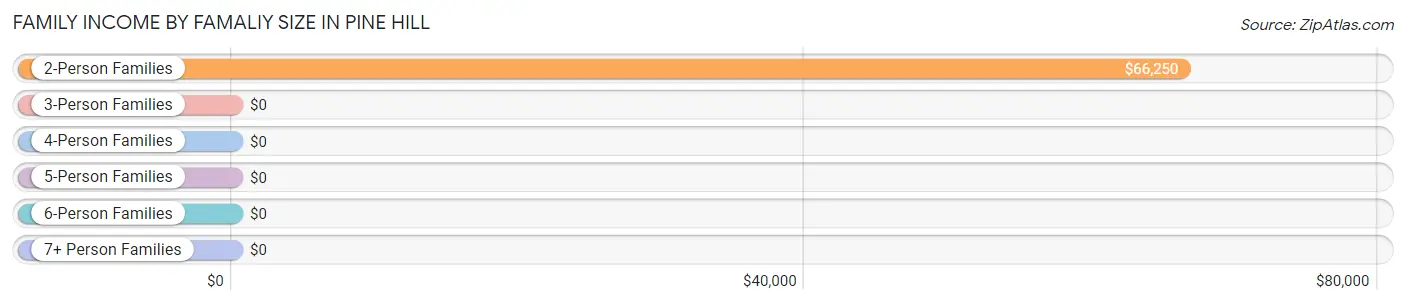
| Income Bracket | # Families | Median Income |
| 2-Person Families | 43 (44.3%) | $66,250 |
| 3-Person Families | 46 (47.4%) | $0 |
| 4-Person Families | 8 (8.3%) | $0 |
| 5-Person Families | 0 (0.0%) | $0 |
| 6-Person Families | 0 (0.0%) | $0 |
| 7+ Person Families | 0 (0.0%) | $0 |
| Total | 97 (100.0%) | $0 |
Family Income by Number of Earners in Pine Hill
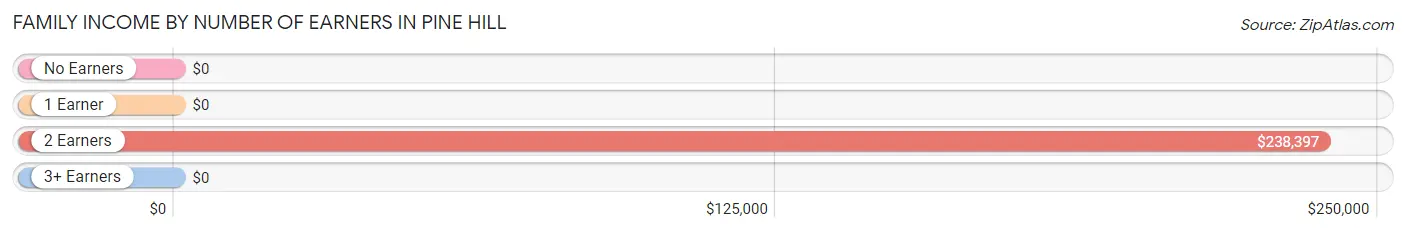
| Number of Earners | # Families | Median Income |
| No Earners | 12 (12.4%) | $0 |
| 1 Earner | 26 (26.8%) | $0 |
| 2 Earners | 59 (60.8%) | $238,397 |
| 3+ Earners | 0 (0.0%) | $0 |
| Total | 97 (100.0%) | $0 |
Household Income in Pine Hill
Household Income Brackets in Pine Hill
With 46 households falling in the category, the $200,000+ income range is the most frequent in Pine Hill, accounting for 26.3% of all households.
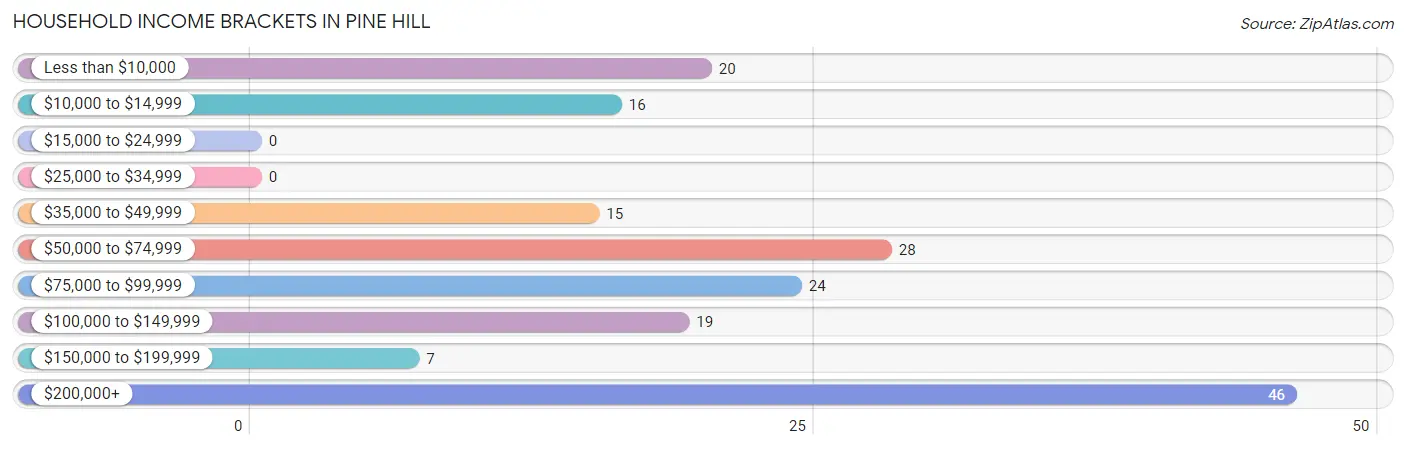
| Income Bracket | # Households | % Households |
| Less than $10,000 | 20 | 11.4% |
| $10,000 to $14,999 | 16 | 9.1% |
| $15,000 to $24,999 | 0 | 0.0% |
| $25,000 to $34,999 | 0 | 0.0% |
| $35,000 to $49,999 | 15 | 8.6% |
| $50,000 to $74,999 | 28 | 16.0% |
| $75,000 to $99,999 | 24 | 13.7% |
| $100,000 to $149,999 | 19 | 10.9% |
| $150,000 to $199,999 | 7 | 4.0% |
| $200,000+ | 46 | 26.3% |
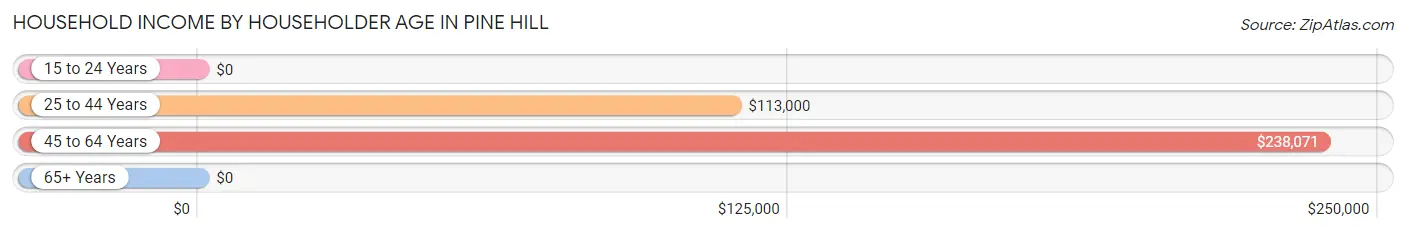
Household Income by Householder Age in Pine Hill
The median household income in Pine Hill is $81,181, with the highest median household income of $238,071 found in the 45 to 64 years age bracket for the primary householder. A total of 71 households (40.6%) fall into this category.
| Income Bracket | # Households | Median Income |
| 15 to 24 Years | 0 (0.0%) | $0 |
| 25 to 44 Years | 38 (21.7%) | $113,000 |
| 45 to 64 Years | 71 (40.6%) | $238,071 |
| 65+ Years | 66 (37.7%) | $0 |
| Total | 175 (100.0%) | $81,181 |
Poverty in Pine Hill
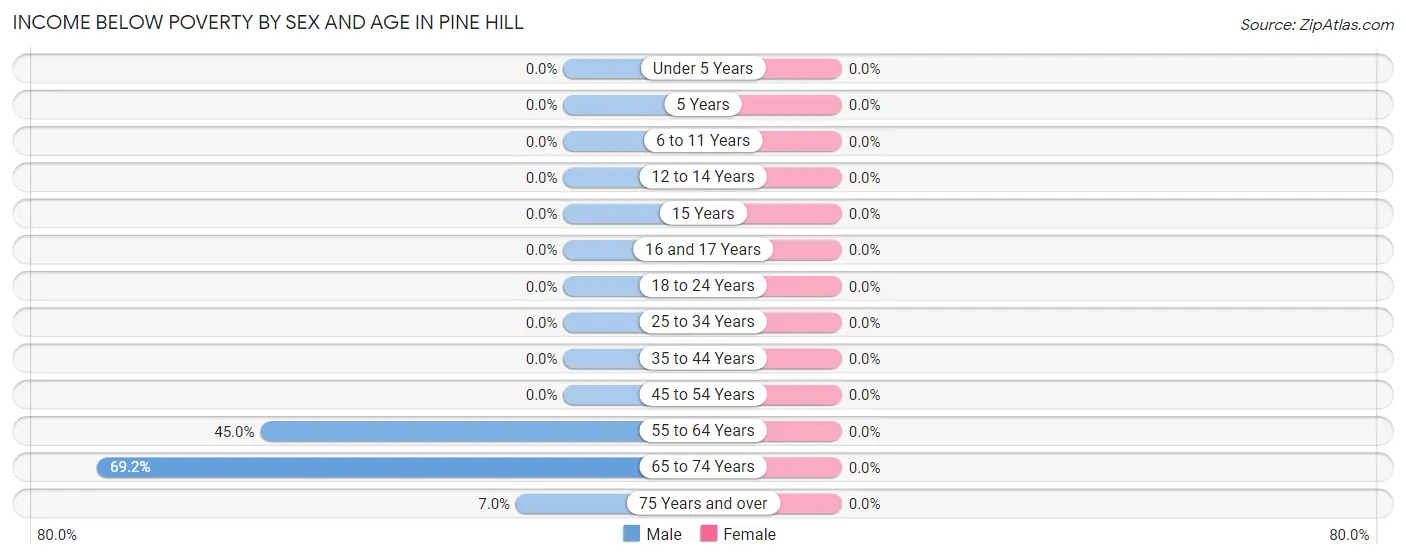
Income Below Poverty by Sex and Age in Pine Hill
| Age Bracket | Male | Female |
| Under 5 Years | 0 (0.0%) | 0 (0.0%) |
| 5 Years | 0 (0.0%) | 0 (0.0%) |
| 6 to 11 Years | 0 (0.0%) | 0 (0.0%) |
| 12 to 14 Years | 0 (0.0%) | 0 (0.0%) |
| 15 Years | 0 (0.0%) | 0 (0.0%) |
| 16 and 17 Years | 0 (0.0%) | 0 (0.0%) |
| 18 to 24 Years | 0 (0.0%) | 0 (0.0%) |
| 25 to 34 Years | 0 (0.0%) | 0 (0.0%) |
| 35 to 44 Years | 0 (0.0%) | 0 (0.0%) |
| 45 to 54 Years | 0 (0.0%) | 0 (0.0%) |
| 55 to 64 Years | 9 (45.0%) | 0 (0.0%) |
| 65 to 74 Years | 27 (69.2%) | 0 (0.0%) |
| 75 Years and over | 5 (7.0%) | 0 (0.0%) |
| Total | 41 (17.2%) | 0 (0.0%) |
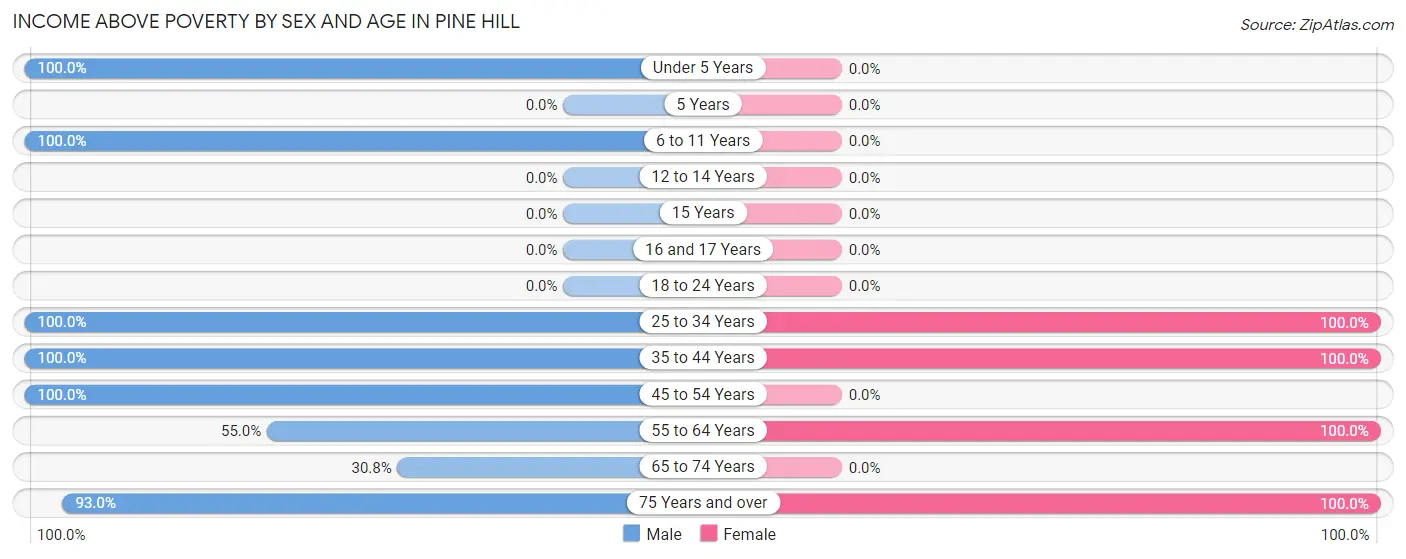
Income Above Poverty by Sex and Age in Pine Hill
According to the poverty statistics in Pine Hill, males aged under 5 years and females aged 25 to 34 years are the age groups that are most secure financially, with 100.0% of males and 100.0% of females in these age groups living above the poverty line.
| Age Bracket | Male | Female |
| Under 5 Years | 10 (100.0%) | 0 (0.0%) |
| 5 Years | 0 (0.0%) | 0 (0.0%) |
| 6 to 11 Years | 8 (100.0%) | 0 (0.0%) |
| 12 to 14 Years | 0 (0.0%) | 0 (0.0%) |
| 15 Years | 0 (0.0%) | 0 (0.0%) |
| 16 and 17 Years | 0 (0.0%) | 0 (0.0%) |
| 18 to 24 Years | 0 (0.0%) | 0 (0.0%) |
| 25 to 34 Years | 40 (100.0%) | 53 (100.0%) |
| 35 to 44 Years | 5 (100.0%) | 18 (100.0%) |
| 45 to 54 Years | 46 (100.0%) | 0 (0.0%) |
| 55 to 64 Years | 11 (55.0%) | 16 (100.0%) |
| 65 to 74 Years | 12 (30.8%) | 0 (0.0%) |
| 75 Years and over | 66 (93.0%) | 34 (100.0%) |
| Total | 198 (82.9%) | 121 (100.0%) |
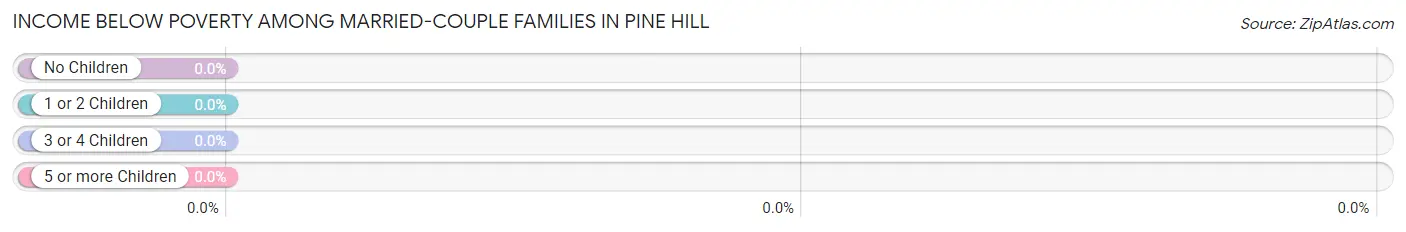
Income Below Poverty Among Married-Couple Families in Pine Hill
| Children | Above Poverty | Below Poverty |
| No Children | 62 (100.0%) | 0 (0.0%) |
| 1 or 2 Children | 8 (100.0%) | 0 (0.0%) |
| 3 or 4 Children | 0 (0.0%) | 0 (0.0%) |
| 5 or more Children | 0 (0.0%) | 0 (0.0%) |
| Total | 70 (100.0%) | 0 (0.0%) |
Income Below Poverty Among Single-Parent Households in Pine Hill
| Children | Single Father | Single Mother |
| No Children | 0 (0.0%) | 0 (0.0%) |
| 1 or 2 Children | 0 (0.0%) | 0 (0.0%) |
| 3 or 4 Children | 0 (0.0%) | 0 (0.0%) |
| 5 or more Children | 0 (0.0%) | 0 (0.0%) |
| Total | 0 (0.0%) | 0 (0.0%) |
Income Below Poverty Among Married-Couple vs Single-Parent Households in Pine Hill
| Children | Married-Couple Families | Single-Parent Households |
| No Children | 0 (0.0%) | 0 (0.0%) |
| 1 or 2 Children | 0 (0.0%) | 0 (0.0%) |
| 3 or 4 Children | 0 (0.0%) | 0 (0.0%) |
| 5 or more Children | 0 (0.0%) | 0 (0.0%) |
| Total | 0 (0.0%) | 0 (0.0%) |
Race in Pine Hill
The most populous races in Pine Hill are White / Caucasian (212 | 58.9%), Asian (144 | 40.0%), and Hispanic or Latino (8 | 2.2%).
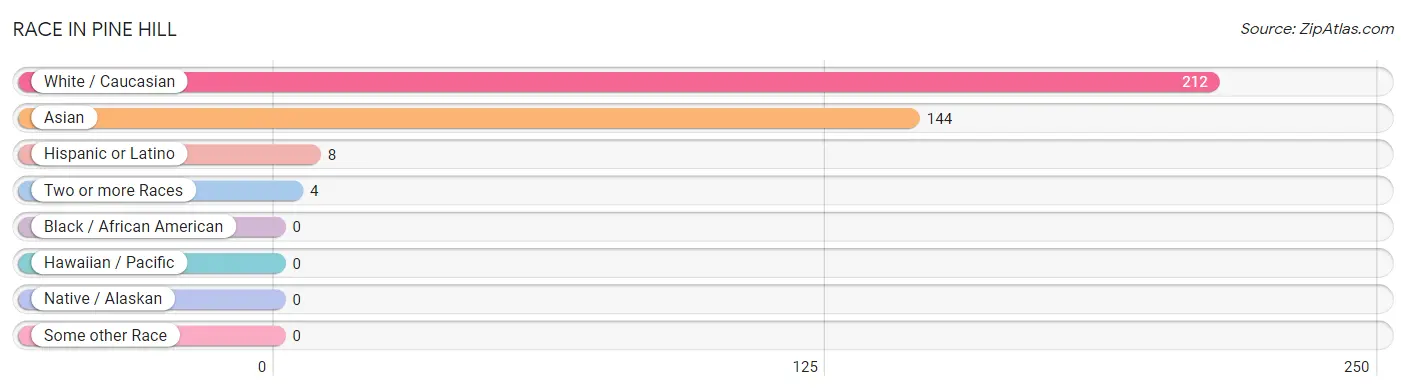
| Race | # Population | % Population |
| Asian | 144 | 40.0% |
| Black / African American | 0 | 0.0% |
| Hawaiian / Pacific | 0 | 0.0% |
| Hispanic or Latino | 8 | 2.2% |
| Native / Alaskan | 0 | 0.0% |
| White / Caucasian | 212 | 58.9% |
| Two or more Races | 4 | 1.1% |
| Some other Race | 0 | 0.0% |
| Total | 360 | 100.0% |
Ancestry in Pine Hill
The most populous ancestries reported in Pine Hill are Indian (Asian) (144 | 40.0%), Italian (58 | 16.1%), German (36 | 10.0%), Polish (19 | 5.3%), and American (18 | 5.0%), together accounting for 76.4% of all Pine Hill residents.
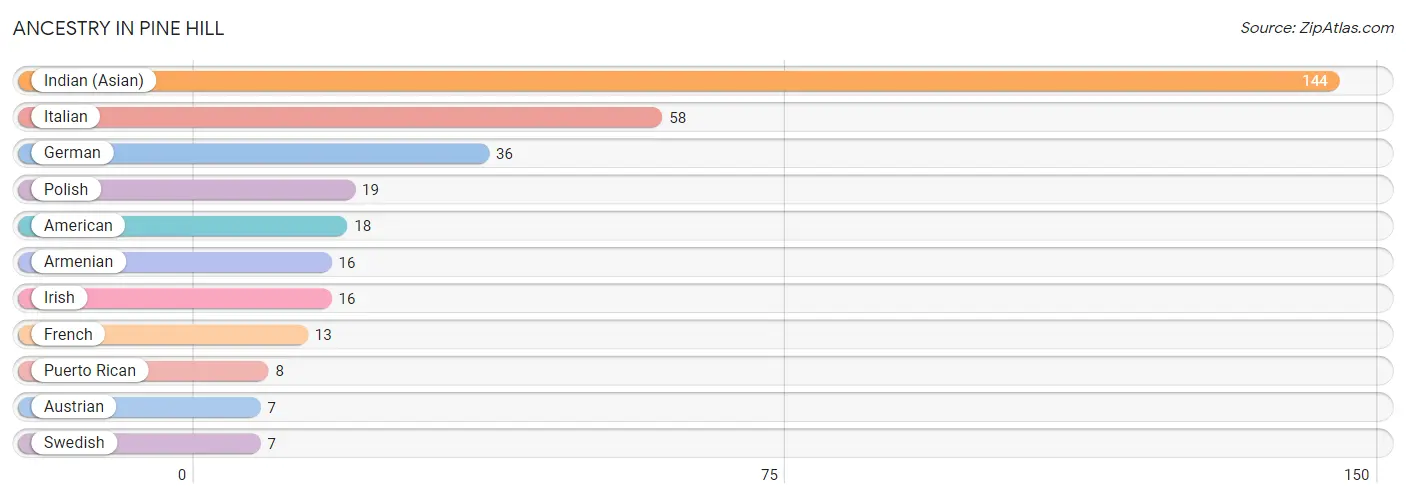
| Ancestry | # Population | % Population |
| American | 18 | 5.0% |
| Armenian | 16 | 4.4% |
| Austrian | 7 | 1.9% |
| French | 13 | 3.6% |
| German | 36 | 10.0% |
| Indian (Asian) | 144 | 40.0% |
| Irish | 16 | 4.4% |
| Italian | 58 | 16.1% |
| Polish | 19 | 5.3% |
| Puerto Rican | 8 | 2.2% |
| Swedish | 7 | 1.9% | View All 11 Rows |
Immigrants in Pine Hill
The most numerous immigrant groups reported in Pine Hill came from Asia (78 | 21.7%), China (78 | 21.7%), Eastern Asia (78 | 21.7%), Europe (24 | 6.7%), and Italy (11 | 3.1%), together accounting for 74.7% of all Pine Hill residents.
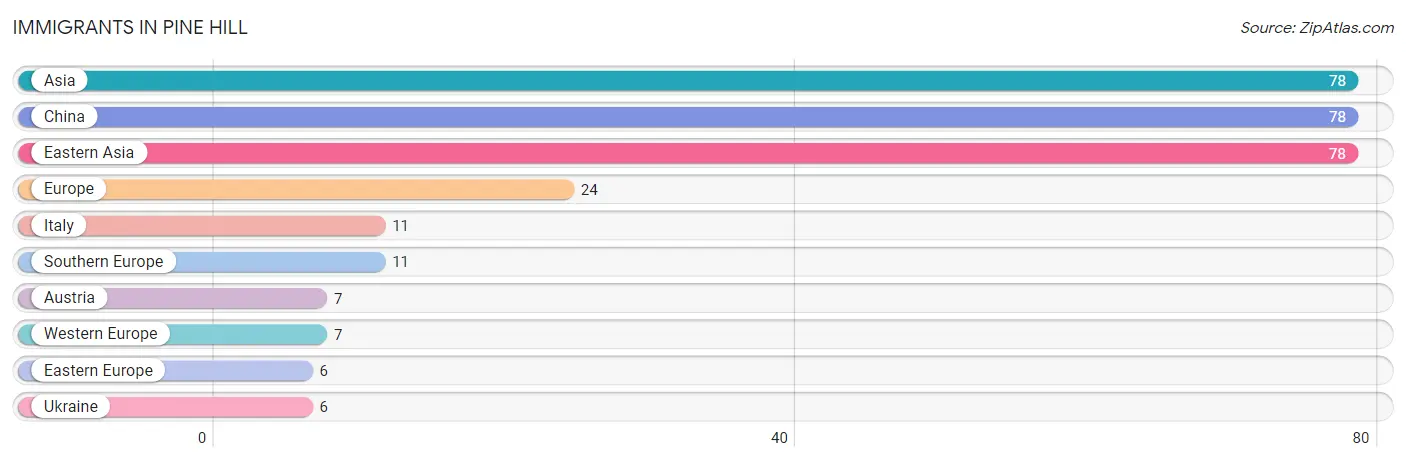
| Immigration Origin | # Population | % Population |
| Asia | 78 | 21.7% |
| Austria | 7 | 1.9% |
| China | 78 | 21.7% |
| Eastern Asia | 78 | 21.7% |
| Eastern Europe | 6 | 1.7% |
| Europe | 24 | 6.7% |
| Italy | 11 | 3.1% |
| Southern Europe | 11 | 3.1% |
| Ukraine | 6 | 1.7% |
| Western Europe | 7 | 1.9% | View All 10 Rows |
Sex and Age in Pine Hill
Sex and Age in Pine Hill
The most populous age groups in Pine Hill are 80 to 84 Years (71 | 29.7%) for men and 30 to 34 Years (46 | 38.0%) for women.
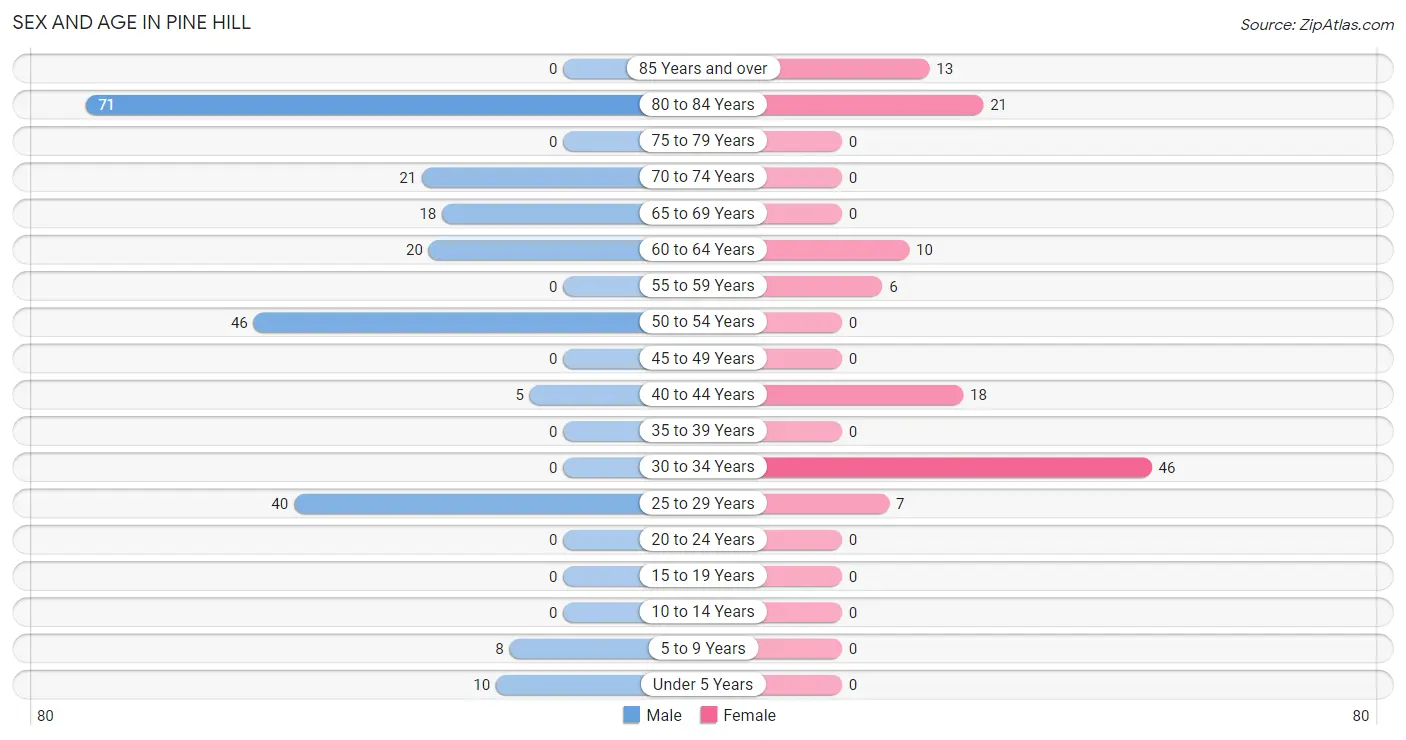
| Age Bracket | Male | Female |
| Under 5 Years | 10 (4.2%) | 0 (0.0%) |
| 5 to 9 Years | 8 (3.4%) | 0 (0.0%) |
| 10 to 14 Years | 0 (0.0%) | 0 (0.0%) |
| 15 to 19 Years | 0 (0.0%) | 0 (0.0%) |
| 20 to 24 Years | 0 (0.0%) | 0 (0.0%) |
| 25 to 29 Years | 40 (16.7%) | 7 (5.8%) |
| 30 to 34 Years | 0 (0.0%) | 46 (38.0%) |
| 35 to 39 Years | 0 (0.0%) | 0 (0.0%) |
| 40 to 44 Years | 5 (2.1%) | 18 (14.9%) |
| 45 to 49 Years | 0 (0.0%) | 0 (0.0%) |
| 50 to 54 Years | 46 (19.3%) | 0 (0.0%) |
| 55 to 59 Years | 0 (0.0%) | 6 (5.0%) |
| 60 to 64 Years | 20 (8.4%) | 10 (8.3%) |
| 65 to 69 Years | 18 (7.5%) | 0 (0.0%) |
| 70 to 74 Years | 21 (8.8%) | 0 (0.0%) |
| 75 to 79 Years | 0 (0.0%) | 0 (0.0%) |
| 80 to 84 Years | 71 (29.7%) | 21 (17.4%) |
| 85 Years and over | 0 (0.0%) | 13 (10.7%) |
| Total | 239 (100.0%) | 121 (100.0%) |
Families and Households in Pine Hill
Median Family Size in Pine Hill
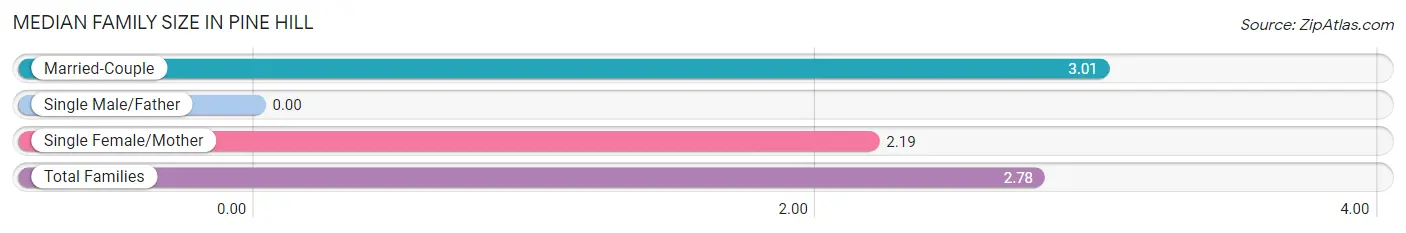
| Family Type | # Families | Family Size |
| Married-Couple | 70 (72.2%) | 3.01 |
| Single Male/Father | 0 (0.0%) | - |
| Single Female/Mother | 27 (27.8%) | 2.19 |
| Total Families | 97 (100.0%) | 2.78 |
Median Household Size in Pine Hill
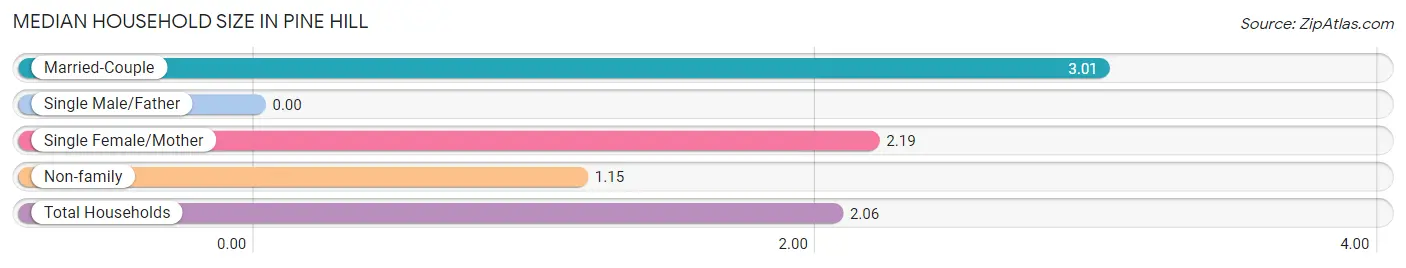
| Household Type | # Households | Household Size |
| Married-Couple | 70 (40.0%) | 3.01 |
| Single Male/Father | 0 (0.0%) | - |
| Single Female/Mother | 27 (15.4%) | 2.19 |
| Non-family | 78 (44.6%) | 1.15 |
| Total Households | 175 (100.0%) | 2.06 |
Household Size by Marriage Status in Pine Hill
Out of a total of 175 households in Pine Hill, 97 (55.4%) are family households, while 78 (44.6%) are nonfamily households. The most numerous type of family households are 3-person households, comprising 46, and the most common type of nonfamily households are 1-person households, comprising 65.
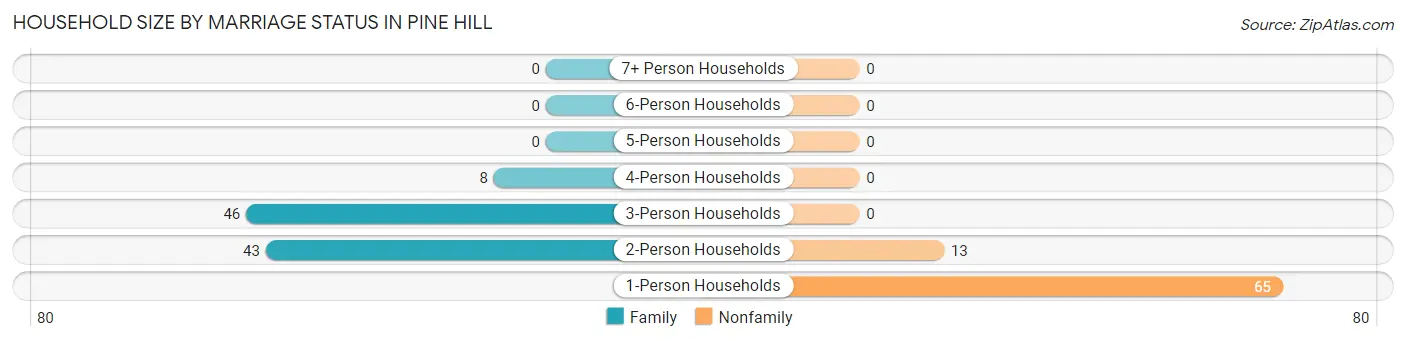
| Household Size | Family Households | Nonfamily Households |
| 1-Person Households | - | 65 (37.1%) |
| 2-Person Households | 43 (24.6%) | 13 (7.4%) |
| 3-Person Households | 46 (26.3%) | 0 (0.0%) |
| 4-Person Households | 8 (4.6%) | 0 (0.0%) |
| 5-Person Households | 0 (0.0%) | 0 (0.0%) |
| 6-Person Households | 0 (0.0%) | 0 (0.0%) |
| 7+ Person Households | 0 (0.0%) | 0 (0.0%) |
| Total | 97 (55.4%) | 78 (44.6%) |
Female Fertility in Pine Hill
Fertility by Age in Pine Hill
| Age Bracket | Women with Births | Births / 1,000 Women |
| 15 to 19 years | 0 (0.0%) | 0.0 |
| 20 to 34 years | 0 (0.0%) | 0.0 |
| 35 to 50 years | 0 (0.0%) | 0.0 |
| Total | 0 (0.0%) | 0.0 |
Fertility by Age by Marriage Status in Pine Hill
| Age Bracket | Married | Unmarried |
| 15 to 19 years | 0 (0.0%) | 0 (0.0%) |
| 20 to 34 years | 0 (0.0%) | 0 (0.0%) |
| 35 to 50 years | 0 (0.0%) | 0 (0.0%) |
| Total | 0 (0.0%) | 0 (0.0%) |
Fertility by Education in Pine Hill
| Educational Attainment | Women with Births | Births / 1,000 Women |
| Less than High School | 0 (0.0%) | 0.0 |
| High School Diploma | 0 (0.0%) | 0.0 |
| College or Associate's Degree | 0 (0.0%) | 0.0 |
| Bachelor's Degree | 0 (0.0%) | 0.0 |
| Graduate Degree | 0 (0.0%) | 0.0 |
| Total | 0 (0.0%) | 0.0 |
Fertility by Education by Marriage Status in Pine Hill
| Educational Attainment | Married | Unmarried |
| Less than High School | 0 (0.0%) | 0 (0.0%) |
| High School Diploma | 0 (0.0%) | 0 (0.0%) |
| College or Associate's Degree | 0 (0.0%) | 0 (0.0%) |
| Bachelor's Degree | 0 (0.0%) | 0 (0.0%) |
| Graduate Degree | 0 (0.0%) | 0 (0.0%) |
| Total | 0 (0.0%) | 0 (0.0%) |
Employment Characteristics in Pine Hill
Employment by Class of Employer in Pine Hill
Among the 185 employed individuals in Pine Hill, private company employees (119 | 64.3%), local government employees (46 | 24.9%), and self-employed (incorporated) (14 | 7.6%) make up the most common classes of employment.
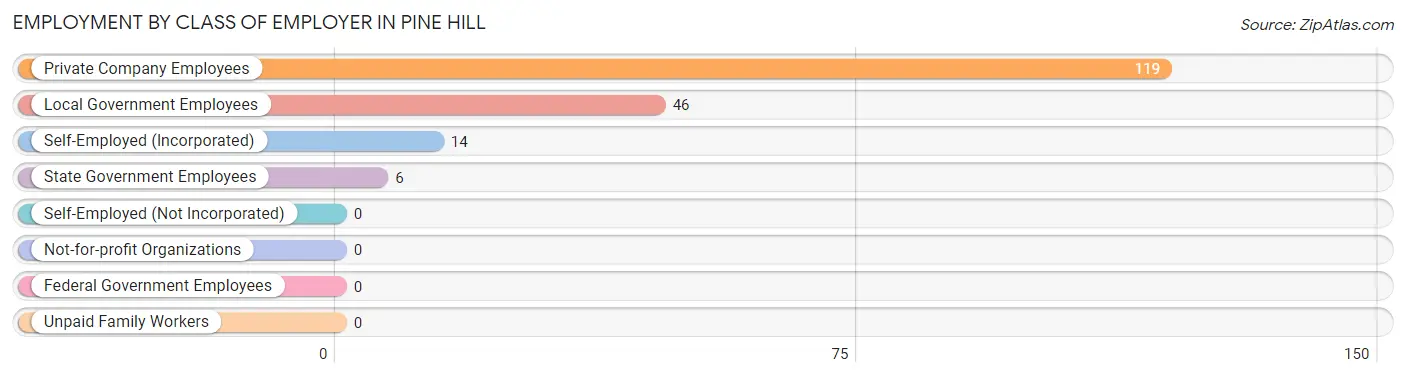
| Employer Class | # Employees | % Employees |
| Private Company Employees | 119 | 64.3% |
| Self-Employed (Incorporated) | 14 | 7.6% |
| Self-Employed (Not Incorporated) | 0 | 0.0% |
| Not-for-profit Organizations | 0 | 0.0% |
| Local Government Employees | 46 | 24.9% |
| State Government Employees | 6 | 3.2% |
| Federal Government Employees | 0 | 0.0% |
| Unpaid Family Workers | 0 | 0.0% |
| Total | 185 | 100.0% |
Employment Status by Age in Pine Hill
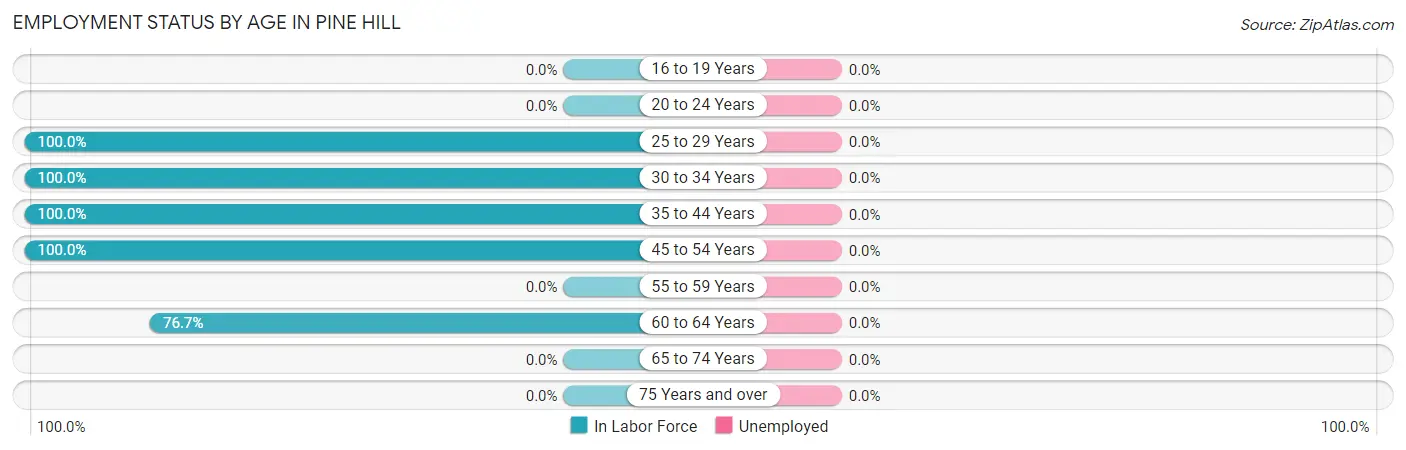
| Age Bracket | In Labor Force | Unemployed |
| 16 to 19 Years | 0 (0.0%) | 0 (0.0%) |
| 20 to 24 Years | 0 (0.0%) | 0 (0.0%) |
| 25 to 29 Years | 47 (100.0%) | 0 (0.0%) |
| 30 to 34 Years | 46 (100.0%) | 0 (0.0%) |
| 35 to 44 Years | 23 (100.0%) | 0 (0.0%) |
| 45 to 54 Years | 46 (100.0%) | 0 (0.0%) |
| 55 to 59 Years | 0 (0.0%) | 0 (0.0%) |
| 60 to 64 Years | 23 (76.7%) | 0 (0.0%) |
| 65 to 74 Years | 0 (0.0%) | 0 (0.0%) |
| 75 Years and over | 0 (0.0%) | 0 (0.0%) |
| Total | 185 (54.1%) | 0 (0.0%) |
Employment Status by Educational Attainment in Pine Hill
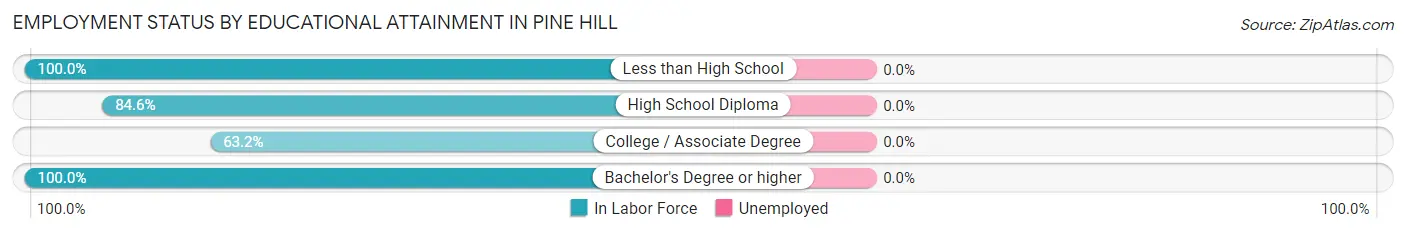
| Educational Attainment | In Labor Force | Unemployed |
| Less than High School | 13 (100.0%) | 0 (0.0%) |
| High School Diploma | 33 (84.6%) | 0 (0.0%) |
| College / Associate Degree | 12 (63.2%) | 0 (0.0%) |
| Bachelor's Degree or higher | 127 (100.0%) | 0 (0.0%) |
| Total | 185 (93.4%) | 0 (0.0%) |
Employment Occupations by Sex in Pine Hill
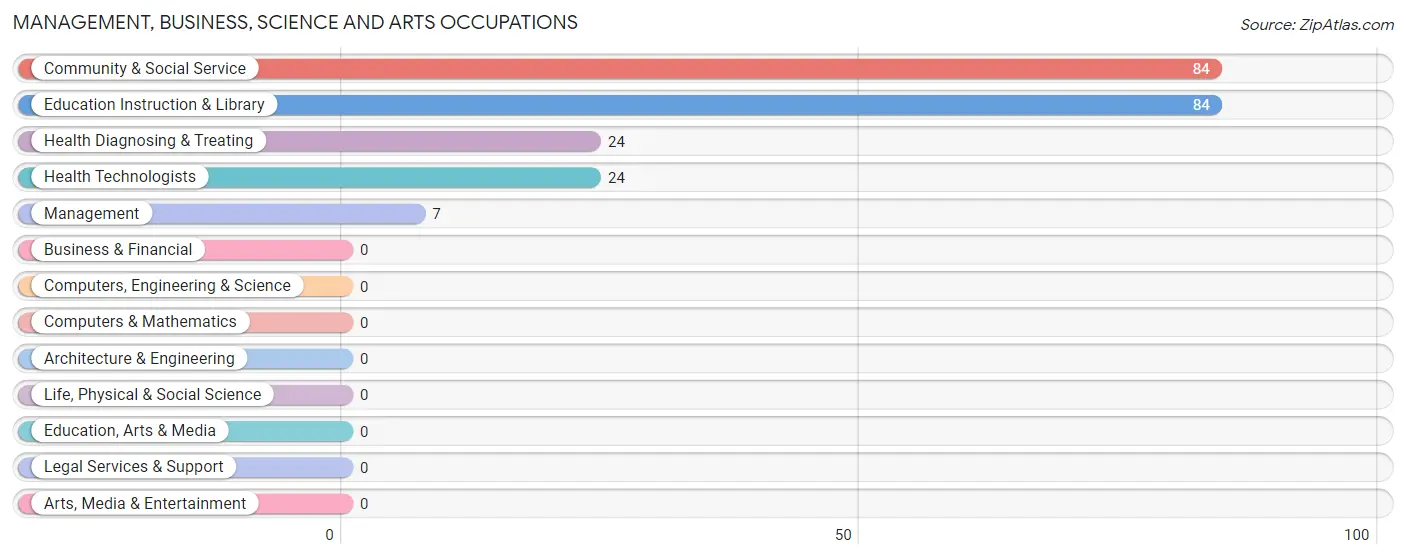
Management, Business, Science and Arts Occupations
The most common Management, Business, Science and Arts occupations in Pine Hill are Community & Social Service (84 | 45.4%), Education Instruction & Library (84 | 45.4%), Health Diagnosing & Treating (24 | 13.0%), Health Technologists (24 | 13.0%), and Management (7 | 3.8%).
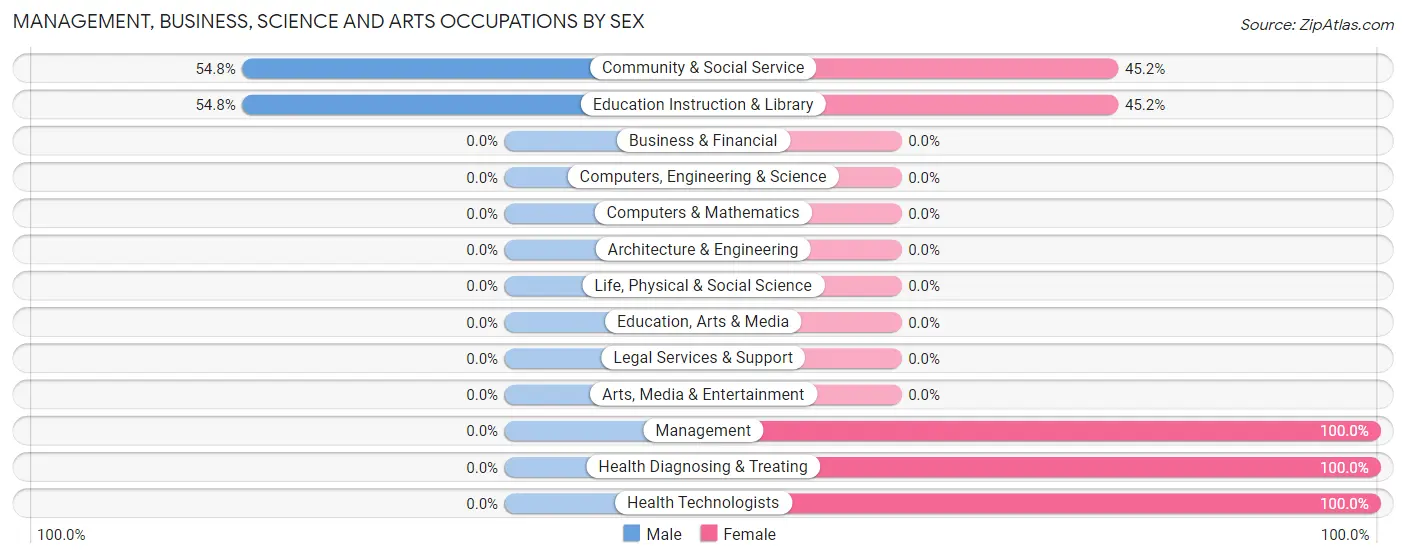
Management, Business, Science and Arts Occupations by Sex
Within the Management, Business, Science and Arts occupations in Pine Hill, the most male-oriented occupations are Community & Social Service (54.8%), and Education Instruction & Library (54.8%), while the most female-oriented occupations are Management (100.0%), Health Diagnosing & Treating (100.0%), and Health Technologists (100.0%).
| Occupation | Male | Female |
| Management | 0 (0.0%) | 7 (100.0%) |
| Business & Financial | 0 (0.0%) | 0 (0.0%) |
| Computers, Engineering & Science | 0 (0.0%) | 0 (0.0%) |
| Computers & Mathematics | 0 (0.0%) | 0 (0.0%) |
| Architecture & Engineering | 0 (0.0%) | 0 (0.0%) |
| Life, Physical & Social Science | 0 (0.0%) | 0 (0.0%) |
| Community & Social Service | 46 (54.8%) | 38 (45.2%) |
| Education, Arts & Media | 0 (0.0%) | 0 (0.0%) |
| Legal Services & Support | 0 (0.0%) | 0 (0.0%) |
| Education Instruction & Library | 46 (54.8%) | 38 (45.2%) |
| Arts, Media & Entertainment | 0 (0.0%) | 0 (0.0%) |
| Health Diagnosing & Treating | 0 (0.0%) | 24 (100.0%) |
| Health Technologists | 0 (0.0%) | 24 (100.0%) |
| Total (Category) | 46 (40.0%) | 69 (60.0%) |
| Total (Overall) | 104 (56.2%) | 81 (43.8%) |
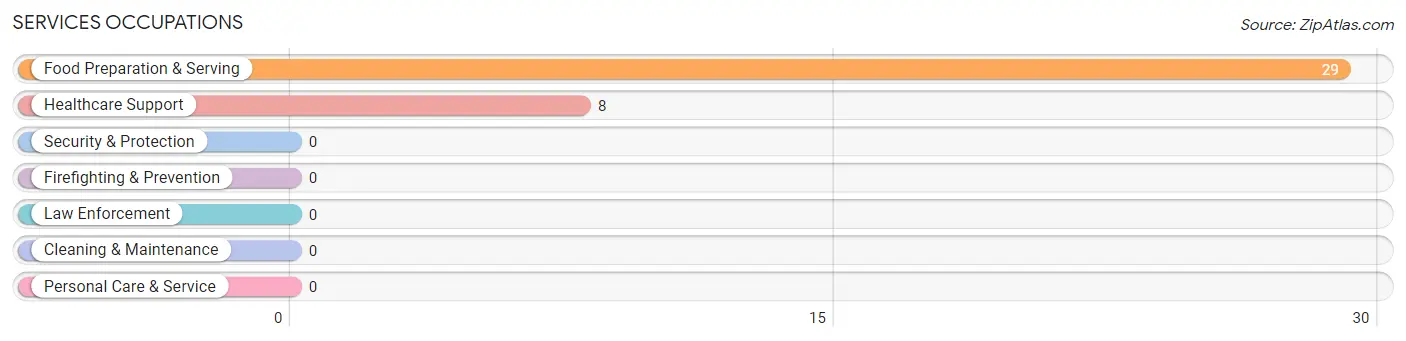
Services Occupations
The most common Services occupations in Pine Hill are Food Preparation & Serving (29 | 15.7%), and Healthcare Support (8 | 4.3%).
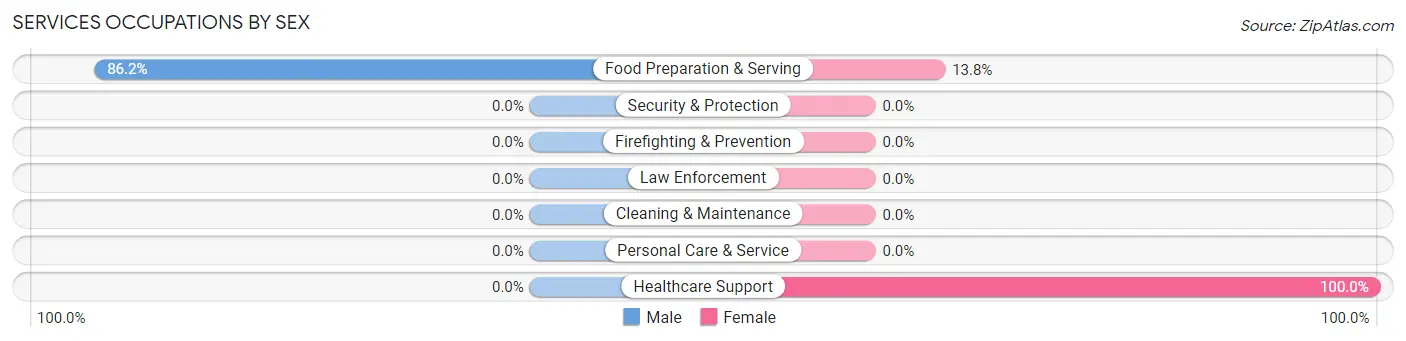
Services Occupations by Sex
| Occupation | Male | Female |
| Healthcare Support | 0 (0.0%) | 8 (100.0%) |
| Security & Protection | 0 (0.0%) | 0 (0.0%) |
| Firefighting & Prevention | 0 (0.0%) | 0 (0.0%) |
| Law Enforcement | 0 (0.0%) | 0 (0.0%) |
| Food Preparation & Serving | 25 (86.2%) | 4 (13.8%) |
| Cleaning & Maintenance | 0 (0.0%) | 0 (0.0%) |
| Personal Care & Service | 0 (0.0%) | 0 (0.0%) |
| Total (Category) | 25 (67.6%) | 12 (32.4%) |
| Total (Overall) | 104 (56.2%) | 81 (43.8%) |
Sales and Office Occupations
The most common Sales and Office occupations in Pine Hill are Office & Administration (7 | 3.8%), and Sales & Related (5 | 2.7%).

Sales and Office Occupations by Sex

| Occupation | Male | Female |
| Sales & Related | 5 (100.0%) | 0 (0.0%) |
| Office & Administration | 7 (100.0%) | 0 (0.0%) |
| Total (Category) | 12 (100.0%) | 0 (0.0%) |
| Total (Overall) | 104 (56.2%) | 81 (43.8%) |
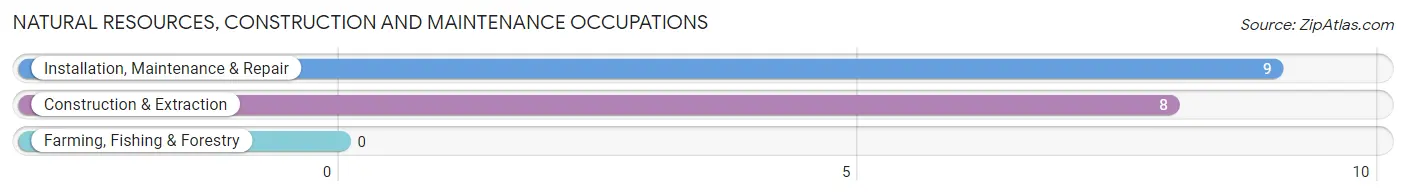
Natural Resources, Construction and Maintenance Occupations
The most common Natural Resources, Construction and Maintenance occupations in Pine Hill are Installation, Maintenance & Repair (9 | 4.9%), and Construction & Extraction (8 | 4.3%).
Natural Resources, Construction and Maintenance Occupations by Sex
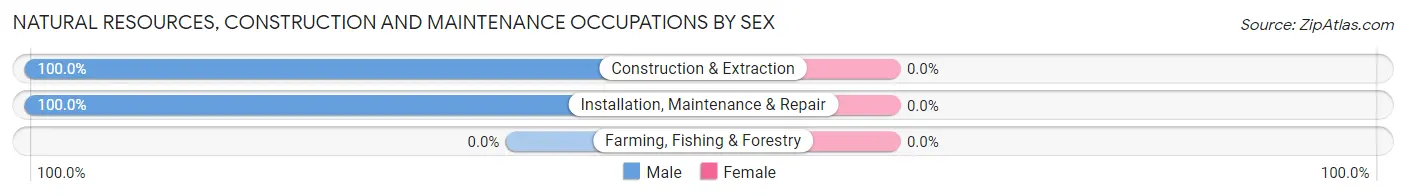
| Occupation | Male | Female |
| Farming, Fishing & Forestry | 0 (0.0%) | 0 (0.0%) |
| Construction & Extraction | 8 (100.0%) | 0 (0.0%) |
| Installation, Maintenance & Repair | 9 (100.0%) | 0 (0.0%) |
| Total (Category) | 17 (100.0%) | 0 (0.0%) |
| Total (Overall) | 104 (56.2%) | 81 (43.8%) |
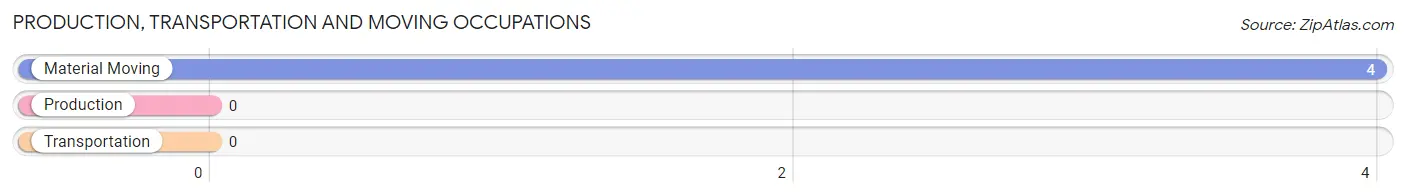
Production, Transportation and Moving Occupations
The most common Production, Transportation and Moving occupations in Pine Hill are , and Material Moving (4 | 2.2%).
Production, Transportation and Moving Occupations by Sex
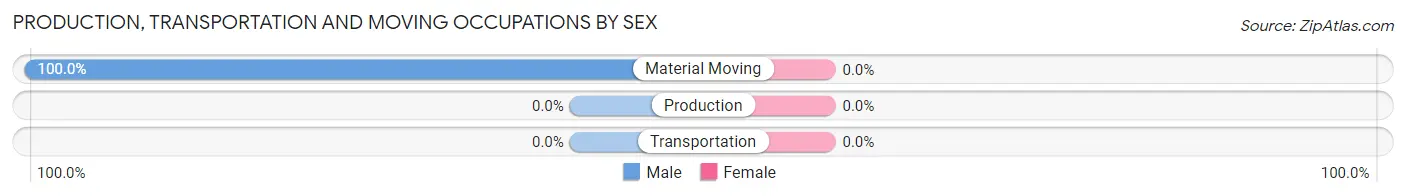
| Occupation | Male | Female |
| Production | 0 (0.0%) | 0 (0.0%) |
| Transportation | 0 (0.0%) | 0 (0.0%) |
| Material Moving | 4 (100.0%) | 0 (0.0%) |
| Total (Category) | 4 (100.0%) | 0 (0.0%) |
| Total (Overall) | 104 (56.2%) | 81 (43.8%) |
Employment Industries by Sex in Pine Hill
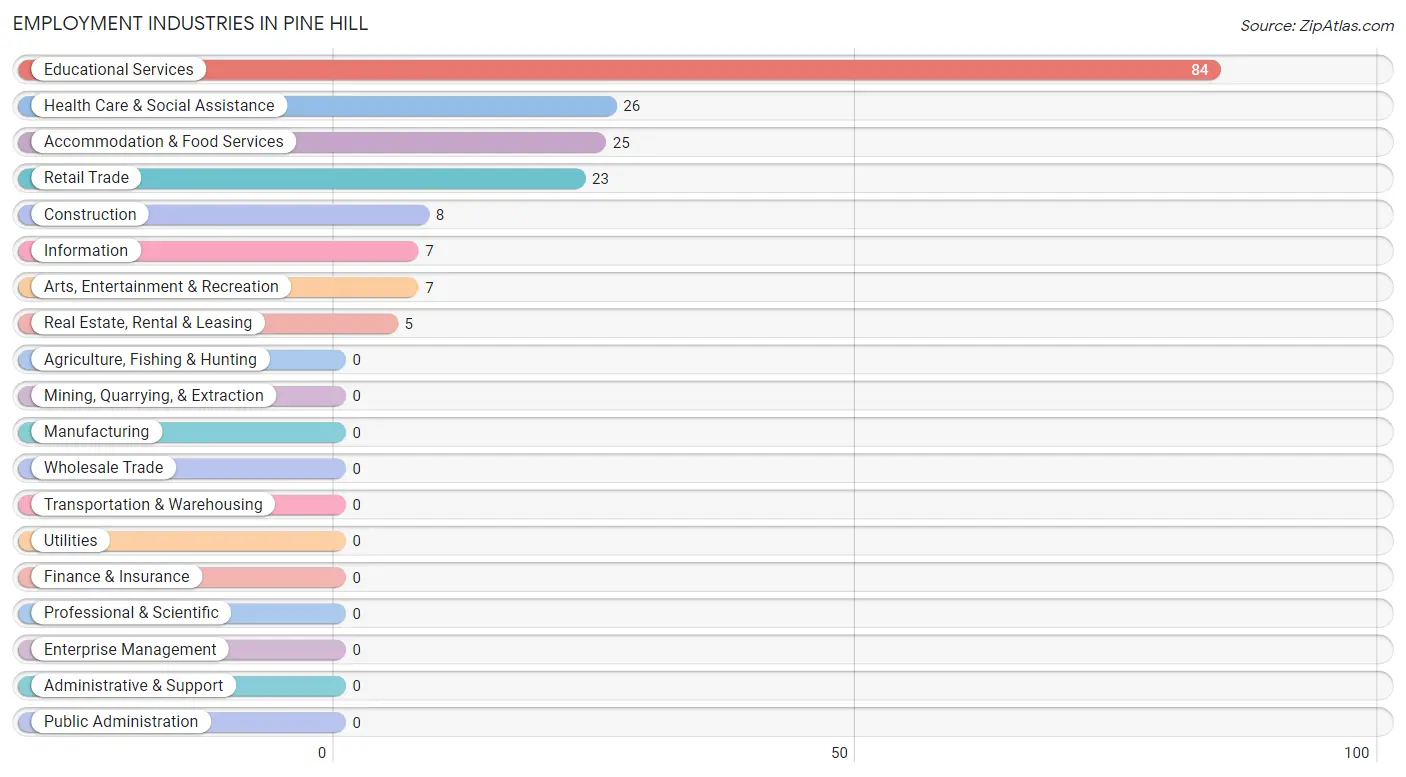
Employment Industries in Pine Hill
The major employment industries in Pine Hill include Educational Services (84 | 45.4%), Health Care & Social Assistance (26 | 14.1%), Accommodation & Food Services (25 | 13.5%), Retail Trade (23 | 12.4%), and Construction (8 | 4.3%).
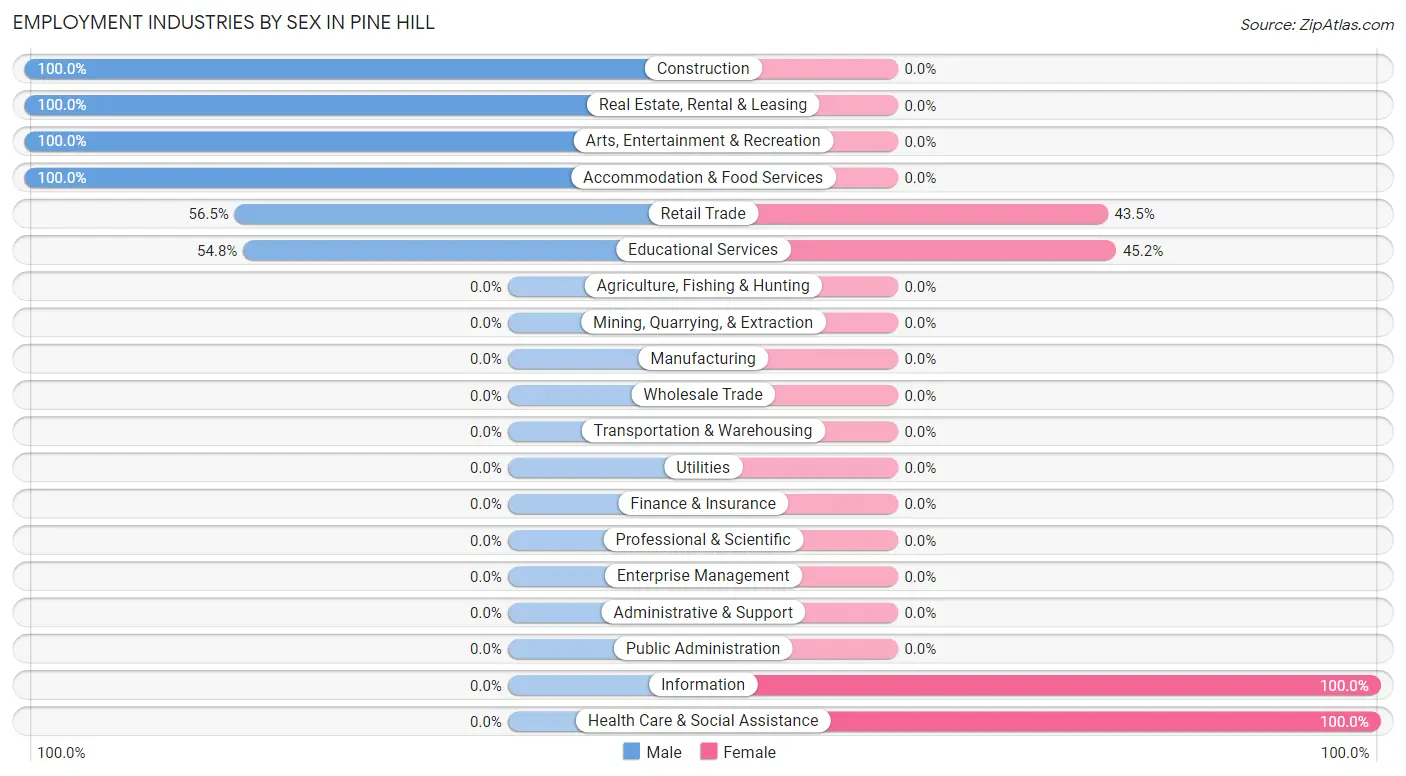
Employment Industries by Sex in Pine Hill
The Pine Hill industries that see more men than women are Construction (100.0%), Real Estate, Rental & Leasing (100.0%), and Arts, Entertainment & Recreation (100.0%), whereas the industries that tend to have a higher number of women are Information (100.0%), Health Care & Social Assistance (100.0%), and Educational Services (45.2%).
| Industry | Male | Female |
| Agriculture, Fishing & Hunting | 0 (0.0%) | 0 (0.0%) |
| Mining, Quarrying, & Extraction | 0 (0.0%) | 0 (0.0%) |
| Construction | 8 (100.0%) | 0 (0.0%) |
| Manufacturing | 0 (0.0%) | 0 (0.0%) |
| Wholesale Trade | 0 (0.0%) | 0 (0.0%) |
| Retail Trade | 13 (56.5%) | 10 (43.5%) |
| Transportation & Warehousing | 0 (0.0%) | 0 (0.0%) |
| Utilities | 0 (0.0%) | 0 (0.0%) |
| Information | 0 (0.0%) | 7 (100.0%) |
| Finance & Insurance | 0 (0.0%) | 0 (0.0%) |
| Real Estate, Rental & Leasing | 5 (100.0%) | 0 (0.0%) |
| Professional & Scientific | 0 (0.0%) | 0 (0.0%) |
| Enterprise Management | 0 (0.0%) | 0 (0.0%) |
| Administrative & Support | 0 (0.0%) | 0 (0.0%) |
| Educational Services | 46 (54.8%) | 38 (45.2%) |
| Health Care & Social Assistance | 0 (0.0%) | 26 (100.0%) |
| Arts, Entertainment & Recreation | 7 (100.0%) | 0 (0.0%) |
| Accommodation & Food Services | 25 (100.0%) | 0 (0.0%) |
| Public Administration | 0 (0.0%) | 0 (0.0%) |
| Total | 104 (56.2%) | 81 (43.8%) |
Education in Pine Hill
School Enrollment in Pine Hill
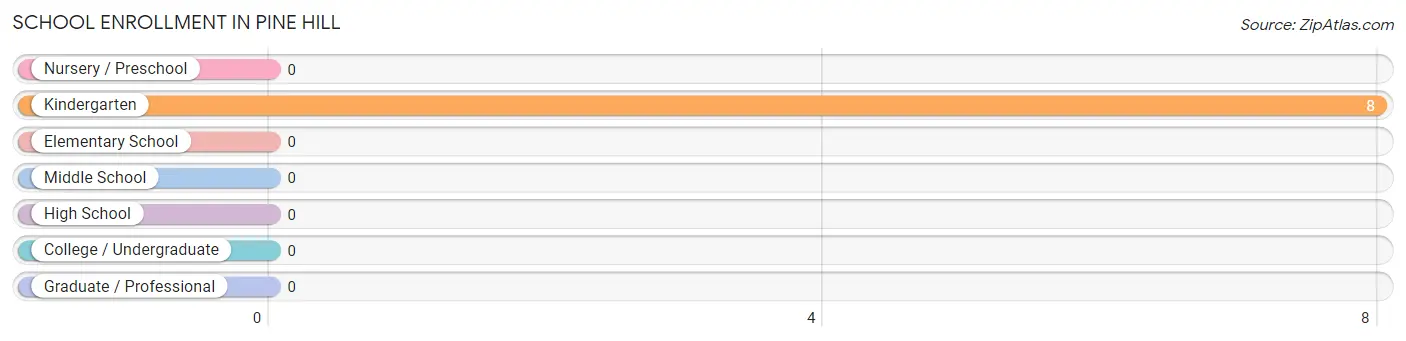
| School Level | # Students | % Students |
| Nursery / Preschool | 0 | 0.0% |
| Kindergarten | 8 | 100.0% |
| Elementary School | 0 | 0.0% |
| Middle School | 0 | 0.0% |
| High School | 0 | 0.0% |
| College / Undergraduate | 0 | 0.0% |
| Graduate / Professional | 0 | 0.0% |
| Total | 8 | 100.0% |
School Enrollment by Age by Funding Source in Pine Hill
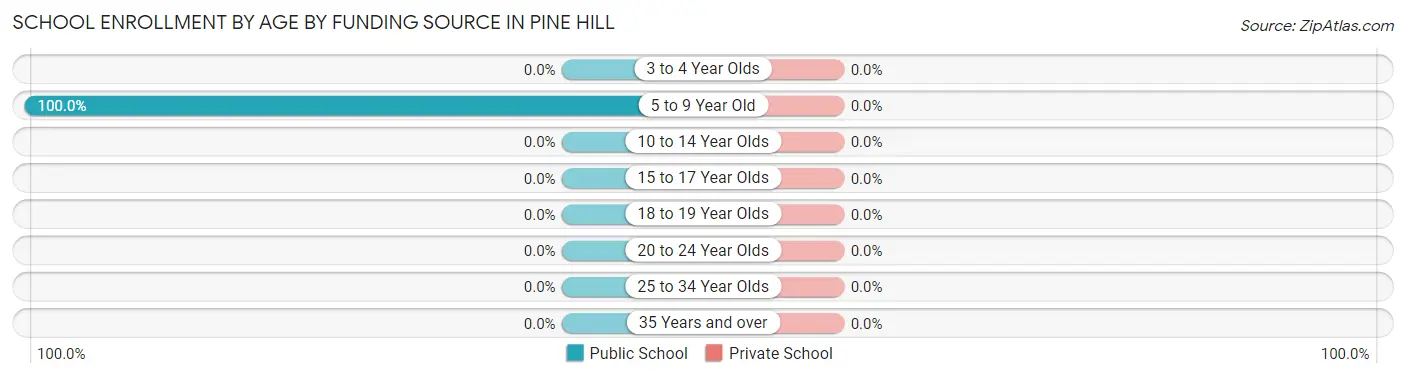
| Age Bracket | Public School | Private School |
| 3 to 4 Year Olds | 0 (0.0%) | 0 (0.0%) |
| 5 to 9 Year Old | 8 (100.0%) | 0 (0.0%) |
| 10 to 14 Year Olds | 0 (0.0%) | 0 (0.0%) |
| 15 to 17 Year Olds | 0 (0.0%) | 0 (0.0%) |
| 18 to 19 Year Olds | 0 (0.0%) | 0 (0.0%) |
| 20 to 24 Year Olds | 0 (0.0%) | 0 (0.0%) |
| 25 to 34 Year Olds | 0 (0.0%) | 0 (0.0%) |
| 35 Years and over | 0 (0.0%) | 0 (0.0%) |
| Total | 8 (100.0%) | 0 (0.0%) |
Educational Attainment by Field of Study in Pine Hill
Engineering (66 | 28.8%), physical & health sciences (46 | 20.1%), education (45 | 19.7%), business (18 | 7.9%), and liberal arts & history (17 | 7.4%) are the most common fields of study among 229 individuals in Pine Hill who have obtained a bachelor's degree or higher.
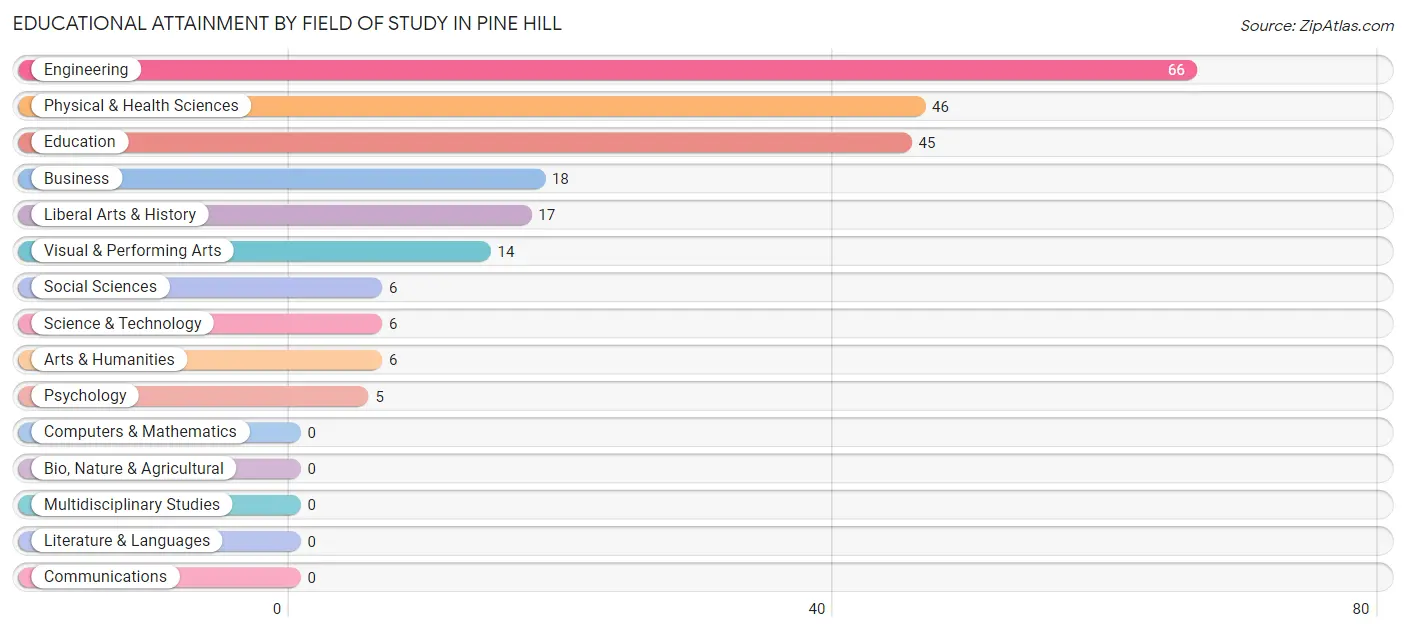
| Field of Study | # Graduates | % Graduates |
| Computers & Mathematics | 0 | 0.0% |
| Bio, Nature & Agricultural | 0 | 0.0% |
| Physical & Health Sciences | 46 | 20.1% |
| Psychology | 5 | 2.2% |
| Social Sciences | 6 | 2.6% |
| Engineering | 66 | 28.8% |
| Multidisciplinary Studies | 0 | 0.0% |
| Science & Technology | 6 | 2.6% |
| Business | 18 | 7.9% |
| Education | 45 | 19.7% |
| Literature & Languages | 0 | 0.0% |
| Liberal Arts & History | 17 | 7.4% |
| Visual & Performing Arts | 14 | 6.1% |
| Communications | 0 | 0.0% |
| Arts & Humanities | 6 | 2.6% |
| Total | 229 | 100.0% |
Transportation & Commute in Pine Hill
Vehicle Availability by Sex in Pine Hill
The most prevalent vehicle ownership categories in Pine Hill are males with 1 vehicle (91, accounting for 87.5%) and females with 1 vehicle (57, making up 112.3%).
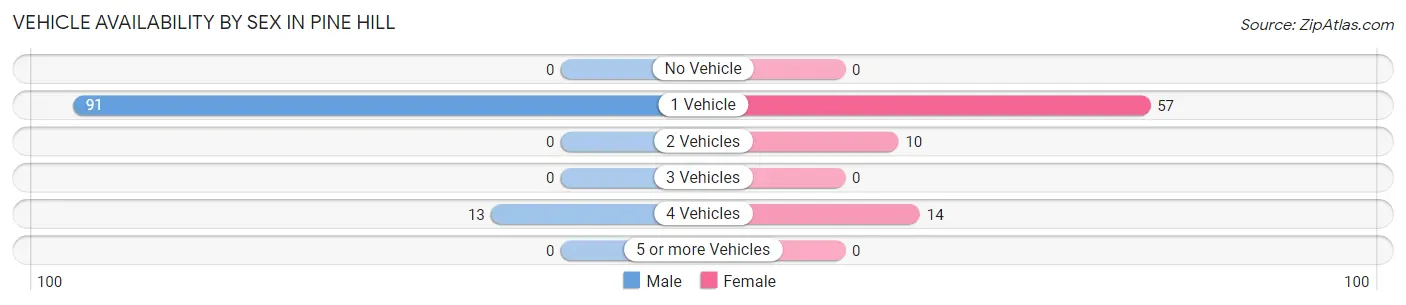
| Vehicles Available | Male | Female |
| No Vehicle | 0 (0.0%) | 0 (0.0%) |
| 1 Vehicle | 91 (87.5%) | 57 (70.4%) |
| 2 Vehicles | 0 (0.0%) | 10 (12.3%) |
| 3 Vehicles | 0 (0.0%) | 0 (0.0%) |
| 4 Vehicles | 13 (12.5%) | 14 (17.3%) |
| 5 or more Vehicles | 0 (0.0%) | 0 (0.0%) |
| Total | 104 (100.0%) | 81 (100.0%) |
Commute Time in Pine Hill
The most frequently occuring commute durations in Pine Hill are 15 to 19 minutes (49 commuters, 36.8%), 10 to 14 minutes (40 commuters, 30.1%), and 90 or more minutes (22 commuters, 16.5%).
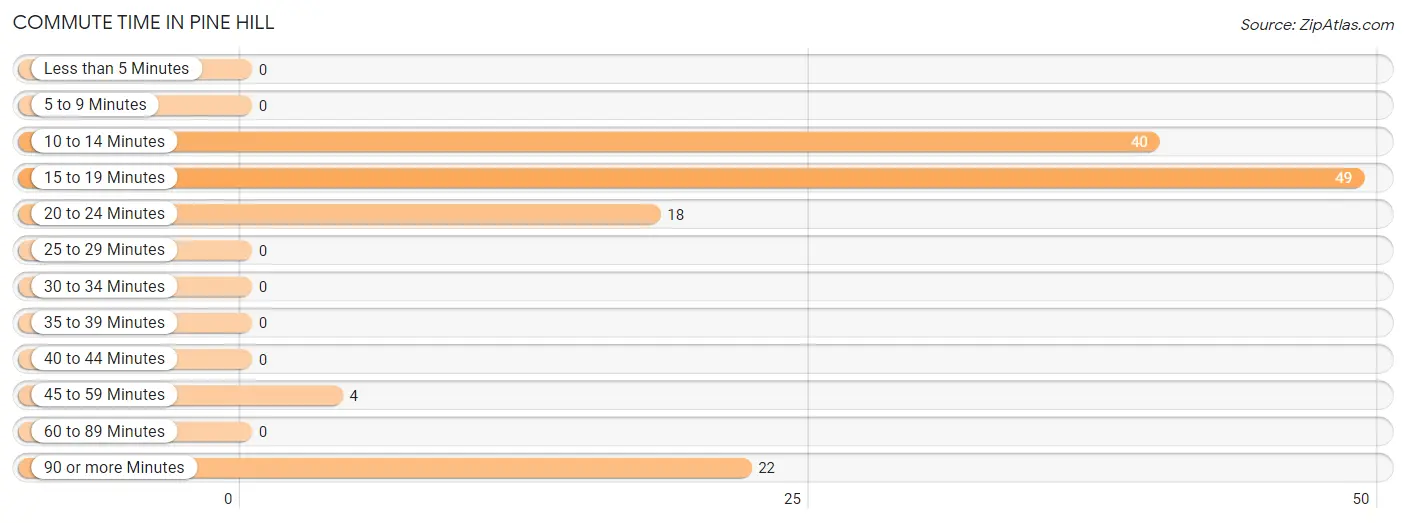
| Commute Time | # Commuters | % Commuters |
| Less than 5 Minutes | 0 | 0.0% |
| 5 to 9 Minutes | 0 | 0.0% |
| 10 to 14 Minutes | 40 | 30.1% |
| 15 to 19 Minutes | 49 | 36.8% |
| 20 to 24 Minutes | 18 | 13.5% |
| 25 to 29 Minutes | 0 | 0.0% |
| 30 to 34 Minutes | 0 | 0.0% |
| 35 to 39 Minutes | 0 | 0.0% |
| 40 to 44 Minutes | 0 | 0.0% |
| 45 to 59 Minutes | 4 | 3.0% |
| 60 to 89 Minutes | 0 | 0.0% |
| 90 or more Minutes | 22 | 16.5% |
Commute Time by Sex in Pine Hill
The most common commute times in Pine Hill are 10 to 14 minutes (34 commuters, 58.6%) for males and 15 to 19 minutes (40 commuters, 53.3%) for females.
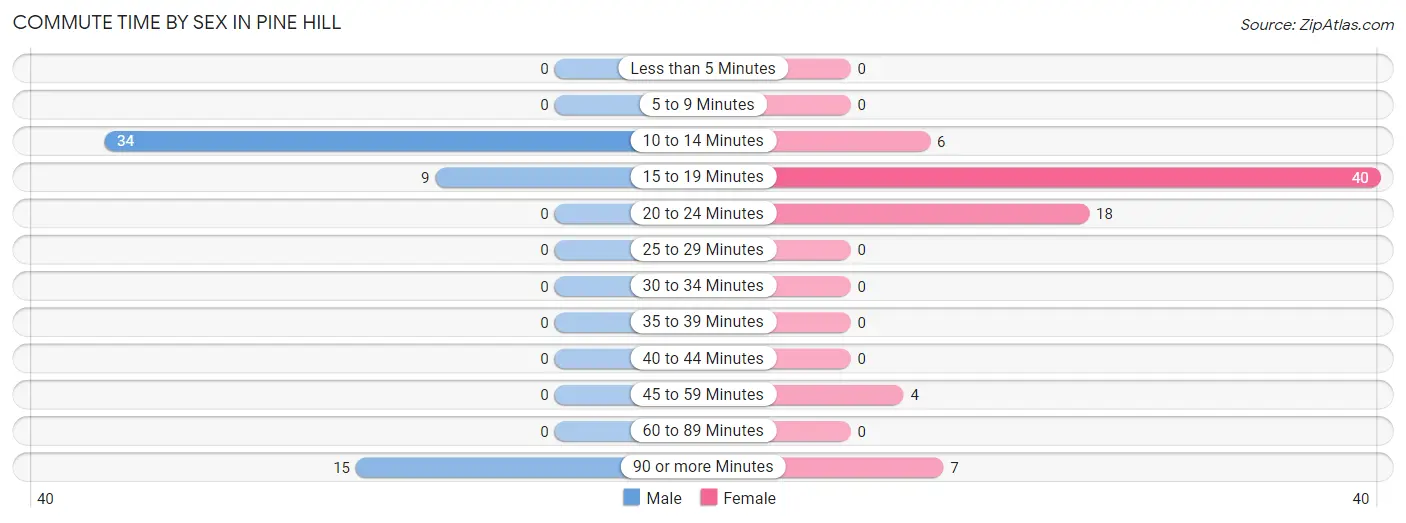
| Commute Time | Male | Female |
| Less than 5 Minutes | 0 (0.0%) | 0 (0.0%) |
| 5 to 9 Minutes | 0 (0.0%) | 0 (0.0%) |
| 10 to 14 Minutes | 34 (58.6%) | 6 (8.0%) |
| 15 to 19 Minutes | 9 (15.5%) | 40 (53.3%) |
| 20 to 24 Minutes | 0 (0.0%) | 18 (24.0%) |
| 25 to 29 Minutes | 0 (0.0%) | 0 (0.0%) |
| 30 to 34 Minutes | 0 (0.0%) | 0 (0.0%) |
| 35 to 39 Minutes | 0 (0.0%) | 0 (0.0%) |
| 40 to 44 Minutes | 0 (0.0%) | 0 (0.0%) |
| 45 to 59 Minutes | 0 (0.0%) | 4 (5.3%) |
| 60 to 89 Minutes | 0 (0.0%) | 0 (0.0%) |
| 90 or more Minutes | 15 (25.9%) | 7 (9.3%) |
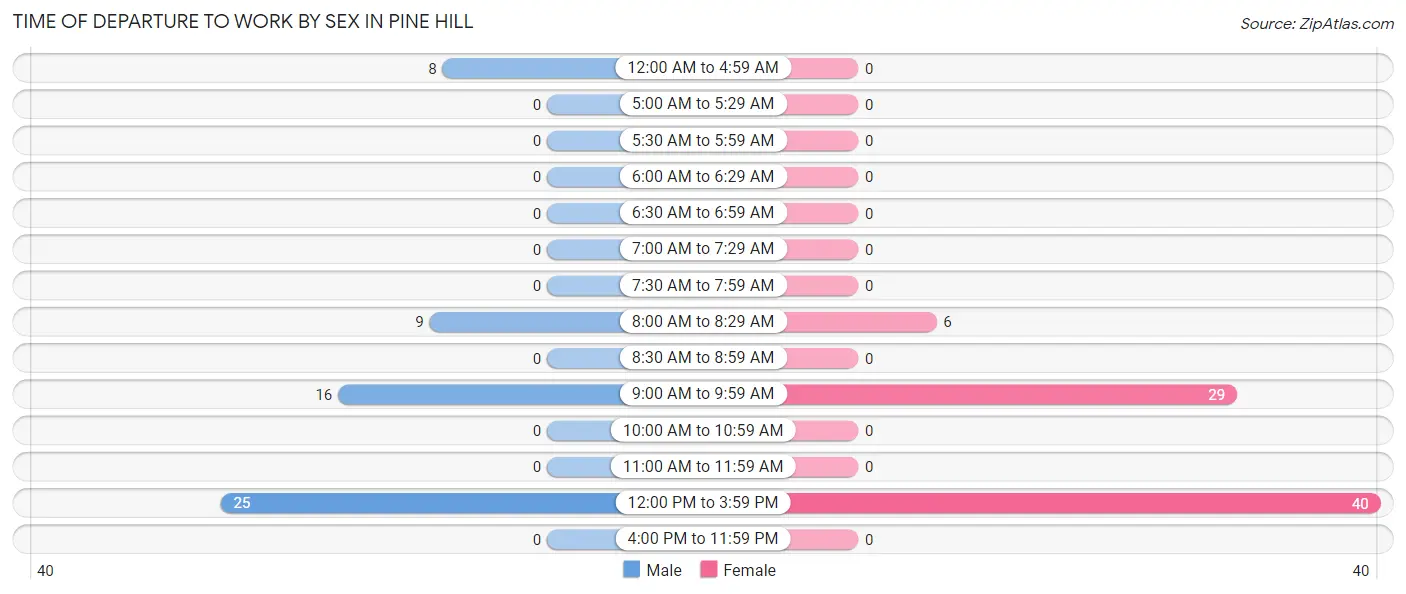
Time of Departure to Work by Sex in Pine Hill
The most frequent times of departure to work in Pine Hill are 12:00 PM to 3:59 PM (25, 43.1%) for males and 12:00 PM to 3:59 PM (40, 53.3%) for females.
| Time of Departure | Male | Female |
| 12:00 AM to 4:59 AM | 8 (13.8%) | 0 (0.0%) |
| 5:00 AM to 5:29 AM | 0 (0.0%) | 0 (0.0%) |
| 5:30 AM to 5:59 AM | 0 (0.0%) | 0 (0.0%) |
| 6:00 AM to 6:29 AM | 0 (0.0%) | 0 (0.0%) |
| 6:30 AM to 6:59 AM | 0 (0.0%) | 0 (0.0%) |
| 7:00 AM to 7:29 AM | 0 (0.0%) | 0 (0.0%) |
| 7:30 AM to 7:59 AM | 0 (0.0%) | 0 (0.0%) |
| 8:00 AM to 8:29 AM | 9 (15.5%) | 6 (8.0%) |
| 8:30 AM to 8:59 AM | 0 (0.0%) | 0 (0.0%) |
| 9:00 AM to 9:59 AM | 16 (27.6%) | 29 (38.7%) |
| 10:00 AM to 10:59 AM | 0 (0.0%) | 0 (0.0%) |
| 11:00 AM to 11:59 AM | 0 (0.0%) | 0 (0.0%) |
| 12:00 PM to 3:59 PM | 25 (43.1%) | 40 (53.3%) |
| 4:00 PM to 11:59 PM | 0 (0.0%) | 0 (0.0%) |
| Total | 58 (100.0%) | 75 (100.0%) |
Housing Occupancy in Pine Hill
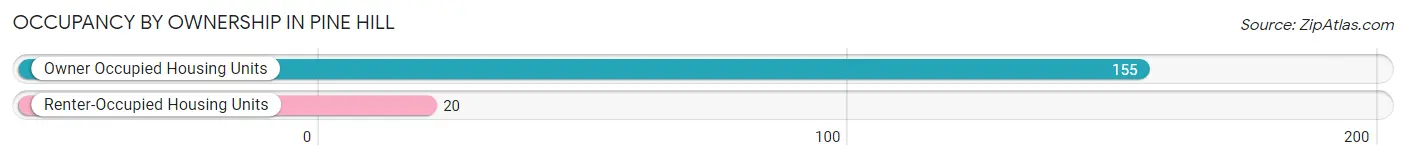
Occupancy by Ownership in Pine Hill
Of the total 175 dwellings in Pine Hill, owner-occupied units account for 155 (88.6%), while renter-occupied units make up 20 (11.4%).
| Occupancy | # Housing Units | % Housing Units |
| Owner Occupied Housing Units | 155 | 88.6% |
| Renter-Occupied Housing Units | 20 | 11.4% |
| Total Occupied Housing Units | 175 | 100.0% |
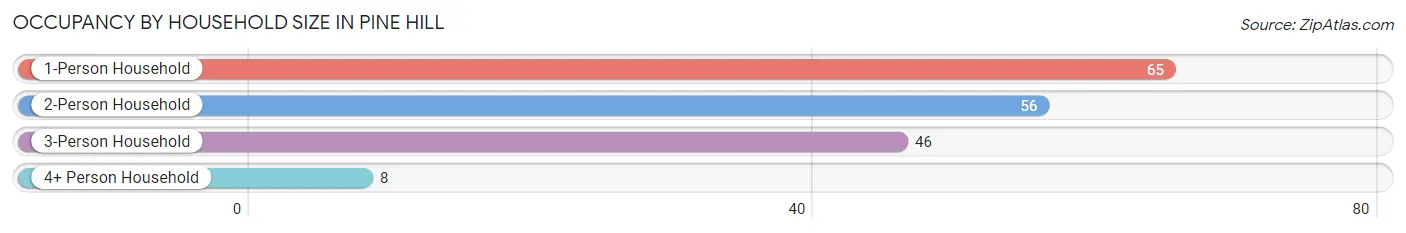
Occupancy by Household Size in Pine Hill
| Household Size | # Housing Units | % Housing Units |
| 1-Person Household | 65 | 37.1% |
| 2-Person Household | 56 | 32.0% |
| 3-Person Household | 46 | 26.3% |
| 4+ Person Household | 8 | 4.6% |
| Total Housing Units | 175 | 100.0% |
Occupancy by Ownership by Household Size in Pine Hill
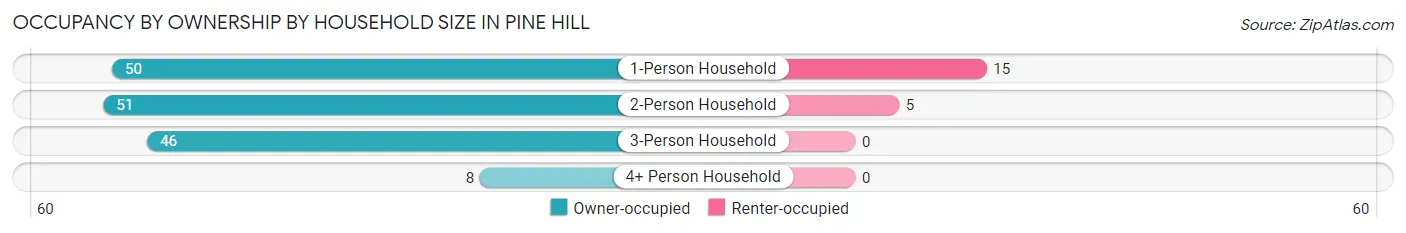
| Household Size | Owner-occupied | Renter-occupied |
| 1-Person Household | 50 (76.9%) | 15 (23.1%) |
| 2-Person Household | 51 (91.1%) | 5 (8.9%) |
| 3-Person Household | 46 (100.0%) | 0 (0.0%) |
| 4+ Person Household | 8 (100.0%) | 0 (0.0%) |
| Total Housing Units | 155 (88.6%) | 20 (11.4%) |
Occupancy by Educational Attainment in Pine Hill
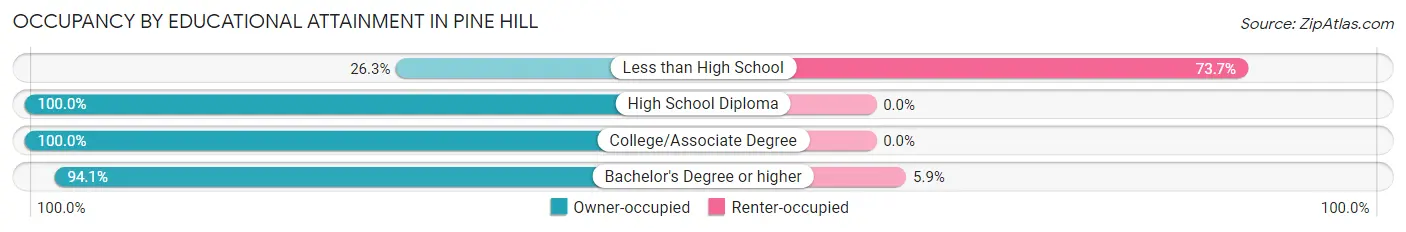
| Household Size | Owner-occupied | Renter-occupied |
| Less than High School | 5 (26.3%) | 14 (73.7%) |
| High School Diploma | 14 (100.0%) | 0 (0.0%) |
| College/Associate Degree | 41 (100.0%) | 0 (0.0%) |
| Bachelor's Degree or higher | 95 (94.1%) | 6 (5.9%) |
Occupancy by Age of Householder in Pine Hill
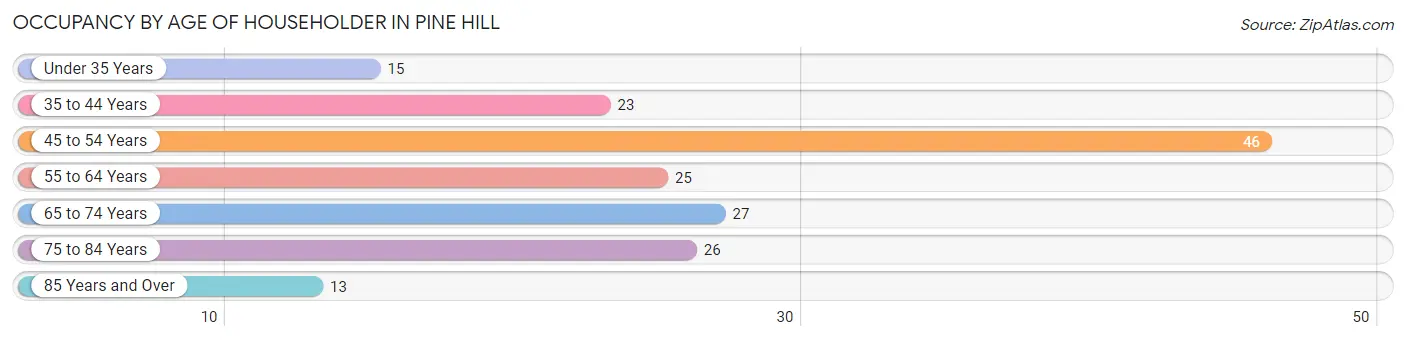
| Age Bracket | # Households | % Households |
| Under 35 Years | 15 | 8.6% |
| 35 to 44 Years | 23 | 13.1% |
| 45 to 54 Years | 46 | 26.3% |
| 55 to 64 Years | 25 | 14.3% |
| 65 to 74 Years | 27 | 15.4% |
| 75 to 84 Years | 26 | 14.9% |
| 85 Years and Over | 13 | 7.4% |
| Total | 175 | 100.0% |
Housing Finances in Pine Hill
Median Income by Occupancy in Pine Hill
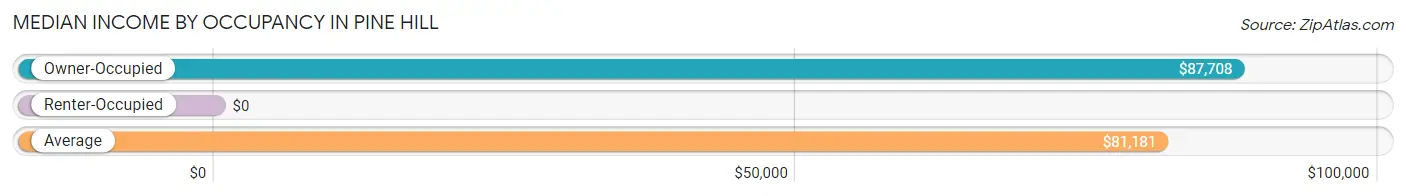
| Occupancy Type | # Households | Median Income |
| Owner-Occupied | 155 (88.6%) | $87,708 |
| Renter-Occupied | 20 (11.4%) | $0 |
| Average | 175 (100.0%) | $81,181 |
Occupancy by Householder Income Bracket in Pine Hill
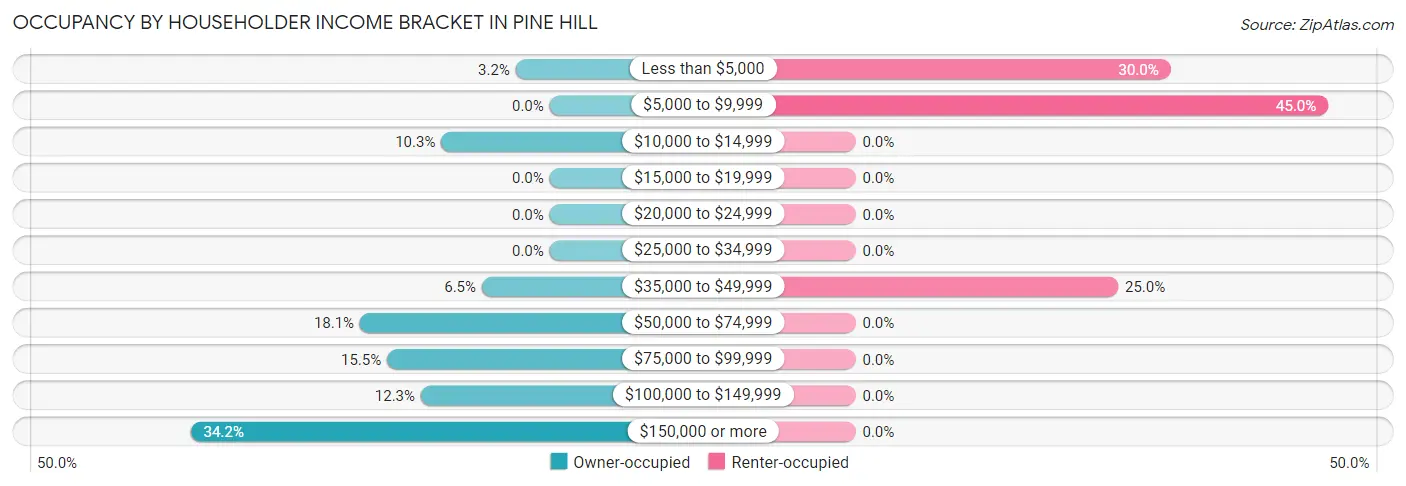
| Income Bracket | Owner-occupied | Renter-occupied |
| Less than $5,000 | 5 (3.2%) | 6 (30.0%) |
| $5,000 to $9,999 | 0 (0.0%) | 9 (45.0%) |
| $10,000 to $14,999 | 16 (10.3%) | 0 (0.0%) |
| $15,000 to $19,999 | 0 (0.0%) | 0 (0.0%) |
| $20,000 to $24,999 | 0 (0.0%) | 0 (0.0%) |
| $25,000 to $34,999 | 0 (0.0%) | 0 (0.0%) |
| $35,000 to $49,999 | 10 (6.5%) | 5 (25.0%) |
| $50,000 to $74,999 | 28 (18.1%) | 0 (0.0%) |
| $75,000 to $99,999 | 24 (15.5%) | 0 (0.0%) |
| $100,000 to $149,999 | 19 (12.3%) | 0 (0.0%) |
| $150,000 or more | 53 (34.2%) | 0 (0.0%) |
| Total | 155 (100.0%) | 20 (100.0%) |
Monthly Housing Cost Tiers in Pine Hill
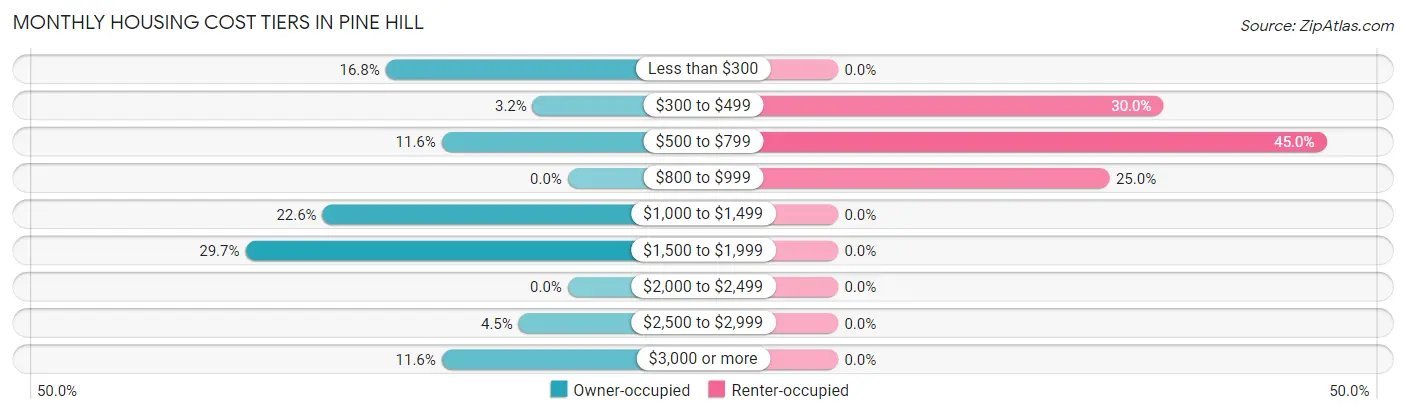
| Monthly Cost | Owner-occupied | Renter-occupied |
| Less than $300 | 26 (16.8%) | 0 (0.0%) |
| $300 to $499 | 5 (3.2%) | 6 (30.0%) |
| $500 to $799 | 18 (11.6%) | 9 (45.0%) |
| $800 to $999 | 0 (0.0%) | 5 (25.0%) |
| $1,000 to $1,499 | 35 (22.6%) | 0 (0.0%) |
| $1,500 to $1,999 | 46 (29.7%) | 0 (0.0%) |
| $2,000 to $2,499 | 0 (0.0%) | 0 (0.0%) |
| $2,500 to $2,999 | 7 (4.5%) | 0 (0.0%) |
| $3,000 or more | 18 (11.6%) | 0 (0.0%) |
| Total | 155 (100.0%) | 20 (100.0%) |
Physical Housing Characteristics in Pine Hill
Housing Structures in Pine Hill
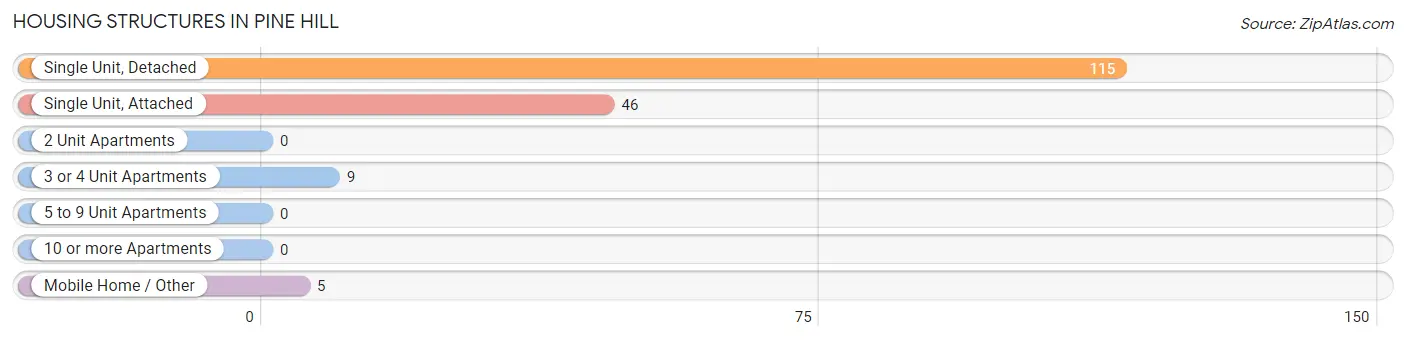
| Structure Type | # Housing Units | % Housing Units |
| Single Unit, Detached | 115 | 65.7% |
| Single Unit, Attached | 46 | 26.3% |
| 2 Unit Apartments | 0 | 0.0% |
| 3 or 4 Unit Apartments | 9 | 5.1% |
| 5 to 9 Unit Apartments | 0 | 0.0% |
| 10 or more Apartments | 0 | 0.0% |
| Mobile Home / Other | 5 | 2.9% |
| Total | 175 | 100.0% |
Housing Structures by Occupancy in Pine Hill
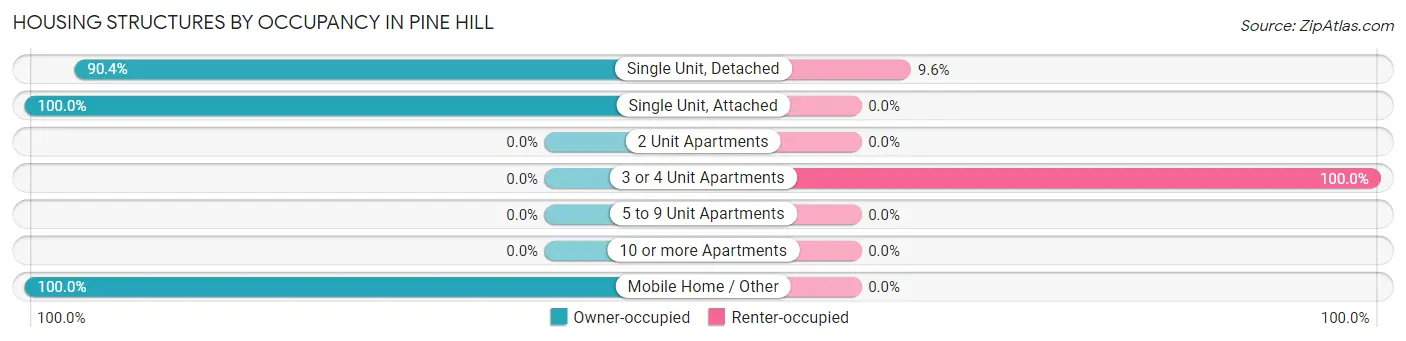
| Structure Type | Owner-occupied | Renter-occupied |
| Single Unit, Detached | 104 (90.4%) | 11 (9.6%) |
| Single Unit, Attached | 46 (100.0%) | 0 (0.0%) |
| 2 Unit Apartments | 0 (0.0%) | 0 (0.0%) |
| 3 or 4 Unit Apartments | 0 (0.0%) | 9 (100.0%) |
| 5 to 9 Unit Apartments | 0 (0.0%) | 0 (0.0%) |
| 10 or more Apartments | 0 (0.0%) | 0 (0.0%) |
| Mobile Home / Other | 5 (100.0%) | 0 (0.0%) |
| Total | 155 (88.6%) | 20 (11.4%) |
Housing Structures by Number of Rooms in Pine Hill
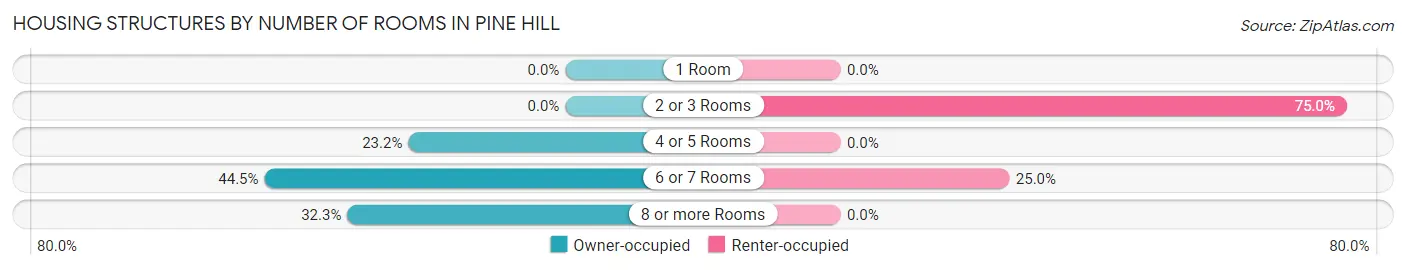
| Number of Rooms | Owner-occupied | Renter-occupied |
| 1 Room | 0 (0.0%) | 0 (0.0%) |
| 2 or 3 Rooms | 0 (0.0%) | 15 (75.0%) |
| 4 or 5 Rooms | 36 (23.2%) | 0 (0.0%) |
| 6 or 7 Rooms | 69 (44.5%) | 5 (25.0%) |
| 8 or more Rooms | 50 (32.3%) | 0 (0.0%) |
| Total | 155 (100.0%) | 20 (100.0%) |
Housing Structure by Heating Type in Pine Hill
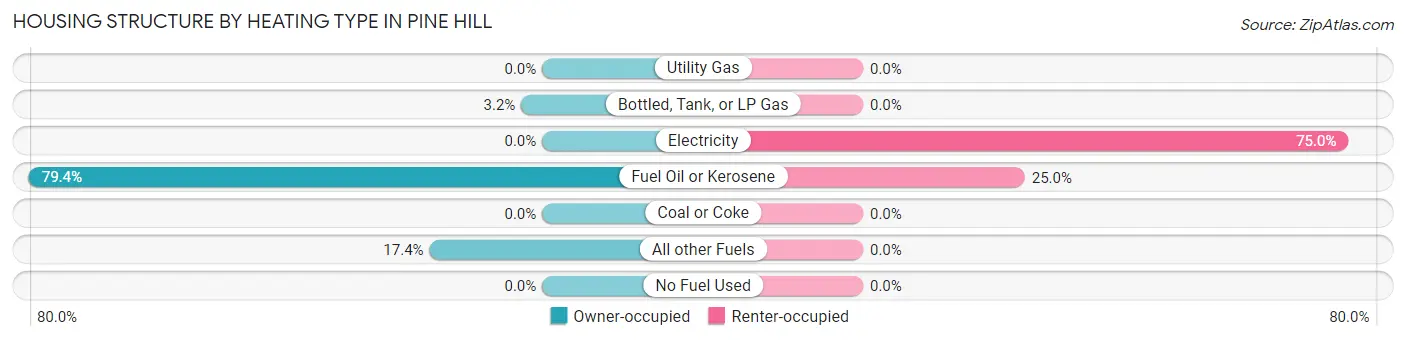
| Heating Type | Owner-occupied | Renter-occupied |
| Utility Gas | 0 (0.0%) | 0 (0.0%) |
| Bottled, Tank, or LP Gas | 5 (3.2%) | 0 (0.0%) |
| Electricity | 0 (0.0%) | 15 (75.0%) |
| Fuel Oil or Kerosene | 123 (79.3%) | 5 (25.0%) |
| Coal or Coke | 0 (0.0%) | 0 (0.0%) |
| All other Fuels | 27 (17.4%) | 0 (0.0%) |
| No Fuel Used | 0 (0.0%) | 0 (0.0%) |
| Total | 155 (100.0%) | 20 (100.0%) |
Household Vehicle Usage in Pine Hill
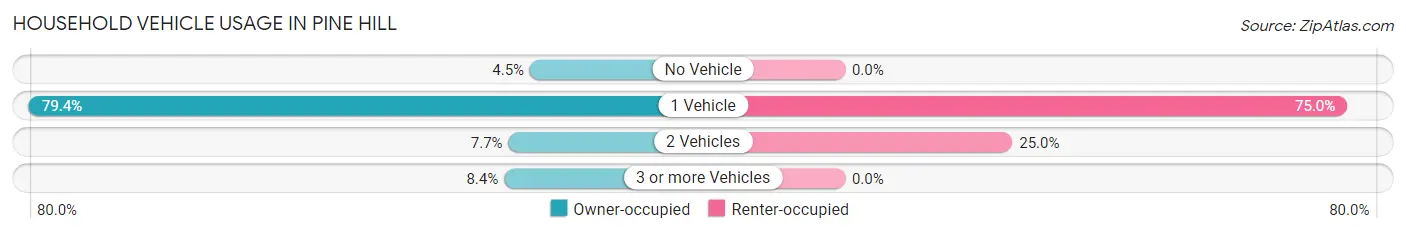
| Vehicles per Household | Owner-occupied | Renter-occupied |
| No Vehicle | 7 (4.5%) | 0 (0.0%) |
| 1 Vehicle | 123 (79.3%) | 15 (75.0%) |
| 2 Vehicles | 12 (7.7%) | 5 (25.0%) |
| 3 or more Vehicles | 13 (8.4%) | 0 (0.0%) |
| Total | 155 (100.0%) | 20 (100.0%) |
Real Estate & Mortgages in Pine Hill
Real Estate and Mortgage Overview in Pine Hill
| Characteristic | Without Mortgage | With Mortgage |
| Housing Units | 116 | 39 |
| Median Property Value | $319,600 | $555,000 |
| Median Household Income | - | - |
| Monthly Housing Costs | $1,243 | $18 |
| Real Estate Taxes | - | - |
Property Value by Mortgage Status in Pine Hill
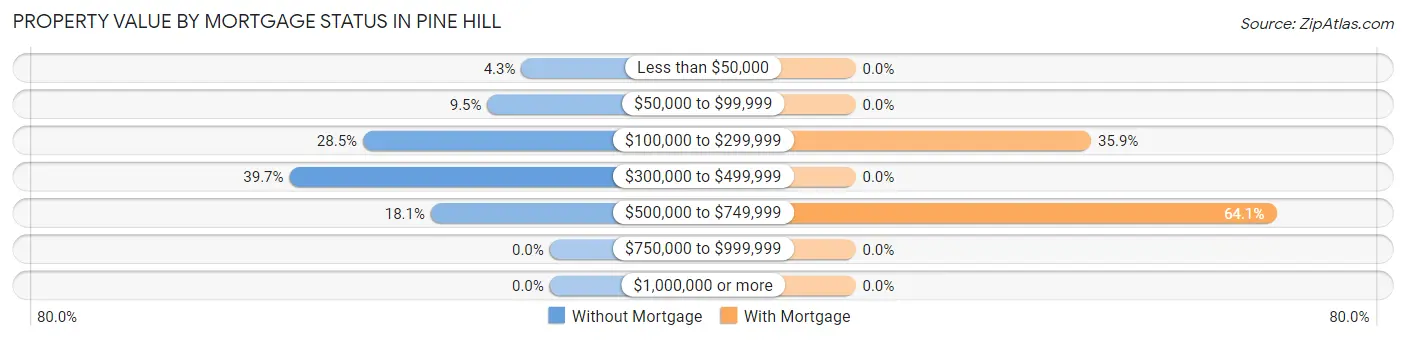
| Property Value | Without Mortgage | With Mortgage |
| Less than $50,000 | 5 (4.3%) | 0 (0.0%) |
| $50,000 to $99,999 | 11 (9.5%) | 0 (0.0%) |
| $100,000 to $299,999 | 33 (28.4%) | 14 (35.9%) |
| $300,000 to $499,999 | 46 (39.7%) | 0 (0.0%) |
| $500,000 to $749,999 | 21 (18.1%) | 25 (64.1%) |
| $750,000 to $999,999 | 0 (0.0%) | 0 (0.0%) |
| $1,000,000 or more | 0 (0.0%) | 0 (0.0%) |
| Total | 116 (100.0%) | 39 (100.0%) |
Household Income by Mortgage Status in Pine Hill
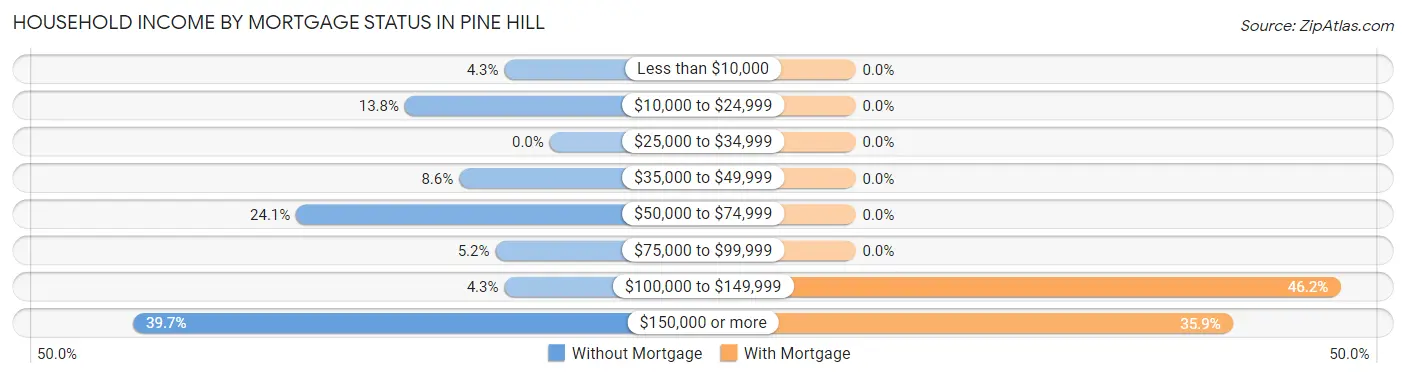
| Household Income | Without Mortgage | With Mortgage |
| Less than $10,000 | 5 (4.3%) | 0 (0.0%) |
| $10,000 to $24,999 | 16 (13.8%) | 0 (0.0%) |
| $25,000 to $34,999 | 0 (0.0%) | 0 (0.0%) |
| $35,000 to $49,999 | 10 (8.6%) | 0 (0.0%) |
| $50,000 to $74,999 | 28 (24.1%) | 0 (0.0%) |
| $75,000 to $99,999 | 6 (5.2%) | 0 (0.0%) |
| $100,000 to $149,999 | 5 (4.3%) | 18 (46.2%) |
| $150,000 or more | 46 (39.7%) | 14 (35.9%) |
| Total | 116 (100.0%) | 39 (100.0%) |
Property Value to Household Income Ratio in Pine Hill
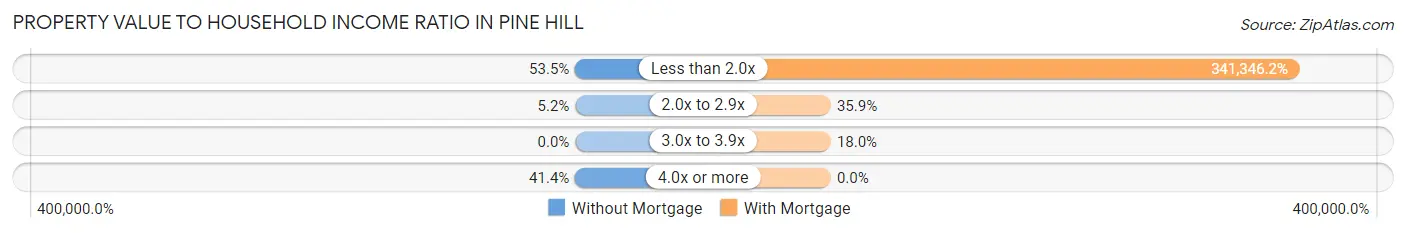
| Value-to-Income Ratio | Without Mortgage | With Mortgage |
| Less than 2.0x | 62 (53.4%) | 133,125 (341,346.1%) |
| 2.0x to 2.9x | 6 (5.2%) | 14 (35.9%) |
| 3.0x to 3.9x | 0 (0.0%) | 7 (17.9%) |
| 4.0x or more | 48 (41.4%) | 0 (0.0%) |
| Total | 116 (100.0%) | 39 (100.0%) |
Real Estate Taxes by Mortgage Status in Pine Hill
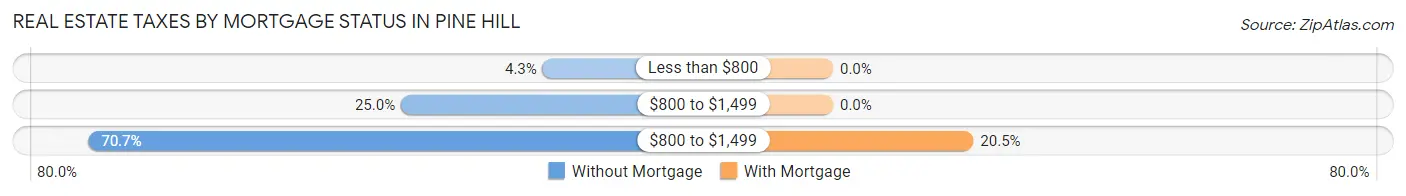
| Property Taxes | Without Mortgage | With Mortgage |
| Less than $800 | 5 (4.3%) | 0 (0.0%) |
| $800 to $1,499 | 29 (25.0%) | 0 (0.0%) |
| $800 to $1,499 | 82 (70.7%) | 8 (20.5%) |
| Total | 116 (100.0%) | 39 (100.0%) |
Health & Disability in Pine Hill
Health Insurance Coverage by Age in Pine Hill
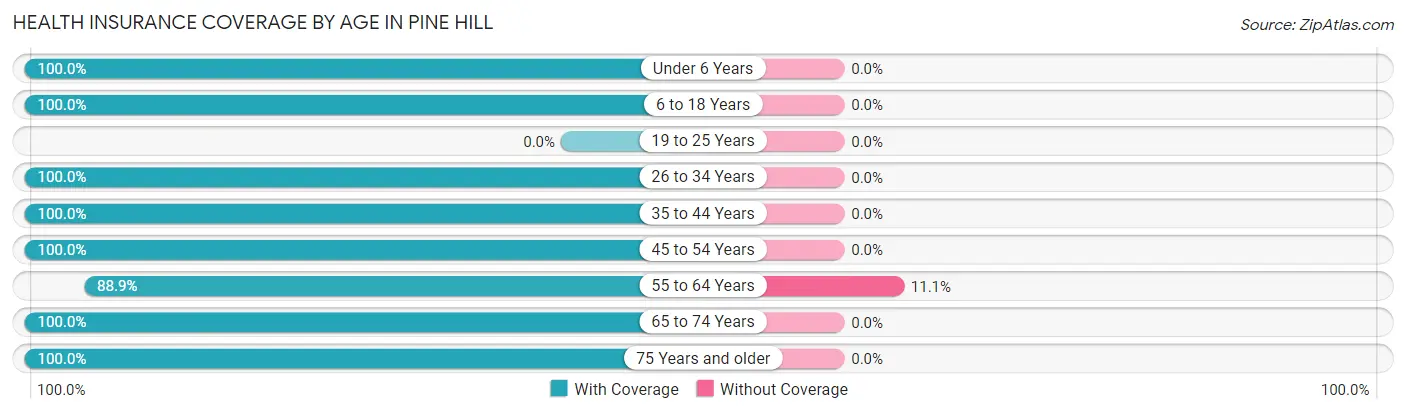
| Age Bracket | With Coverage | Without Coverage |
| Under 6 Years | 10 (100.0%) | 0 (0.0%) |
| 6 to 18 Years | 8 (100.0%) | 0 (0.0%) |
| 19 to 25 Years | 0 (0.0%) | 0 (0.0%) |
| 26 to 34 Years | 93 (100.0%) | 0 (0.0%) |
| 35 to 44 Years | 23 (100.0%) | 0 (0.0%) |
| 45 to 54 Years | 46 (100.0%) | 0 (0.0%) |
| 55 to 64 Years | 32 (88.9%) | 4 (11.1%) |
| 65 to 74 Years | 39 (100.0%) | 0 (0.0%) |
| 75 Years and older | 105 (100.0%) | 0 (0.0%) |
| Total | 356 (98.9%) | 4 (1.1%) |
Health Insurance Coverage by Citizenship Status in Pine Hill

| Citizenship Status | With Coverage | Without Coverage |
| Native Born | 10 (100.0%) | 0 (0.0%) |
| Foreign Born, Citizen | 8 (100.0%) | 0 (0.0%) |
| Foreign Born, not a Citizen | 0 (0.0%) | 0 (0.0%) |
Health Insurance Coverage by Household Income in Pine Hill
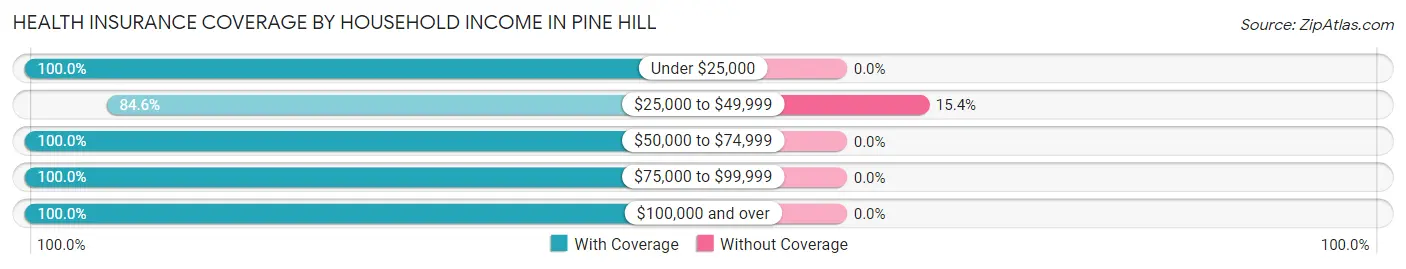
| Household Income | With Coverage | Without Coverage |
| Under $25,000 | 36 (100.0%) | 0 (0.0%) |
| $25,000 to $49,999 | 22 (84.6%) | 4 (15.4%) |
| $50,000 to $74,999 | 53 (100.0%) | 0 (0.0%) |
| $75,000 to $99,999 | 31 (100.0%) | 0 (0.0%) |
| $100,000 and over | 214 (100.0%) | 0 (0.0%) |
Public vs Private Health Insurance Coverage by Age in Pine Hill
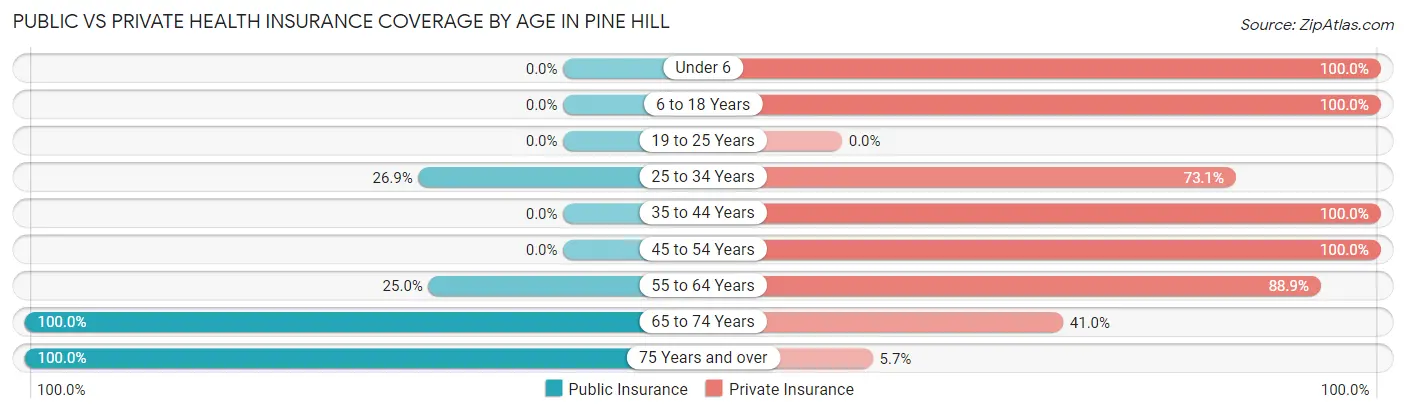
| Age Bracket | Public Insurance | Private Insurance |
| Under 6 | 0 (0.0%) | 10 (100.0%) |
| 6 to 18 Years | 0 (0.0%) | 8 (100.0%) |
| 19 to 25 Years | 0 (0.0%) | 0 (0.0%) |
| 25 to 34 Years | 25 (26.9%) | 68 (73.1%) |
| 35 to 44 Years | 0 (0.0%) | 23 (100.0%) |
| 45 to 54 Years | 0 (0.0%) | 46 (100.0%) |
| 55 to 64 Years | 9 (25.0%) | 32 (88.9%) |
| 65 to 74 Years | 39 (100.0%) | 16 (41.0%) |
| 75 Years and over | 105 (100.0%) | 6 (5.7%) |
| Total | 178 (49.4%) | 209 (58.1%) |
Disability Status by Sex by Age in Pine Hill
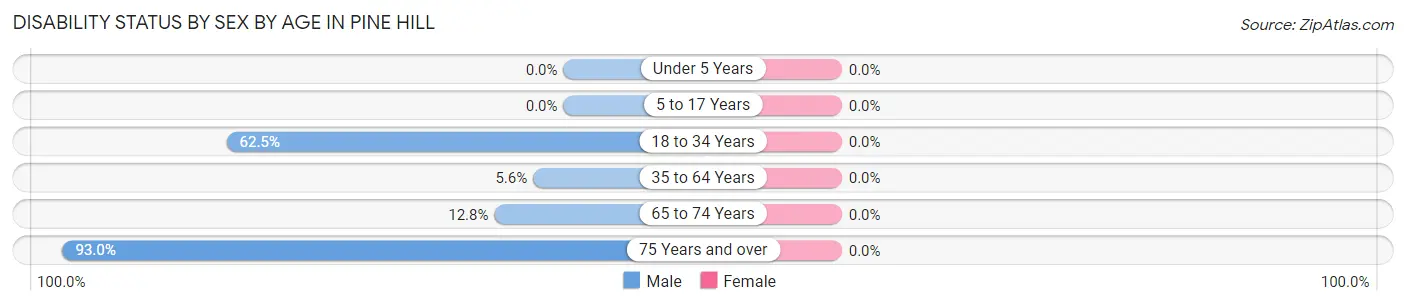
| Age Bracket | Male | Female |
| Under 5 Years | 0 (0.0%) | 0 (0.0%) |
| 5 to 17 Years | 0 (0.0%) | 0 (0.0%) |
| 18 to 34 Years | 25 (62.5%) | 0 (0.0%) |
| 35 to 64 Years | 4 (5.6%) | 0 (0.0%) |
| 65 to 74 Years | 5 (12.8%) | 0 (0.0%) |
| 75 Years and over | 66 (93.0%) | 0 (0.0%) |
Disability Class by Sex by Age in Pine Hill
Disability Class: Hearing Difficulty
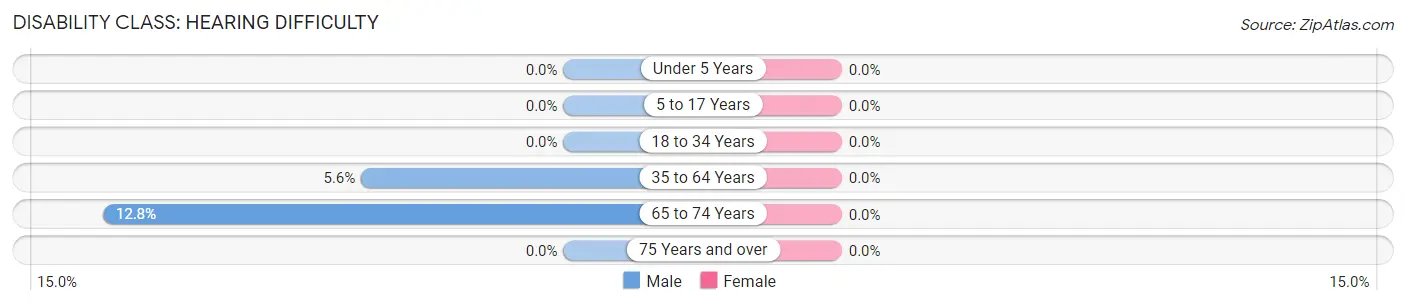
| Age Bracket | Male | Female |
| Under 5 Years | 0 (0.0%) | 0 (0.0%) |
| 5 to 17 Years | 0 (0.0%) | 0 (0.0%) |
| 18 to 34 Years | 0 (0.0%) | 0 (0.0%) |
| 35 to 64 Years | 4 (5.6%) | 0 (0.0%) |
| 65 to 74 Years | 5 (12.8%) | 0 (0.0%) |
| 75 Years and over | 0 (0.0%) | 0 (0.0%) |
Disability Class: Vision Difficulty
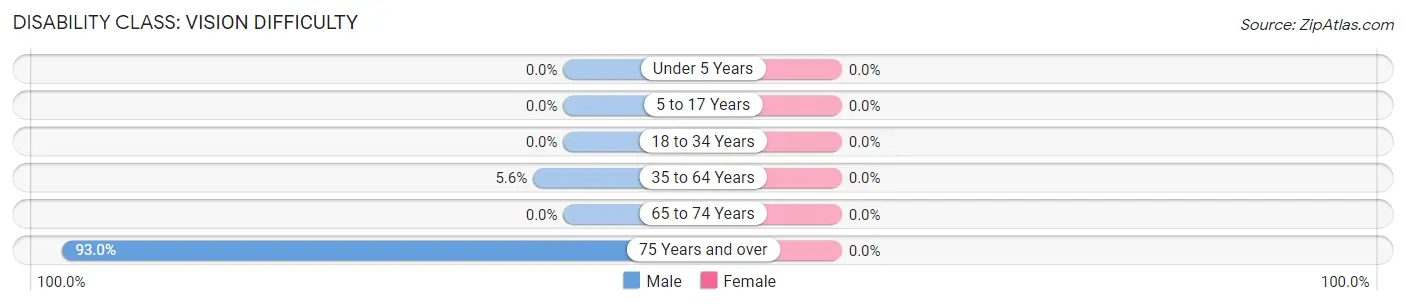
| Age Bracket | Male | Female |
| Under 5 Years | 0 (0.0%) | 0 (0.0%) |
| 5 to 17 Years | 0 (0.0%) | 0 (0.0%) |
| 18 to 34 Years | 0 (0.0%) | 0 (0.0%) |
| 35 to 64 Years | 4 (5.6%) | 0 (0.0%) |
| 65 to 74 Years | 0 (0.0%) | 0 (0.0%) |
| 75 Years and over | 66 (93.0%) | 0 (0.0%) |
Disability Class: Cognitive Difficulty
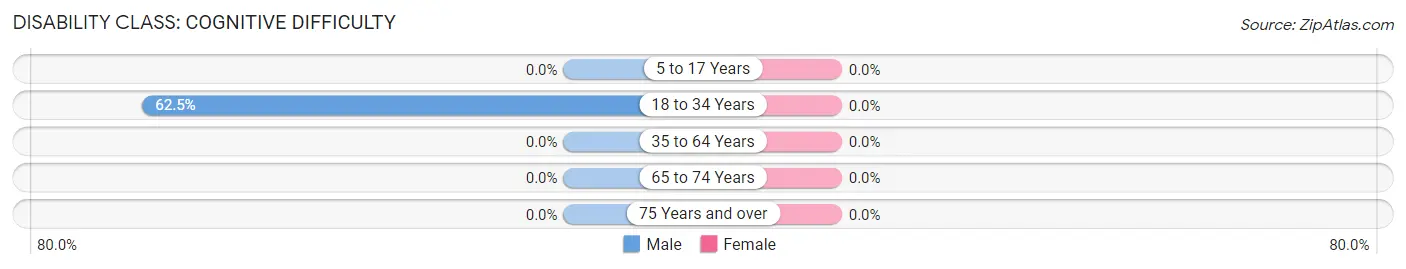
| Age Bracket | Male | Female |
| 5 to 17 Years | 0 (0.0%) | 0 (0.0%) |
| 18 to 34 Years | 25 (62.5%) | 0 (0.0%) |
| 35 to 64 Years | 0 (0.0%) | 0 (0.0%) |
| 65 to 74 Years | 0 (0.0%) | 0 (0.0%) |
| 75 Years and over | 0 (0.0%) | 0 (0.0%) |
Disability Class: Ambulatory Difficulty
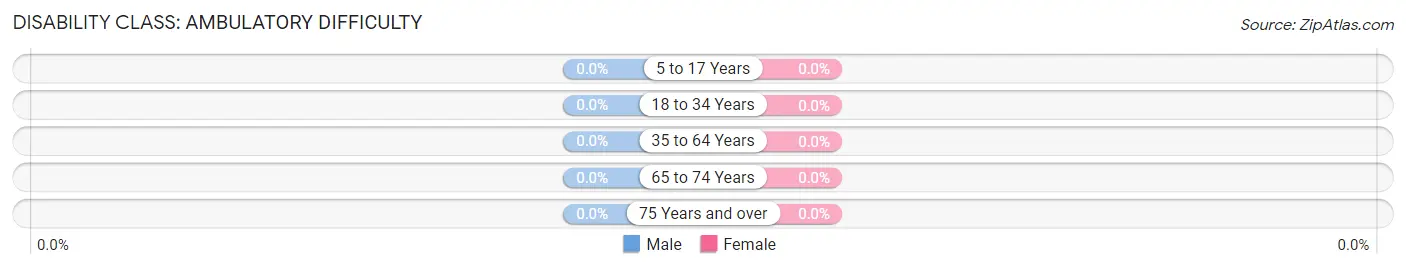
| Age Bracket | Male | Female |
| 5 to 17 Years | 0 (0.0%) | 0 (0.0%) |
| 18 to 34 Years | 0 (0.0%) | 0 (0.0%) |
| 35 to 64 Years | 0 (0.0%) | 0 (0.0%) |
| 65 to 74 Years | 0 (0.0%) | 0 (0.0%) |
| 75 Years and over | 0 (0.0%) | 0 (0.0%) |
Disability Class: Self-Care Difficulty
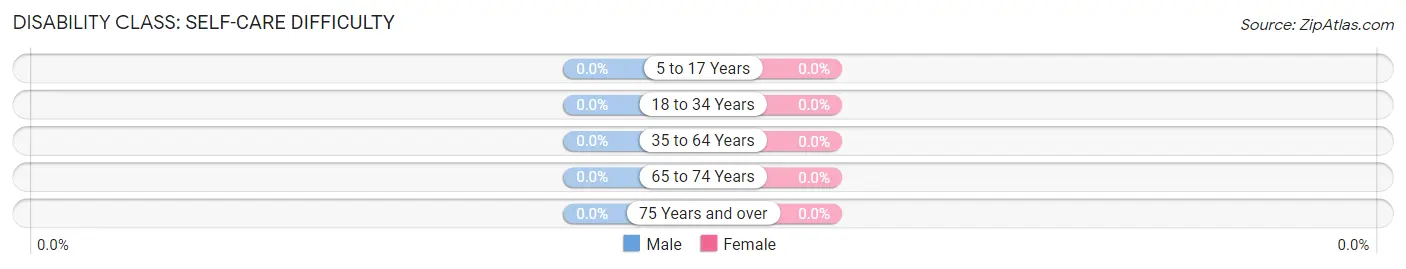
| Age Bracket | Male | Female |
| 5 to 17 Years | 0 (0.0%) | 0 (0.0%) |
| 18 to 34 Years | 0 (0.0%) | 0 (0.0%) |
| 35 to 64 Years | 0 (0.0%) | 0 (0.0%) |
| 65 to 74 Years | 0 (0.0%) | 0 (0.0%) |
| 75 Years and over | 0 (0.0%) | 0 (0.0%) |
Technology Access in Pine Hill
Computing Device Access in Pine Hill
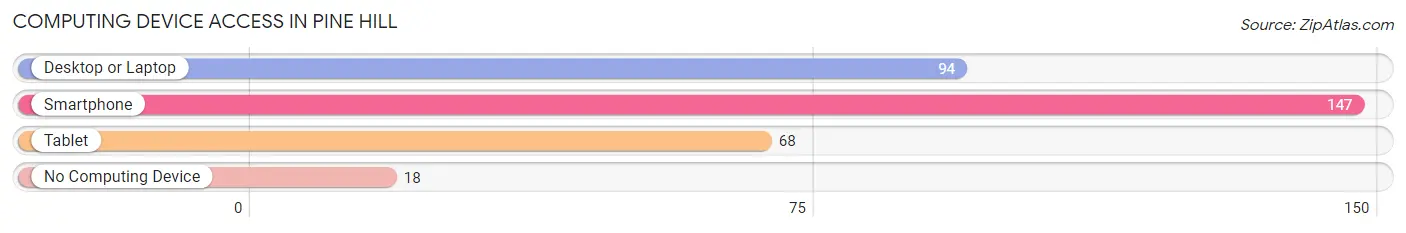
| Device Type | # Households | % Households |
| Desktop or Laptop | 94 | 53.7% |
| Smartphone | 147 | 84.0% |
| Tablet | 68 | 38.9% |
| No Computing Device | 18 | 10.3% |
| Total | 175 | 100.0% |
Internet Access in Pine Hill
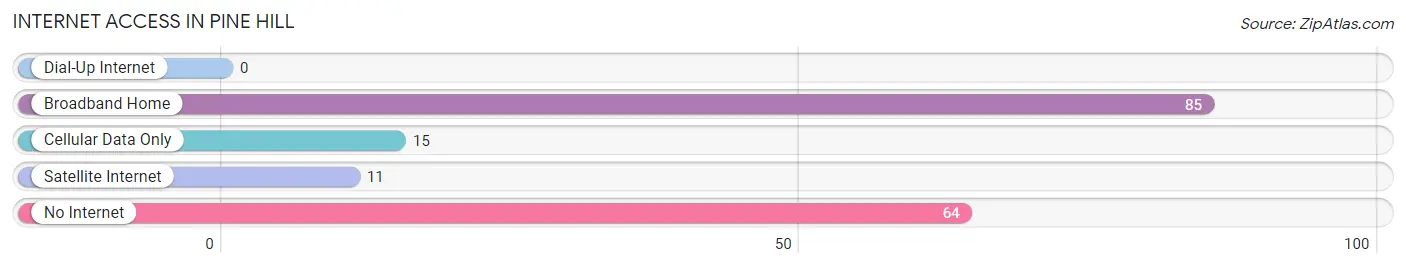
| Internet Type | # Households | % Households |
| Dial-Up Internet | 0 | 0.0% |
| Broadband Home | 85 | 48.6% |
| Cellular Data Only | 15 | 8.6% |
| Satellite Internet | 11 | 6.3% |
| No Internet | 64 | 36.6% |
| Total | 175 | 100.0% |
Pine Hill Summary
Pine Hill is a small hamlet located in the town of Shandaken in Ulster County, New York. It is situated in the Catskill Mountains, approximately two hours north of New York City. The hamlet is home to a population of approximately 1,000 people and is known for its rural charm and natural beauty.
History
The area that is now Pine Hill was originally inhabited by the Esopus Indians, who were part of the larger Lenape tribe. The first European settlers arrived in the area in the late 1700s, and the hamlet was officially established in 1820. The hamlet was named after the abundance of pine trees in the area.
In the late 1800s, Pine Hill became a popular destination for vacationers from New York City. The hamlet was home to several hotels and resorts, and the area was known for its natural beauty and outdoor activities.
In the early 1900s, the hamlet began to decline in popularity as a vacation destination. The decline was due to the increasing popularity of other nearby towns, such as Woodstock and Phoenicia.
Geography
Pine Hill is located in the Catskill Mountains, approximately two hours north of New York City. The hamlet is situated at an elevation of 1,400 feet and is surrounded by mountains and forests. The hamlet is located near the Esopus Creek, which is a popular destination for fishing and swimming.
The climate in Pine Hill is generally mild, with temperatures ranging from the low 30s in the winter to the mid-80s in the summer. The area receives an average of 40 inches of precipitation per year, with most of it falling in the form of snow in the winter months.
Economy
The economy of Pine Hill is largely based on tourism. The hamlet is home to several hotels and resorts, as well as a variety of restaurants and shops. The area is also popular for outdoor activities such as hiking, fishing, and skiing.
In addition to tourism, the hamlet is home to several small businesses, including a lumber mill, a furniture store, and a hardware store. The hamlet is also home to a small airport, which is used for private planes and helicopters.
Demographics
As of the 2010 census, the population of Pine Hill was 1,000. The population is predominantly white (94.2%), with small percentages of African American (2.2%), Hispanic (1.7%), and Asian (1.1%) residents. The median household income is $45,000, and the median age is 44.
Conclusion
Pine Hill is a small hamlet located in the Catskill Mountains of New York. The hamlet is known for its rural charm and natural beauty, and is a popular destination for tourists and outdoor enthusiasts. The economy of Pine Hill is largely based on tourism, and the population is predominantly white.
Common Questions
What is Per Capita Income in Pine Hill?
Per Capita income in Pine Hill is $52,013.
What is the Median Household income in Pine Hill?
Median Household Income in Pine Hill is $81,181.
What is Inequality or Gini Index in Pine Hill?
Inequality or Gini Index in Pine Hill is 0.44.
What is the Total Population of Pine Hill?
Total Population of Pine Hill is 360.
What is the Total Male Population of Pine Hill?
Total Male Population of Pine Hill is 239.
What is the Total Female Population of Pine Hill?
Total Female Population of Pine Hill is 121.
What is the Ratio of Males per 100 Females in Pine Hill?
There are 197.52 Males per 100 Females in Pine Hill.
What is the Ratio of Females per 100 Males in Pine Hill?
There are 50.63 Females per 100 Males in Pine Hill.
What is the Median Population Age in Pine Hill?
Median Population Age in Pine Hill is 55.5 Years.
What is the Average Family Size in Pine Hill
Average Family Size in Pine Hill is 2.8 People.
What is the Average Household Size in Pine Hill
Average Household Size in Pine Hill is 2.1 People.
How Large is the Labor Force in Pine Hill?
There are 185 People in the Labor Forcein in Pine Hill.
What is the Percentage of People in the Labor Force in Pine Hill?
54.1% of People are in the Labor Force in Pine Hill.