Stony Brook University, NY Map & Demographics
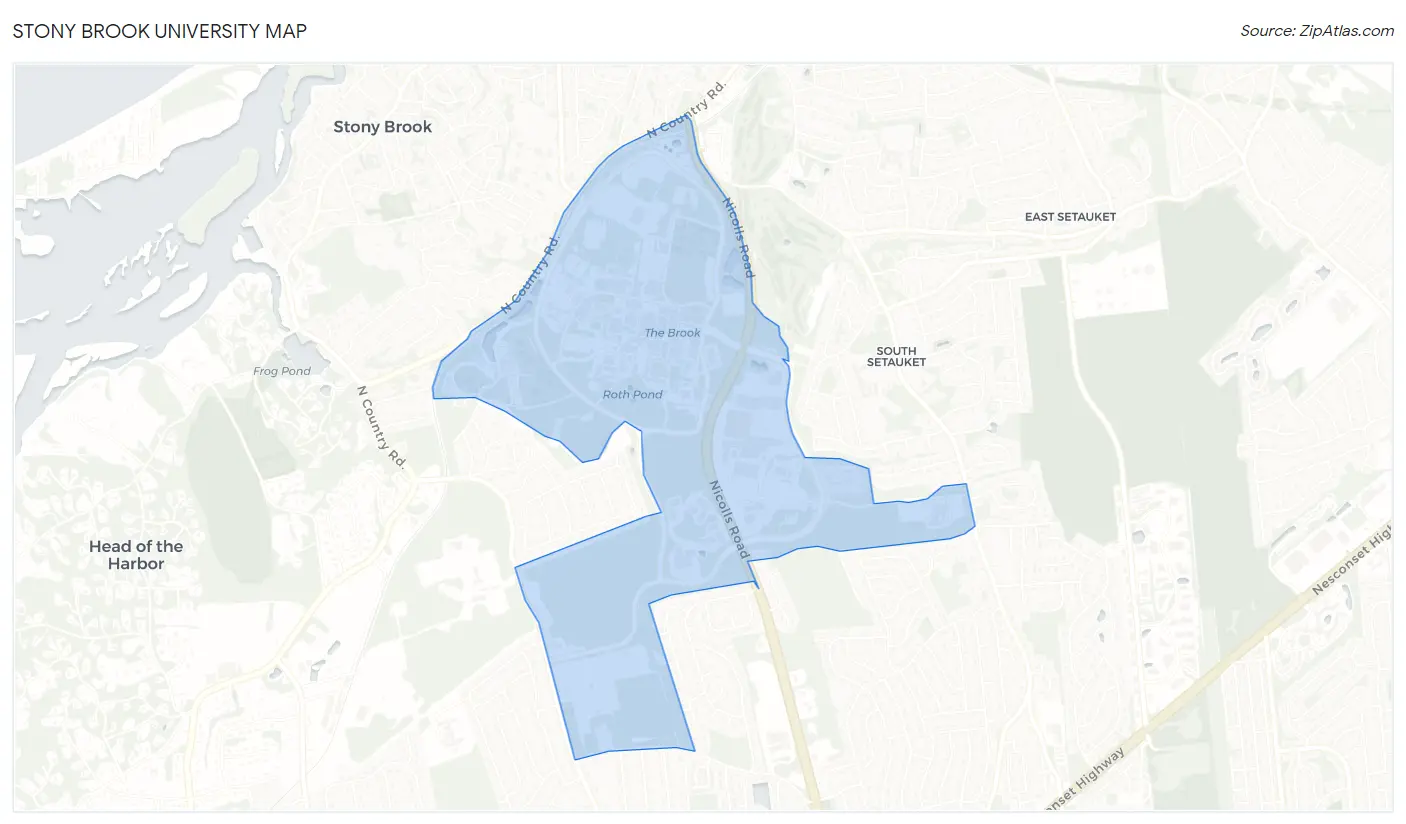
Stony Brook University Map
Stony Brook University Overview
$6,086
PER CAPITA INCOME
33.9%
WAGE / INCOME GAP [ % ]
66.1¢/ $1
WAGE / INCOME GAP [ $ ]
8,755
TOTAL POPULATION
4,459
MALE POPULATION
4,296
FEMALE POPULATION
103.79
MALES / 100 FEMALES
96.34
FEMALES / 100 MALES
20.0
MEDIAN AGE
3,117
LABOR FORCE [ PEOPLE ]
35.6%
PERCENT IN LABOR FORCE
12.6%
UNEMPLOYMENT RATE
Income in Stony Brook University
Income Overview in Stony Brook University
| Characteristic | Number | Measure |
| Per Capita Income | 8,755 | $6,086 |
| Median Family Income | 0 | $0 |
| Mean Family Income | 0 | $0 |
| Median Household Income | 0 | $0 |
| Mean Household Income | 0 | $0 |
| Income Deficit | 0 | $0 |
| Wage / Income Gap (%) | 8,755 | 33.87% |
| Wage / Income Gap ($) | 8,755 | 66.13¢ per $1 |
| Gini / Inequality Index | 8,755 | 0.00 |
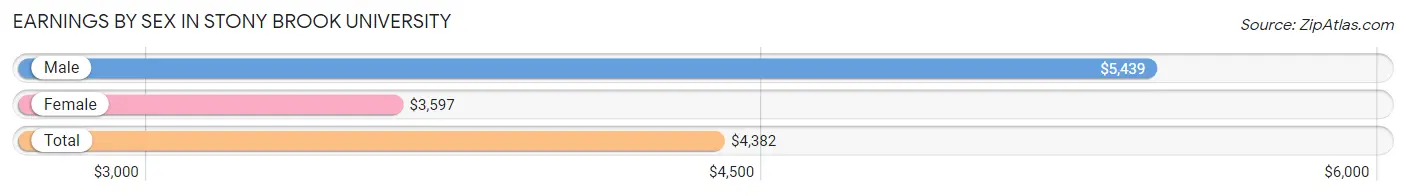
Earnings by Sex in Stony Brook University
Average Earnings in Stony Brook University are $4,382, $5,439 for men and $3,597 for women, a difference of 33.9%.
| Sex | Number | Average Earnings |
| Male | 2,355 (48.5%) | $5,439 |
| Female | 2,496 (51.4%) | $3,597 |
| Total | 4,851 (100.0%) | $4,382 |
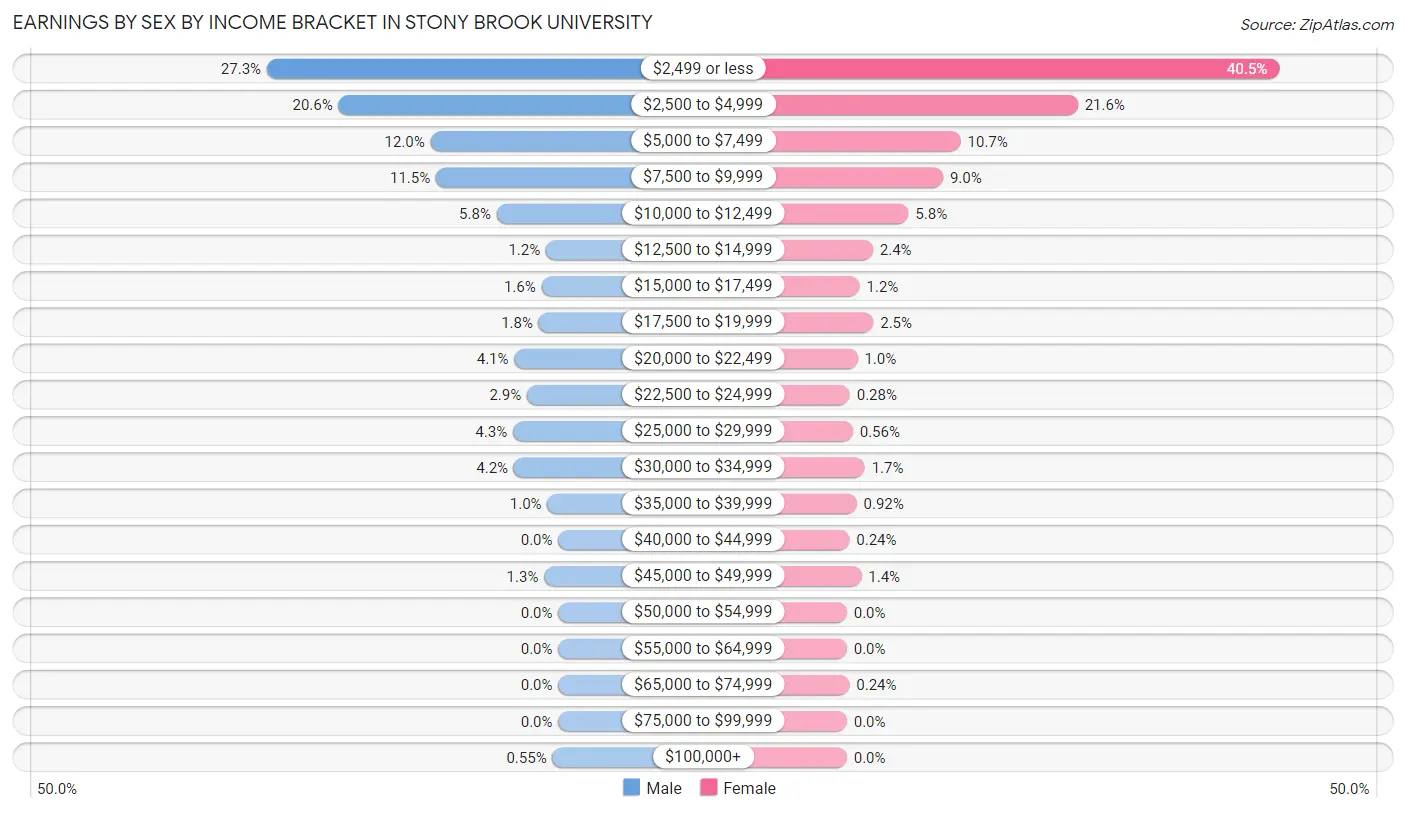
Earnings by Sex by Income Bracket in Stony Brook University
The most common earnings brackets in Stony Brook University are $2,499 or less for men (643 | 27.3%) and $2,499 or less for women (1,011 | 40.5%).
| Income | Male | Female |
| $2,499 or less | 643 (27.3%) | 1,011 (40.5%) |
| $2,500 to $4,999 | 485 (20.6%) | 540 (21.6%) |
| $5,000 to $7,499 | 282 (12.0%) | 266 (10.7%) |
| $7,500 to $9,999 | 270 (11.5%) | 225 (9.0%) |
| $10,000 to $12,499 | 136 (5.8%) | 144 (5.8%) |
| $12,500 to $14,999 | 27 (1.1%) | 61 (2.4%) |
| $15,000 to $17,499 | 37 (1.6%) | 30 (1.2%) |
| $17,500 to $19,999 | 43 (1.8%) | 62 (2.5%) |
| $20,000 to $22,499 | 97 (4.1%) | 25 (1.0%) |
| $22,500 to $24,999 | 69 (2.9%) | 7 (0.3%) |
| $25,000 to $29,999 | 100 (4.3%) | 14 (0.6%) |
| $30,000 to $34,999 | 98 (4.2%) | 42 (1.7%) |
| $35,000 to $39,999 | 24 (1.0%) | 23 (0.9%) |
| $40,000 to $44,999 | 0 (0.0%) | 6 (0.2%) |
| $45,000 to $49,999 | 31 (1.3%) | 34 (1.4%) |
| $50,000 to $54,999 | 0 (0.0%) | 0 (0.0%) |
| $55,000 to $64,999 | 0 (0.0%) | 0 (0.0%) |
| $65,000 to $74,999 | 0 (0.0%) | 6 (0.2%) |
| $75,000 to $99,999 | 0 (0.0%) | 0 (0.0%) |
| $100,000+ | 13 (0.5%) | 0 (0.0%) |
| Total | 2,355 (100.0%) | 2,496 (100.0%) |
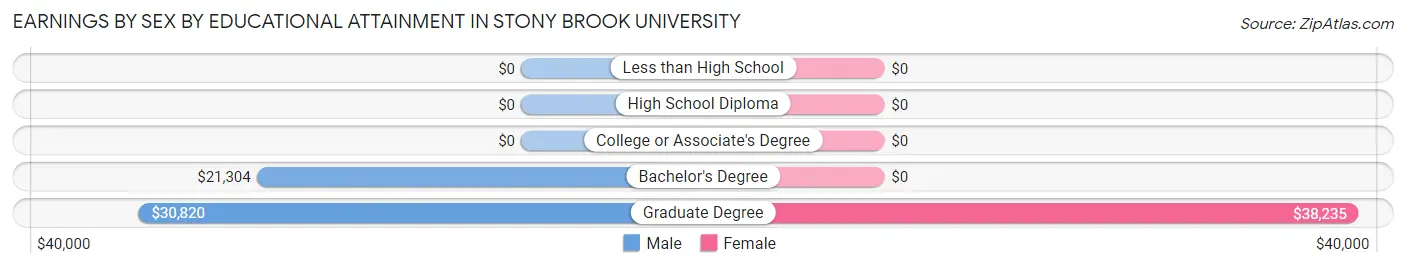
Earnings by Sex by Educational Attainment in Stony Brook University
Average earnings in Stony Brook University are $21,268 for men and $31,875 for women, a difference of 33.3%. Men with an educational attainment of graduate degree enjoy the highest average annual earnings of $30,820, while those with bachelor's degree education earn the least with $21,304. Women with an educational attainment of graduate degree earn the most with the average annual earnings of $38,235, while those with graduate degree education have the smallest earnings of $38,235.
| Educational Attainment | Male Income | Female Income |
| Less than High School | - | - |
| High School Diploma | - | - |
| College or Associate's Degree | - | - |
| Bachelor's Degree | $21,304 | $0 |
| Graduate Degree | $30,820 | $38,235 |
| Total | $21,268 | $31,875 |
Family Income in Stony Brook University
Family Income Brackets in Stony Brook University
| Income Bracket | # Families | % Families |
| Less than $10,000 | 0 | 0.0% |
| $10,000 to $14,999 | 0 | 0.0% |
| $15,000 to $24,999 | 0 | 0.0% |
| $25,000 to $34,999 | 0 | 0.0% |
| $35,000 to $49,999 | 0 | 0.0% |
| $50,000 to $74,999 | 0 | 0.0% |
| $75,000 to $99,999 | 0 | 0.0% |
| $100,000 to $149,999 | 0 | 0.0% |
| $150,000 to $199,999 | 0 | 0.0% |
| $200,000+ | 0 | 0.0% |
Family Income by Famaliy Size in Stony Brook University
| Income Bracket | # Families | Median Income |
| 2-Person Families | 0 (0.0%) | $0 |
| 3-Person Families | 0 (0.0%) | $0 |
| 4-Person Families | 0 (0.0%) | $0 |
| 5-Person Families | 0 (0.0%) | $0 |
| 6-Person Families | 0 (0.0%) | $0 |
| 7+ Person Families | 0 (0.0%) | $0 |
| Total | 0 (0.0%) | $0 |
Family Income by Number of Earners in Stony Brook University
| Number of Earners | # Families | Median Income |
| No Earners | 0 (0.0%) | $0 |
| 1 Earner | 0 (0.0%) | $0 |
| 2 Earners | 0 (0.0%) | $0 |
| 3+ Earners | 0 (0.0%) | $0 |
| Total | 0 (0.0%) | $0 |
Household Income in Stony Brook University
Household Income Brackets in Stony Brook University
| Income Bracket | # Households | % Households |
| Less than $10,000 | 0 | 0.0% |
| $10,000 to $14,999 | 0 | 0.0% |
| $15,000 to $24,999 | 0 | 0.0% |
| $25,000 to $34,999 | 0 | 0.0% |
| $35,000 to $49,999 | 0 | 0.0% |
| $50,000 to $74,999 | 0 | 0.0% |
| $75,000 to $99,999 | 0 | 0.0% |
| $100,000 to $149,999 | 0 | 0.0% |
| $150,000 to $199,999 | 0 | 0.0% |
| $200,000+ | 0 | 0.0% |
Household Income by Householder Age in Stony Brook University
| Income Bracket | # Households | Median Income |
| 15 to 24 Years | 0 (0.0%) | $0 |
| 25 to 44 Years | 0 (0.0%) | $0 |
| 45 to 64 Years | 0 (0.0%) | $0 |
| 65+ Years | 0 (0.0%) | $0 |
| Total | 0 (0.0%) | $0 |
Poverty in Stony Brook University
Income Below Poverty by Sex and Age in Stony Brook University
| Age Bracket | Male | Female |
| Under 5 Years | 0 (0.0%) | 0 (0.0%) |
| 5 Years | 0 (0.0%) | 0 (0.0%) |
| 6 to 11 Years | 0 (0.0%) | 0 (0.0%) |
| 12 to 14 Years | 0 (0.0%) | 0 (0.0%) |
| 15 Years | 0 (0.0%) | 0 (0.0%) |
| 16 and 17 Years | 0 (0.0%) | 0 (0.0%) |
| 18 to 24 Years | 0 (0.0%) | 0 (0.0%) |
| 25 to 34 Years | 0 (0.0%) | 0 (0.0%) |
| 35 to 44 Years | 0 (0.0%) | 0 (0.0%) |
| 45 to 54 Years | 0 (0.0%) | 0 (0.0%) |
| 55 to 64 Years | 0 (0.0%) | 0 (0.0%) |
| 65 to 74 Years | 0 (0.0%) | 0 (0.0%) |
| 75 Years and over | 0 (0.0%) | 0 (0.0%) |
| Total | 0 (0.0%) | 0 (0.0%) |
Income Above Poverty by Sex and Age in Stony Brook University
| Age Bracket | Male | Female |
| Under 5 Years | 0 (0.0%) | 0 (0.0%) |
| 5 Years | 0 (0.0%) | 0 (0.0%) |
| 6 to 11 Years | 0 (0.0%) | 0 (0.0%) |
| 12 to 14 Years | 0 (0.0%) | 0 (0.0%) |
| 15 Years | 0 (0.0%) | 0 (0.0%) |
| 16 and 17 Years | 0 (0.0%) | 0 (0.0%) |
| 18 to 24 Years | 0 (0.0%) | 0 (0.0%) |
| 25 to 34 Years | 0 (0.0%) | 0 (0.0%) |
| 35 to 44 Years | 0 (0.0%) | 0 (0.0%) |
| 45 to 54 Years | 0 (0.0%) | 0 (0.0%) |
| 55 to 64 Years | 0 (0.0%) | 0 (0.0%) |
| 65 to 74 Years | 0 (0.0%) | 0 (0.0%) |
| 75 Years and over | 0 (0.0%) | 0 (0.0%) |
| Total | 0 (0.0%) | 0 (0.0%) |
Income Below Poverty Among Married-Couple Families in Stony Brook University
| Children | Above Poverty | Below Poverty |
| No Children | 0 (0.0%) | 0 (0.0%) |
| 1 or 2 Children | 0 (0.0%) | 0 (0.0%) |
| 3 or 4 Children | 0 (0.0%) | 0 (0.0%) |
| 5 or more Children | 0 (0.0%) | 0 (0.0%) |
| Total | 0 (0.0%) | 0 (0.0%) |
Income Below Poverty Among Single-Parent Households in Stony Brook University
| Children | Single Father | Single Mother |
| No Children | 0 (0.0%) | 0 (0.0%) |
| 1 or 2 Children | 0 (0.0%) | 0 (0.0%) |
| 3 or 4 Children | 0 (0.0%) | 0 (0.0%) |
| 5 or more Children | 0 (0.0%) | 0 (0.0%) |
| Total | 0 (0.0%) | 0 (0.0%) |
Income Below Poverty Among Married-Couple vs Single-Parent Households in Stony Brook University
| Children | Married-Couple Families | Single-Parent Households |
| No Children | 0 (0.0%) | 0 (0.0%) |
| 1 or 2 Children | 0 (0.0%) | 0 (0.0%) |
| 3 or 4 Children | 0 (0.0%) | 0 (0.0%) |
| 5 or more Children | 0 (0.0%) | 0 (0.0%) |
| Total | 0 (0.0%) | 0 (0.0%) |
Race in Stony Brook University
The most populous races in Stony Brook University are Asian (3,950 | 45.1%), White / Caucasian (3,149 | 36.0%), and Black / African American (940 | 10.7%).
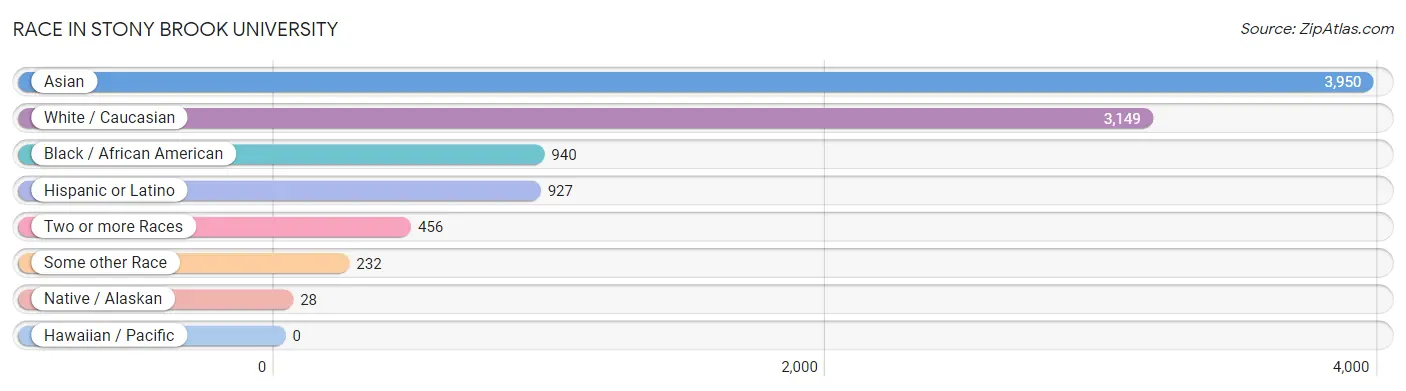
| Race | # Population | % Population |
| Asian | 3,950 | 45.1% |
| Black / African American | 940 | 10.7% |
| Hawaiian / Pacific | 0 | 0.0% |
| Hispanic or Latino | 927 | 10.6% |
| Native / Alaskan | 28 | 0.3% |
| White / Caucasian | 3,149 | 36.0% |
| Two or more Races | 456 | 5.2% |
| Some other Race | 232 | 2.6% |
| Total | 8,755 | 100.0% |
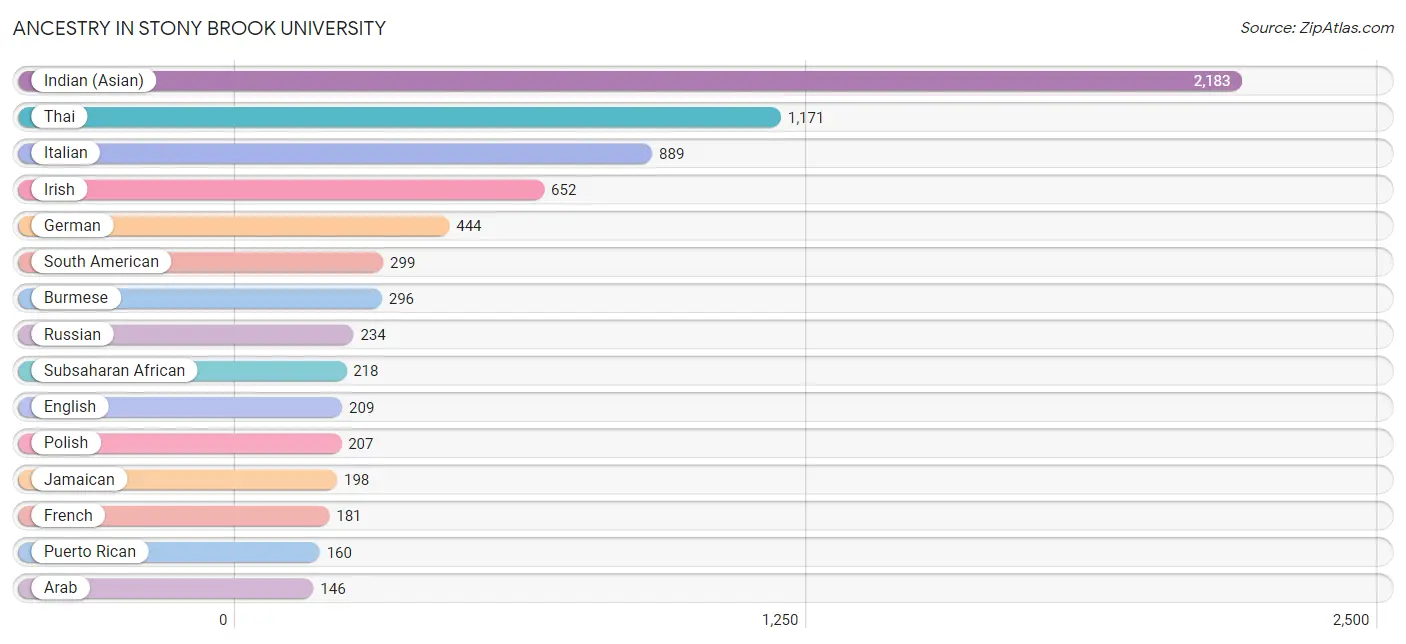
Ancestry in Stony Brook University
The most populous ancestries reported in Stony Brook University are Indian (Asian) (2,183 | 24.9%), Thai (1,171 | 13.4%), Italian (889 | 10.2%), Irish (652 | 7.4%), and German (444 | 5.1%), together accounting for 61.0% of all Stony Brook University residents.
| Ancestry | # Population | % Population |
| Afghan | 17 | 0.2% |
| African | 42 | 0.5% |
| Albanian | 35 | 0.4% |
| American | 51 | 0.6% |
| Arab | 146 | 1.7% |
| Argentinean | 10 | 0.1% |
| Armenian | 34 | 0.4% |
| Australian | 52 | 0.6% |
| Austrian | 50 | 0.6% |
| Bangladeshi | 10 | 0.1% |
| Belizean | 12 | 0.1% |
| Bhutanese | 41 | 0.5% |
| Bolivian | 17 | 0.2% |
| Brazilian | 5 | 0.1% |
| British West Indian | 30 | 0.3% |
| Burmese | 296 | 3.4% |
| Cambodian | 12 | 0.1% |
| Central American | 76 | 0.9% |
| Central American Indian | 2 | 0.0% |
| Cherokee | 14 | 0.2% |
| Colombian | 79 | 0.9% |
| Costa Rican | 11 | 0.1% |
| Cuban | 43 | 0.5% |
| Czech | 12 | 0.1% |
| Czechoslovakian | 11 | 0.1% |
| Dominican | 139 | 1.6% |
| Dutch | 13 | 0.2% |
| Eastern European | 38 | 0.4% |
| Ecuadorian | 146 | 1.7% |
| Egyptian | 38 | 0.4% |
| English | 209 | 2.4% |
| European | 9 | 0.1% |
| Filipino | 4 | 0.1% |
| French | 181 | 2.1% |
| French Canadian | 2 | 0.0% |
| German | 444 | 5.1% |
| Ghanaian | 109 | 1.3% |
| Greek | 109 | 1.3% |
| Guatemalan | 12 | 0.1% |
| Guyanese | 82 | 0.9% |
| Haitian | 106 | 1.2% |
| Honduran | 21 | 0.2% |
| Indian (Asian) | 2,183 | 24.9% |
| Indonesian | 59 | 0.7% |
| Inupiat | 5 | 0.1% |
| Iranian | 87 | 1.0% |
| Irish | 652 | 7.4% |
| Italian | 889 | 10.2% |
| Jamaican | 198 | 2.3% |
| Korean | 95 | 1.1% |
| Lebanese | 48 | 0.5% |
| Lithuanian | 17 | 0.2% |
| Maltese | 23 | 0.3% |
| Mexican | 110 | 1.3% |
| Mongolian | 6 | 0.1% |
| Moroccan | 13 | 0.2% |
| Native Hawaiian | 11 | 0.1% |
| Nigerian | 71 | 0.8% |
| Northern European | 16 | 0.2% |
| Norwegian | 15 | 0.2% |
| Okinawan | 5 | 0.1% |
| Panamanian | 10 | 0.1% |
| Peruvian | 37 | 0.4% |
| Polish | 207 | 2.4% |
| Portuguese | 21 | 0.2% |
| Puerto Rican | 160 | 1.8% |
| Romanian | 24 | 0.3% |
| Russian | 234 | 2.7% |
| Salvadoran | 22 | 0.3% |
| Samoan | 11 | 0.1% |
| Scandinavian | 21 | 0.2% |
| Scottish | 83 | 0.9% |
| South American | 299 | 3.4% |
| South American Indian | 2 | 0.0% |
| Sri Lankan | 96 | 1.1% |
| Subsaharan African | 218 | 2.5% |
| Swedish | 11 | 0.1% |
| Swiss | 6 | 0.1% |
| Syrian | 24 | 0.3% |
| Thai | 1,171 | 13.4% |
| Trinidadian and Tobagonian | 34 | 0.4% |
| Turkish | 30 | 0.3% |
| Ukrainian | 28 | 0.3% |
| Venezuelan | 2 | 0.0% |
| Vietnamese | 67 | 0.8% |
| Welsh | 6 | 0.1% |
| West Indian | 2 | 0.0% |
| Yugoslavian | 7 | 0.1% | View All 88 Rows |
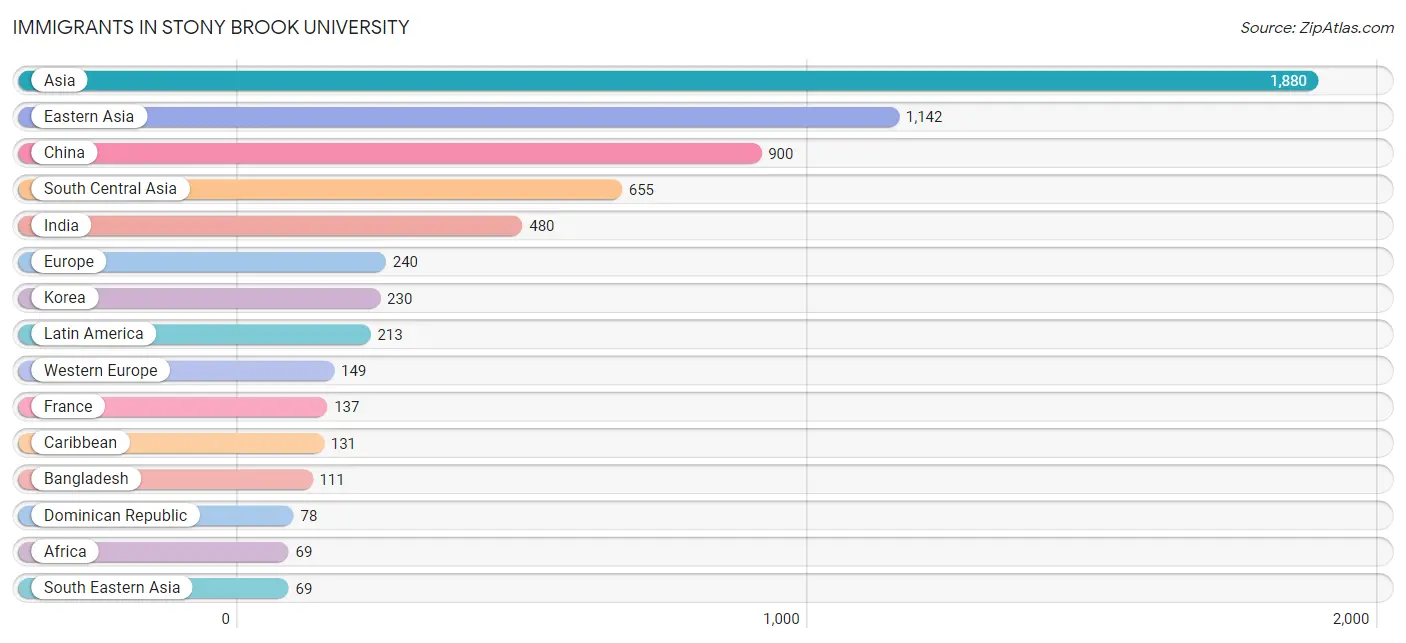
Immigrants in Stony Brook University
The most numerous immigrant groups reported in Stony Brook University came from Asia (1,880 | 21.5%), Eastern Asia (1,142 | 13.0%), China (900 | 10.3%), South Central Asia (655 | 7.5%), and India (480 | 5.5%), together accounting for 57.7% of all Stony Brook University residents.
| Immigration Origin | # Population | % Population |
| Africa | 69 | 0.8% |
| Albania | 18 | 0.2% |
| Asia | 1,880 | 21.5% |
| Bangladesh | 111 | 1.3% |
| Canada | 14 | 0.2% |
| Caribbean | 131 | 1.5% |
| Central America | 15 | 0.2% |
| China | 900 | 10.3% |
| Colombia | 7 | 0.1% |
| Dominican Republic | 78 | 0.9% |
| Eastern Asia | 1,142 | 13.0% |
| Eastern Europe | 31 | 0.4% |
| Ecuador | 21 | 0.2% |
| England | 35 | 0.4% |
| Europe | 240 | 2.7% |
| France | 137 | 1.6% |
| Ghana | 30 | 0.3% |
| Greece | 6 | 0.1% |
| Guyana | 13 | 0.2% |
| Haiti | 24 | 0.3% |
| Honduras | 15 | 0.2% |
| Hong Kong | 20 | 0.2% |
| India | 480 | 5.5% |
| Indonesia | 8 | 0.1% |
| Iran | 29 | 0.3% |
| Italy | 13 | 0.2% |
| Jamaica | 29 | 0.3% |
| Japan | 12 | 0.1% |
| Korea | 230 | 2.6% |
| Latin America | 213 | 2.4% |
| Lithuania | 7 | 0.1% |
| Malaysia | 5 | 0.1% |
| Netherlands | 12 | 0.1% |
| Nigeria | 26 | 0.3% |
| Northern Europe | 35 | 0.4% |
| Pakistan | 15 | 0.2% |
| Peru | 15 | 0.2% |
| Philippines | 8 | 0.1% |
| Poland | 1 | 0.0% |
| Portugal | 6 | 0.1% |
| Russia | 5 | 0.1% |
| Saudi Arabia | 7 | 0.1% |
| South America | 67 | 0.8% |
| South Central Asia | 655 | 7.5% |
| South Eastern Asia | 69 | 0.8% |
| Southern Europe | 25 | 0.3% |
| Uzbekistan | 20 | 0.2% |
| Venezuela | 11 | 0.1% |
| Vietnam | 7 | 0.1% |
| Western Africa | 69 | 0.8% |
| Western Asia | 14 | 0.2% |
| Western Europe | 149 | 1.7% | View All 52 Rows |
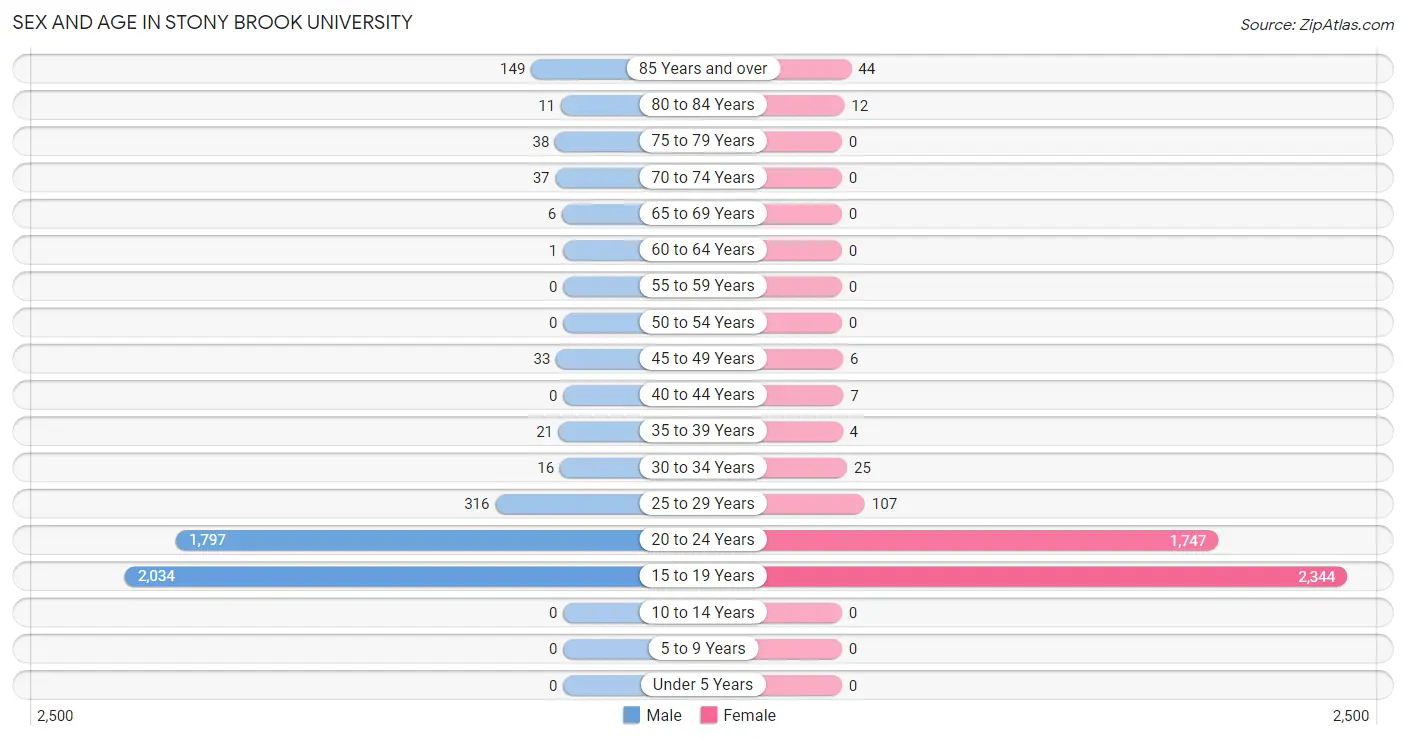
Sex and Age in Stony Brook University
Sex and Age in Stony Brook University
The most populous age groups in Stony Brook University are 15 to 19 Years (2,034 | 45.6%) for men and 15 to 19 Years (2,344 | 54.6%) for women.
| Age Bracket | Male | Female |
| Under 5 Years | 0 (0.0%) | 0 (0.0%) |
| 5 to 9 Years | 0 (0.0%) | 0 (0.0%) |
| 10 to 14 Years | 0 (0.0%) | 0 (0.0%) |
| 15 to 19 Years | 2,034 (45.6%) | 2,344 (54.6%) |
| 20 to 24 Years | 1,797 (40.3%) | 1,747 (40.7%) |
| 25 to 29 Years | 316 (7.1%) | 107 (2.5%) |
| 30 to 34 Years | 16 (0.4%) | 25 (0.6%) |
| 35 to 39 Years | 21 (0.5%) | 4 (0.1%) |
| 40 to 44 Years | 0 (0.0%) | 7 (0.2%) |
| 45 to 49 Years | 33 (0.7%) | 6 (0.1%) |
| 50 to 54 Years | 0 (0.0%) | 0 (0.0%) |
| 55 to 59 Years | 0 (0.0%) | 0 (0.0%) |
| 60 to 64 Years | 1 (0.0%) | 0 (0.0%) |
| 65 to 69 Years | 6 (0.1%) | 0 (0.0%) |
| 70 to 74 Years | 37 (0.8%) | 0 (0.0%) |
| 75 to 79 Years | 38 (0.9%) | 0 (0.0%) |
| 80 to 84 Years | 11 (0.3%) | 12 (0.3%) |
| 85 Years and over | 149 (3.3%) | 44 (1.0%) |
| Total | 4,459 (100.0%) | 4,296 (100.0%) |
Families and Households in Stony Brook University
Median Family Size in Stony Brook University
| Family Type | # Families | Family Size |
| Married-Couple | 0 (0.0%) | - |
| Single Male/Father | 0 (0.0%) | - |
| Single Female/Mother | 0 (0.0%) | - |
| Total Families | 0 (0.0%) | - |
Median Household Size in Stony Brook University
| Household Type | # Households | Household Size |
| Married-Couple | 0 (0.0%) | - |
| Single Male/Father | 0 (0.0%) | - |
| Single Female/Mother | 0 (0.0%) | - |
| Non-family | 0 (0.0%) | - |
| Total Households | 0 (0.0%) | - |
Household Size by Marriage Status in Stony Brook University
| Household Size | Family Households | Nonfamily Households |
| 1-Person Households | - | 0 (0.0%) |
| 2-Person Households | 0 (0.0%) | 0 (0.0%) |
| 3-Person Households | 0 (0.0%) | 0 (0.0%) |
| 4-Person Households | 0 (0.0%) | 0 (0.0%) |
| 5-Person Households | 0 (0.0%) | 0 (0.0%) |
| 6-Person Households | 0 (0.0%) | 0 (0.0%) |
| 7+ Person Households | 0 (0.0%) | 0 (0.0%) |
| Total | 0 (0.0%) | 0 (0.0%) |
Female Fertility in Stony Brook University
Fertility by Age in Stony Brook University
Average fertility rate in Stony Brook University is 2.0 births per 1,000 women. Women in the age bracket of 35 to 50 years have the highest fertility rate with 412.0 births per 1,000 women. Women in the age bracket of 35 to 50 years acount for 100.0% of all women with births.
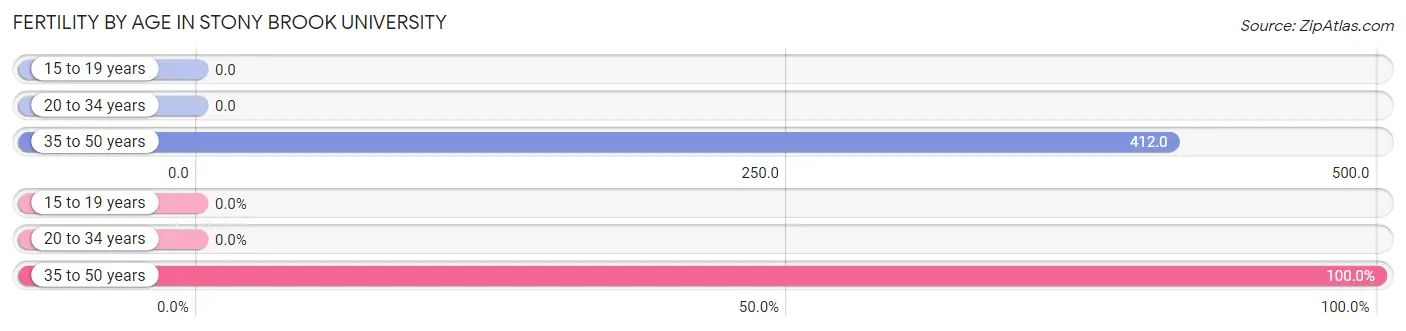
| Age Bracket | Women with Births | Births / 1,000 Women |
| 15 to 19 years | 0 (0.0%) | 0.0 |
| 20 to 34 years | 0 (0.0%) | 0.0 |
| 35 to 50 years | 7 (100.0%) | 412.0 |
| Total | 7 (100.0%) | 2.0 |
Fertility by Age by Marriage Status in Stony Brook University
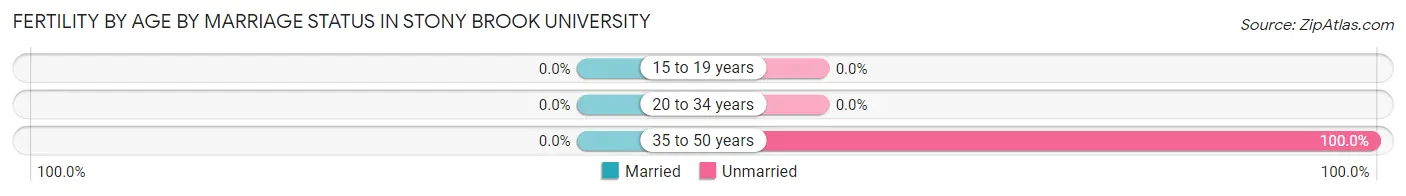
| Age Bracket | Married | Unmarried |
| 15 to 19 years | 0 (0.0%) | 0 (0.0%) |
| 20 to 34 years | 0 (0.0%) | 0 (0.0%) |
| 35 to 50 years | 0 (0.0%) | 7 (100.0%) |
| Total | 0 (0.0%) | 7 (100.0%) |
Fertility by Education in Stony Brook University
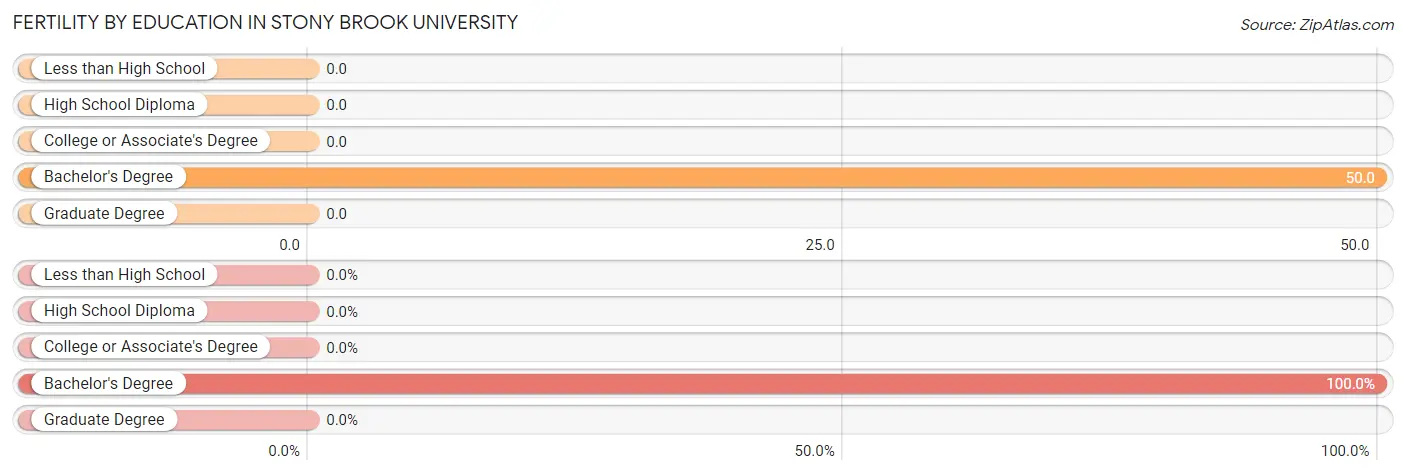
| Educational Attainment | Women with Births | Births / 1,000 Women |
| Less than High School | 0 (0.0%) | 0.0 |
| High School Diploma | 0 (0.0%) | 0.0 |
| College or Associate's Degree | 0 (0.0%) | 0.0 |
| Bachelor's Degree | 7 (100.0%) | 50.0 |
| Graduate Degree | 0 (0.0%) | 0.0 |
| Total | 7 (100.0%) | 2.0 |
Fertility by Education by Marriage Status in Stony Brook University
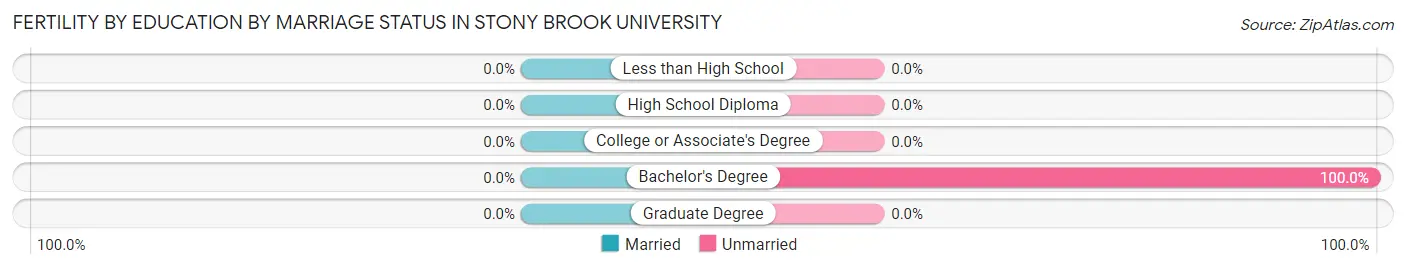
| Educational Attainment | Married | Unmarried |
| Less than High School | 0 (0.0%) | 0 (0.0%) |
| High School Diploma | 0 (0.0%) | 0 (0.0%) |
| College or Associate's Degree | 0 (0.0%) | 0 (0.0%) |
| Bachelor's Degree | 0 (0.0%) | 7 (100.0%) |
| Graduate Degree | 0 (0.0%) | 0 (0.0%) |
| Total | 0 (0.0%) | 7 (100.0%) |
Employment Characteristics in Stony Brook University
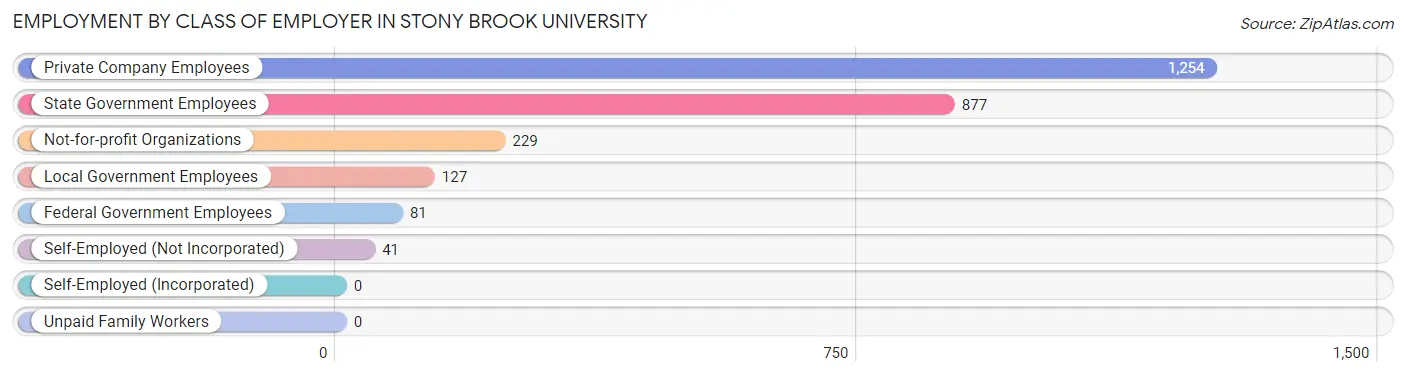
Employment by Class of Employer in Stony Brook University
Among the 2,609 employed individuals in Stony Brook University, private company employees (1,254 | 48.1%), state government employees (877 | 33.6%), and not-for-profit organizations (229 | 8.8%) make up the most common classes of employment.
| Employer Class | # Employees | % Employees |
| Private Company Employees | 1,254 | 48.1% |
| Self-Employed (Incorporated) | 0 | 0.0% |
| Self-Employed (Not Incorporated) | 41 | 1.6% |
| Not-for-profit Organizations | 229 | 8.8% |
| Local Government Employees | 127 | 4.9% |
| State Government Employees | 877 | 33.6% |
| Federal Government Employees | 81 | 3.1% |
| Unpaid Family Workers | 0 | 0.0% |
| Total | 2,609 | 100.0% |
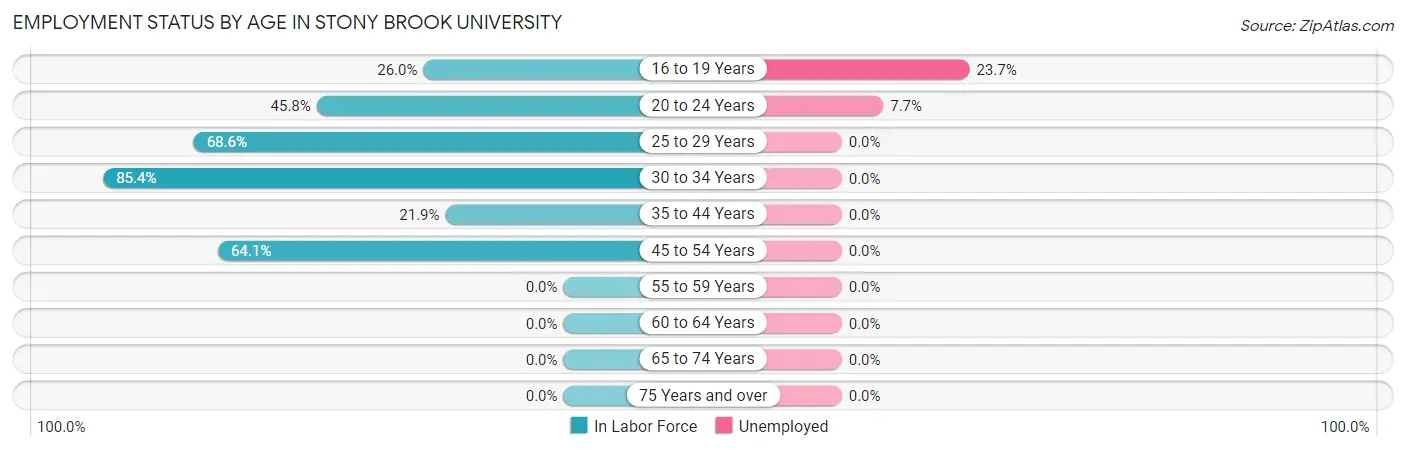
Employment Status by Age in Stony Brook University
According to the labor force statistics for Stony Brook University, out of the total population over 16 years of age (8,755), 35.6% or 3,117 individuals are in the labor force, with 12.6% or 393 of them unemployed. The age group with the highest labor force participation rate is 30 to 34 years, with 85.4% or 35 individuals in the labor force. Within the labor force, the 16 to 19 years age range has the highest percentage of unemployed individuals, with 23.7% or 270 of them being unemployed.
| Age Bracket | In Labor Force | Unemployed |
| 16 to 19 Years | 1,138 (26.0%) | 270 (23.7%) |
| 20 to 24 Years | 1,623 (45.8%) | 125 (7.7%) |
| 25 to 29 Years | 290 (68.6%) | 0 (0.0%) |
| 30 to 34 Years | 35 (85.4%) | 0 (0.0%) |
| 35 to 44 Years | 7 (21.9%) | 0 (0.0%) |
| 45 to 54 Years | 25 (64.1%) | 0 (0.0%) |
| 55 to 59 Years | 0 (0.0%) | 0 (0.0%) |
| 60 to 64 Years | 0 (0.0%) | 0 (0.0%) |
| 65 to 74 Years | 0 (0.0%) | 0 (0.0%) |
| 75 Years and over | 0 (0.0%) | 0 (0.0%) |
| Total | 3,117 (35.6%) | 393 (12.6%) |
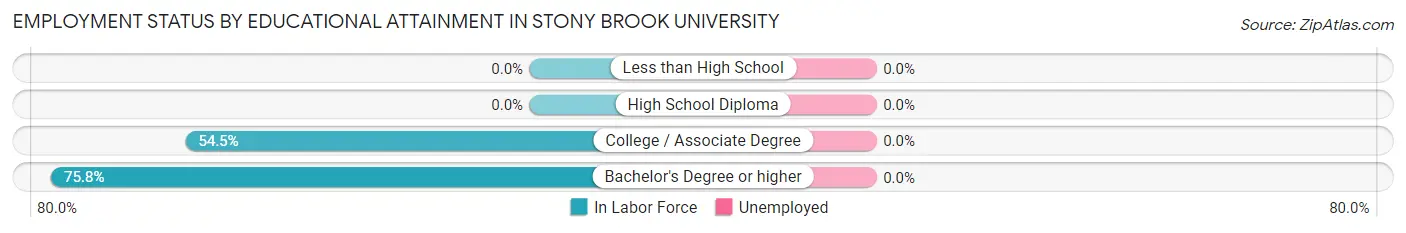
Employment Status by Educational Attainment in Stony Brook University
| Educational Attainment | In Labor Force | Unemployed |
| Less than High School | 0 (0.0%) | 0 (0.0%) |
| High School Diploma | 0 (0.0%) | 0 (0.0%) |
| College / Associate Degree | 54 (54.5%) | 0 (0.0%) |
| Bachelor's Degree or higher | 303 (75.8%) | 0 (0.0%) |
| Total | 357 (66.6%) | 0 (0.0%) |
Employment Occupations by Sex in Stony Brook University
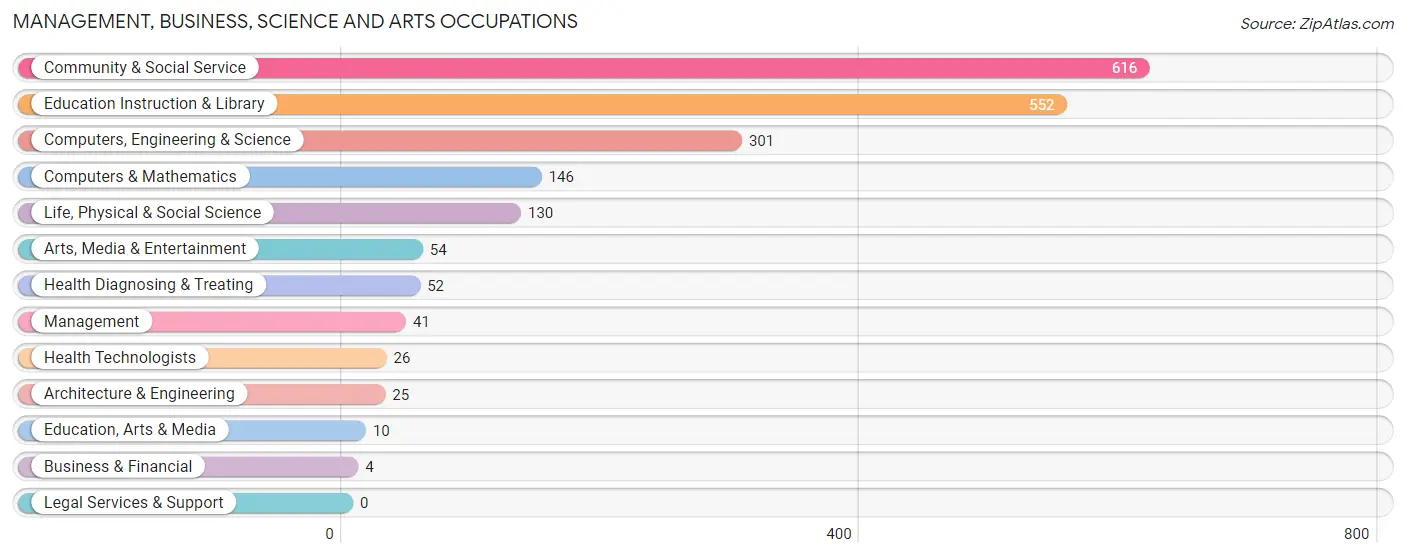
Management, Business, Science and Arts Occupations
The most common Management, Business, Science and Arts occupations in Stony Brook University are Community & Social Service (616 | 22.6%), Education Instruction & Library (552 | 20.3%), Computers, Engineering & Science (301 | 11.1%), Computers & Mathematics (146 | 5.4%), and Life, Physical & Social Science (130 | 4.8%).
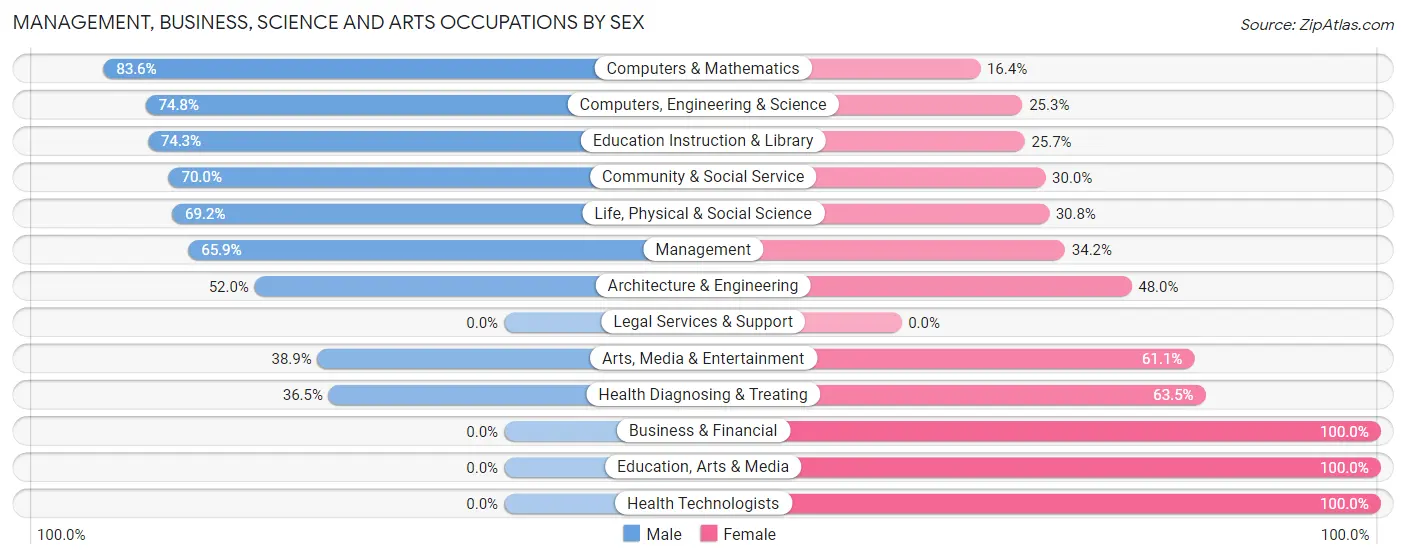
Management, Business, Science and Arts Occupations by Sex
Within the Management, Business, Science and Arts occupations in Stony Brook University, the most male-oriented occupations are Computers & Mathematics (83.6%), Computers, Engineering & Science (74.8%), and Education Instruction & Library (74.3%), while the most female-oriented occupations are Business & Financial (100.0%), Education, Arts & Media (100.0%), and Health Technologists (100.0%).
| Occupation | Male | Female |
| Management | 27 (65.8%) | 14 (34.2%) |
| Business & Financial | 0 (0.0%) | 4 (100.0%) |
| Computers, Engineering & Science | 225 (74.8%) | 76 (25.3%) |
| Computers & Mathematics | 122 (83.6%) | 24 (16.4%) |
| Architecture & Engineering | 13 (52.0%) | 12 (48.0%) |
| Life, Physical & Social Science | 90 (69.2%) | 40 (30.8%) |
| Community & Social Service | 431 (70.0%) | 185 (30.0%) |
| Education, Arts & Media | 0 (0.0%) | 10 (100.0%) |
| Legal Services & Support | 0 (0.0%) | 0 (0.0%) |
| Education Instruction & Library | 410 (74.3%) | 142 (25.7%) |
| Arts, Media & Entertainment | 21 (38.9%) | 33 (61.1%) |
| Health Diagnosing & Treating | 19 (36.5%) | 33 (63.5%) |
| Health Technologists | 0 (0.0%) | 26 (100.0%) |
| Total (Category) | 702 (69.2%) | 312 (30.8%) |
| Total (Overall) | 1,279 (47.0%) | 1,443 (53.0%) |
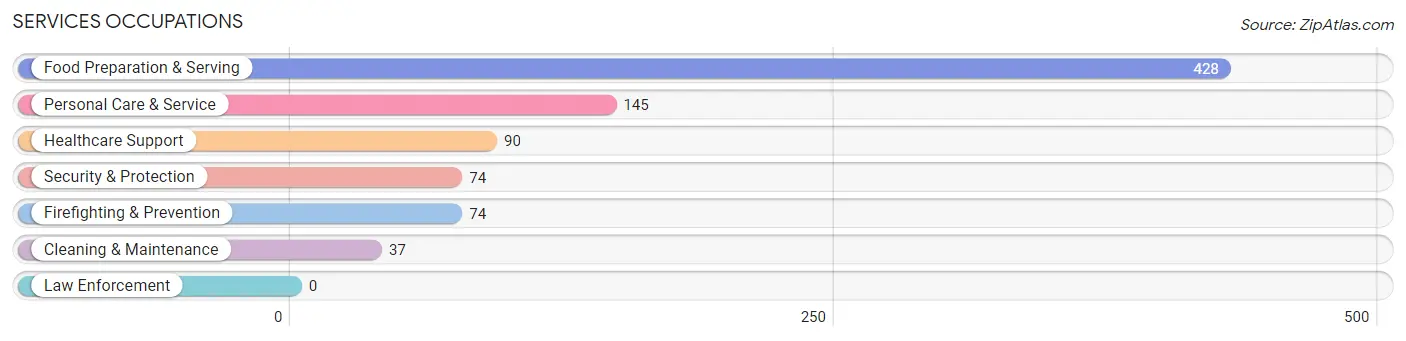
Services Occupations
The most common Services occupations in Stony Brook University are Food Preparation & Serving (428 | 15.7%), Personal Care & Service (145 | 5.3%), Healthcare Support (90 | 3.3%), Security & Protection (74 | 2.7%), and Firefighting & Prevention (74 | 2.7%).
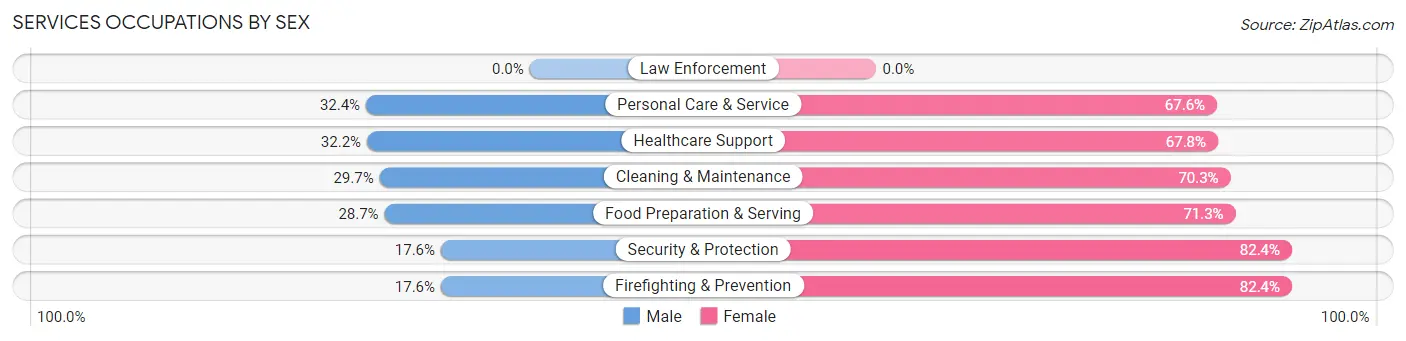
Services Occupations by Sex
Within the Services occupations in Stony Brook University, the most male-oriented occupations are Personal Care & Service (32.4%), Healthcare Support (32.2%), and Cleaning & Maintenance (29.7%), while the most female-oriented occupations are Security & Protection (82.4%), Firefighting & Prevention (82.4%), and Food Preparation & Serving (71.3%).
| Occupation | Male | Female |
| Healthcare Support | 29 (32.2%) | 61 (67.8%) |
| Security & Protection | 13 (17.6%) | 61 (82.4%) |
| Firefighting & Prevention | 13 (17.6%) | 61 (82.4%) |
| Law Enforcement | 0 (0.0%) | 0 (0.0%) |
| Food Preparation & Serving | 123 (28.7%) | 305 (71.3%) |
| Cleaning & Maintenance | 11 (29.7%) | 26 (70.3%) |
| Personal Care & Service | 47 (32.4%) | 98 (67.6%) |
| Total (Category) | 223 (28.8%) | 551 (71.2%) |
| Total (Overall) | 1,279 (47.0%) | 1,443 (53.0%) |
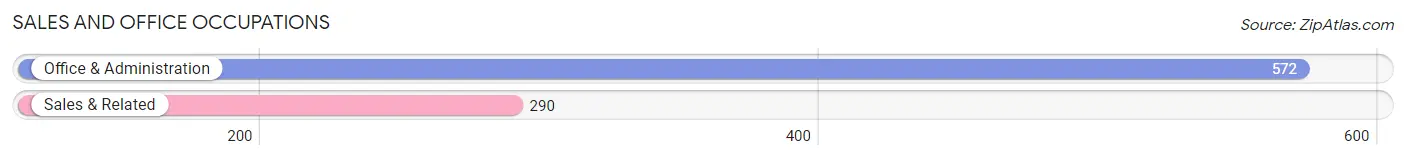
Sales and Office Occupations
The most common Sales and Office occupations in Stony Brook University are Office & Administration (572 | 21.0%), and Sales & Related (290 | 10.6%).
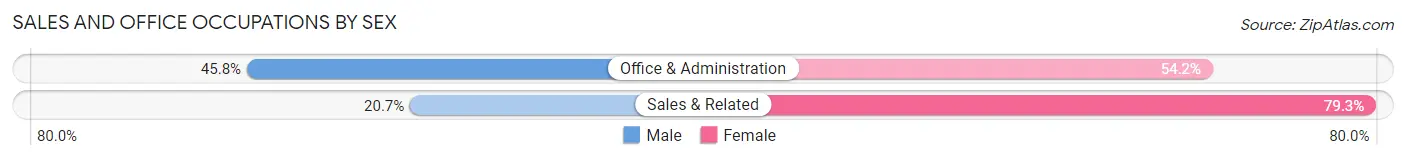
Sales and Office Occupations by Sex
| Occupation | Male | Female |
| Sales & Related | 60 (20.7%) | 230 (79.3%) |
| Office & Administration | 262 (45.8%) | 310 (54.2%) |
| Total (Category) | 322 (37.3%) | 540 (62.6%) |
| Total (Overall) | 1,279 (47.0%) | 1,443 (53.0%) |
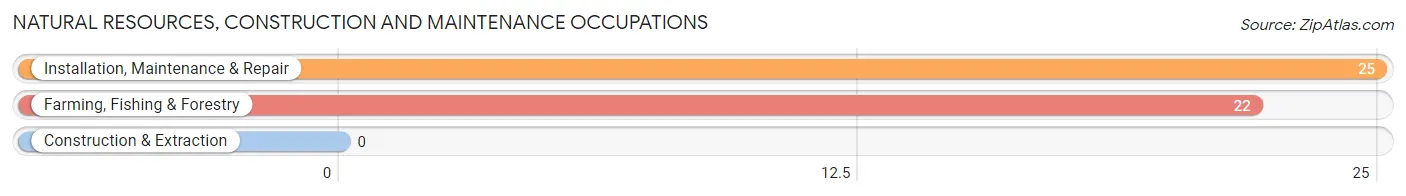
Natural Resources, Construction and Maintenance Occupations
The most common Natural Resources, Construction and Maintenance occupations in Stony Brook University are Installation, Maintenance & Repair (25 | 0.9%), and Farming, Fishing & Forestry (22 | 0.8%).
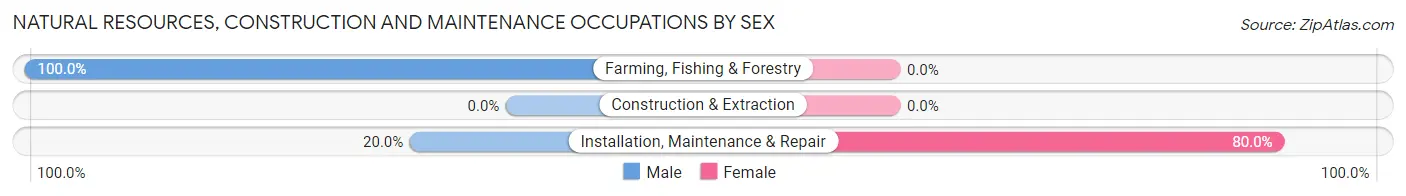
Natural Resources, Construction and Maintenance Occupations by Sex
| Occupation | Male | Female |
| Farming, Fishing & Forestry | 22 (100.0%) | 0 (0.0%) |
| Construction & Extraction | 0 (0.0%) | 0 (0.0%) |
| Installation, Maintenance & Repair | 5 (20.0%) | 20 (80.0%) |
| Total (Category) | 27 (57.5%) | 20 (42.5%) |
| Total (Overall) | 1,279 (47.0%) | 1,443 (53.0%) |
Production, Transportation and Moving Occupations
The most common Production, Transportation and Moving occupations in Stony Brook University are Production (20 | 0.7%), and Material Moving (5 | 0.2%).
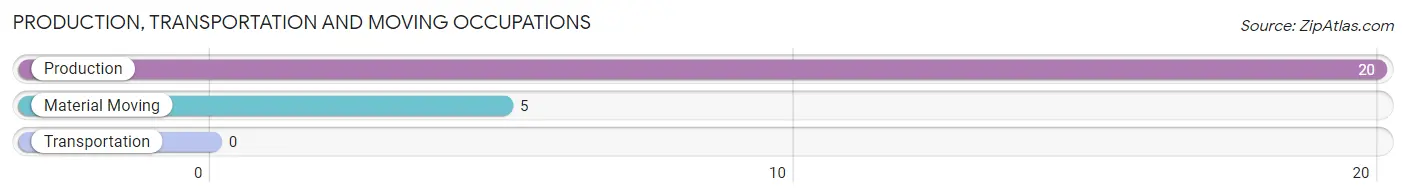
Production, Transportation and Moving Occupations by Sex
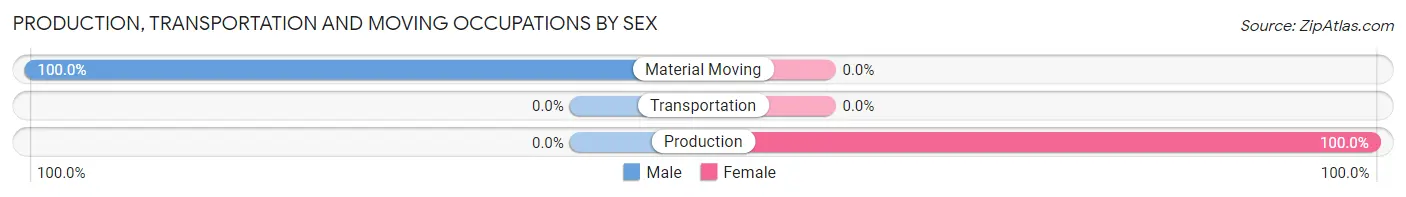
| Occupation | Male | Female |
| Production | 0 (0.0%) | 20 (100.0%) |
| Transportation | 0 (0.0%) | 0 (0.0%) |
| Material Moving | 5 (100.0%) | 0 (0.0%) |
| Total (Category) | 5 (20.0%) | 20 (80.0%) |
| Total (Overall) | 1,279 (47.0%) | 1,443 (53.0%) |
Employment Industries by Sex in Stony Brook University
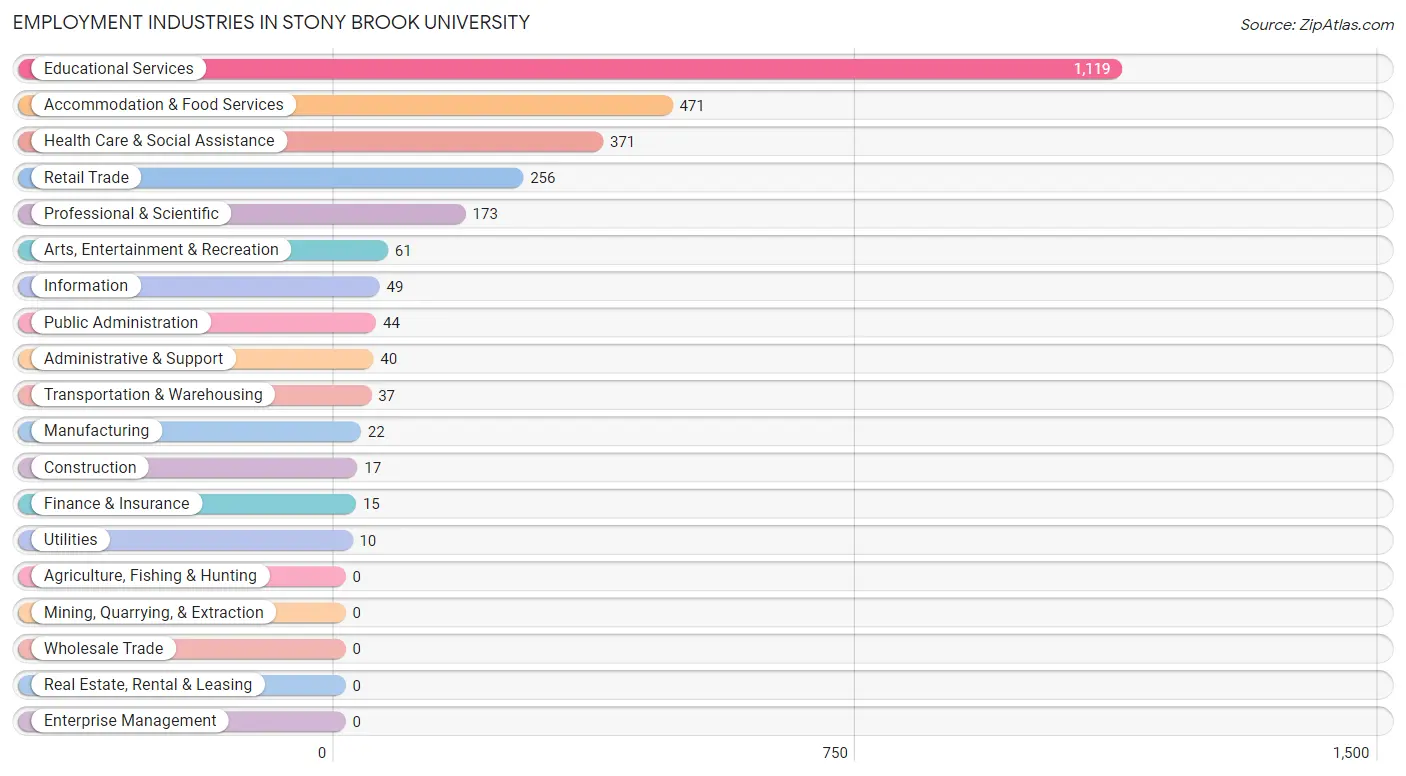
Employment Industries in Stony Brook University
The major employment industries in Stony Brook University include Educational Services (1,119 | 41.1%), Accommodation & Food Services (471 | 17.3%), Health Care & Social Assistance (371 | 13.6%), Retail Trade (256 | 9.4%), and Professional & Scientific (173 | 6.4%).
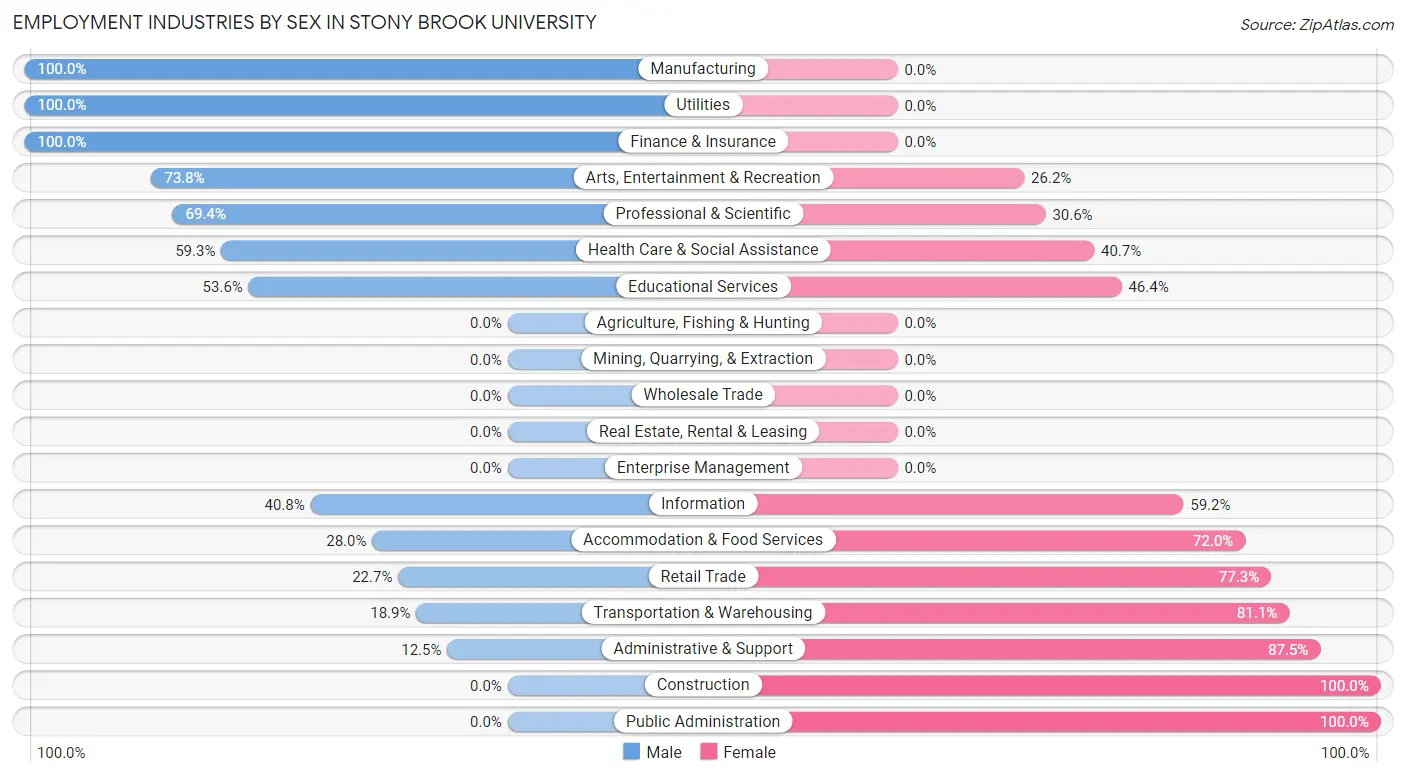
Employment Industries by Sex in Stony Brook University
The Stony Brook University industries that see more men than women are Manufacturing (100.0%), Utilities (100.0%), and Finance & Insurance (100.0%), whereas the industries that tend to have a higher number of women are Construction (100.0%), Public Administration (100.0%), and Administrative & Support (87.5%).
| Industry | Male | Female |
| Agriculture, Fishing & Hunting | 0 (0.0%) | 0 (0.0%) |
| Mining, Quarrying, & Extraction | 0 (0.0%) | 0 (0.0%) |
| Construction | 0 (0.0%) | 17 (100.0%) |
| Manufacturing | 22 (100.0%) | 0 (0.0%) |
| Wholesale Trade | 0 (0.0%) | 0 (0.0%) |
| Retail Trade | 58 (22.7%) | 198 (77.3%) |
| Transportation & Warehousing | 7 (18.9%) | 30 (81.1%) |
| Utilities | 10 (100.0%) | 0 (0.0%) |
| Information | 20 (40.8%) | 29 (59.2%) |
| Finance & Insurance | 15 (100.0%) | 0 (0.0%) |
| Real Estate, Rental & Leasing | 0 (0.0%) | 0 (0.0%) |
| Professional & Scientific | 120 (69.4%) | 53 (30.6%) |
| Enterprise Management | 0 (0.0%) | 0 (0.0%) |
| Administrative & Support | 5 (12.5%) | 35 (87.5%) |
| Educational Services | 600 (53.6%) | 519 (46.4%) |
| Health Care & Social Assistance | 220 (59.3%) | 151 (40.7%) |
| Arts, Entertainment & Recreation | 45 (73.8%) | 16 (26.2%) |
| Accommodation & Food Services | 132 (28.0%) | 339 (72.0%) |
| Public Administration | 0 (0.0%) | 44 (100.0%) |
| Total | 1,279 (47.0%) | 1,443 (53.0%) |
Education in Stony Brook University
School Enrollment in Stony Brook University
The most common levels of schooling among the 8,403 students in Stony Brook University are college / undergraduate (7,558 | 89.9%), and graduate / professional (845 | 10.1%).
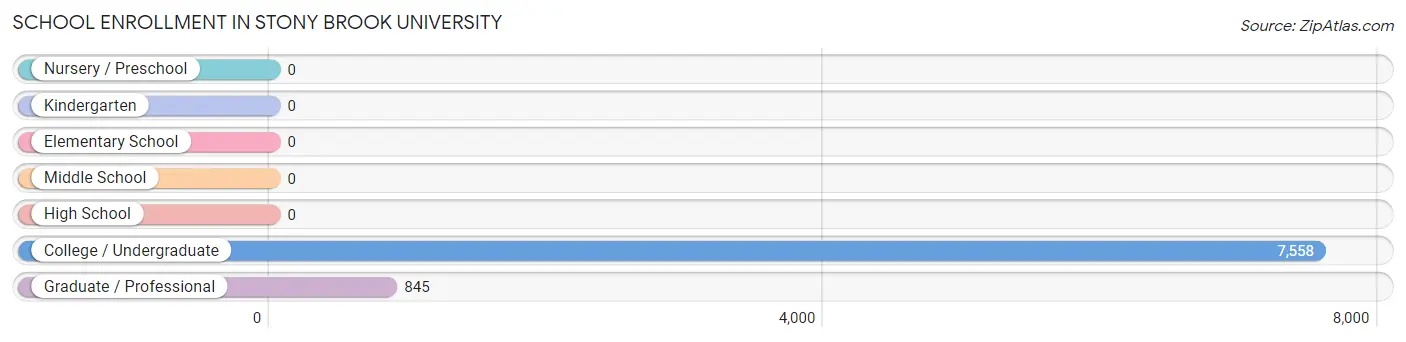
| School Level | # Students | % Students |
| Nursery / Preschool | 0 | 0.0% |
| Kindergarten | 0 | 0.0% |
| Elementary School | 0 | 0.0% |
| Middle School | 0 | 0.0% |
| High School | 0 | 0.0% |
| College / Undergraduate | 7,558 | 89.9% |
| Graduate / Professional | 845 | 10.1% |
| Total | 8,403 | 100.0% |
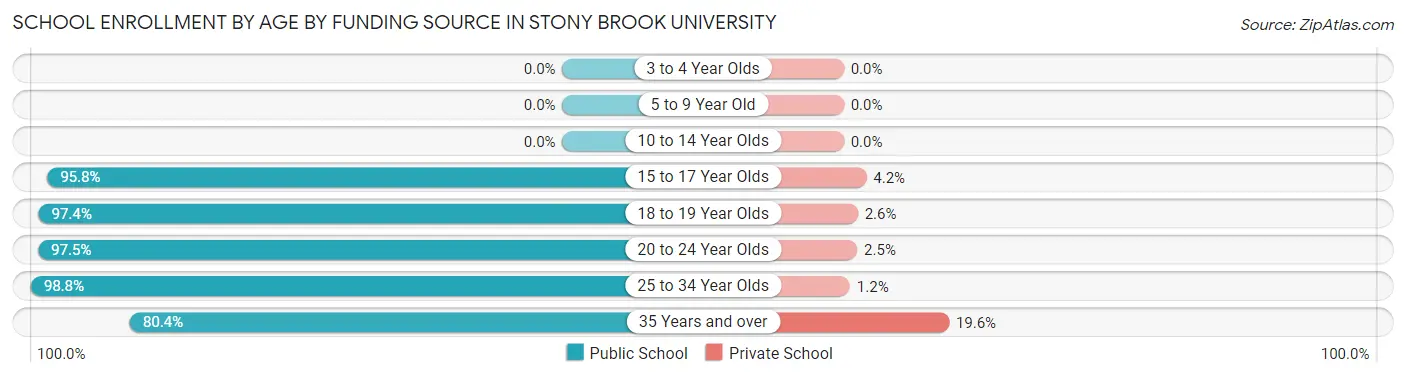
School Enrollment by Age by Funding Source in Stony Brook University
Out of a total of 8,403 students who are enrolled in schools in Stony Brook University, 218 (2.6%) attend a private institution, while the remaining 8,185 (97.4%) are enrolled in public schools. The age group of 35 years and over has the highest likelihood of being enrolled in private schools, with 10 (19.6% in the age bracket) enrolled. Conversely, the age group of 25 to 34 year olds has the lowest likelihood of being enrolled in a private school, with 425 (98.8% in the age bracket) attending a public institution.
| Age Bracket | Public School | Private School |
| 3 to 4 Year Olds | 0 (0.0%) | 0 (0.0%) |
| 5 to 9 Year Old | 0 (0.0%) | 0 (0.0%) |
| 10 to 14 Year Olds | 0 (0.0%) | 0 (0.0%) |
| 15 to 17 Year Olds | 159 (95.8%) | 7 (4.2%) |
| 18 to 19 Year Olds | 4,102 (97.4%) | 110 (2.6%) |
| 20 to 24 Year Olds | 3,455 (97.5%) | 89 (2.5%) |
| 25 to 34 Year Olds | 425 (98.8%) | 5 (1.2%) |
| 35 Years and over | 41 (80.4%) | 10 (19.6%) |
| Total | 8,185 (97.4%) | 218 (2.6%) |
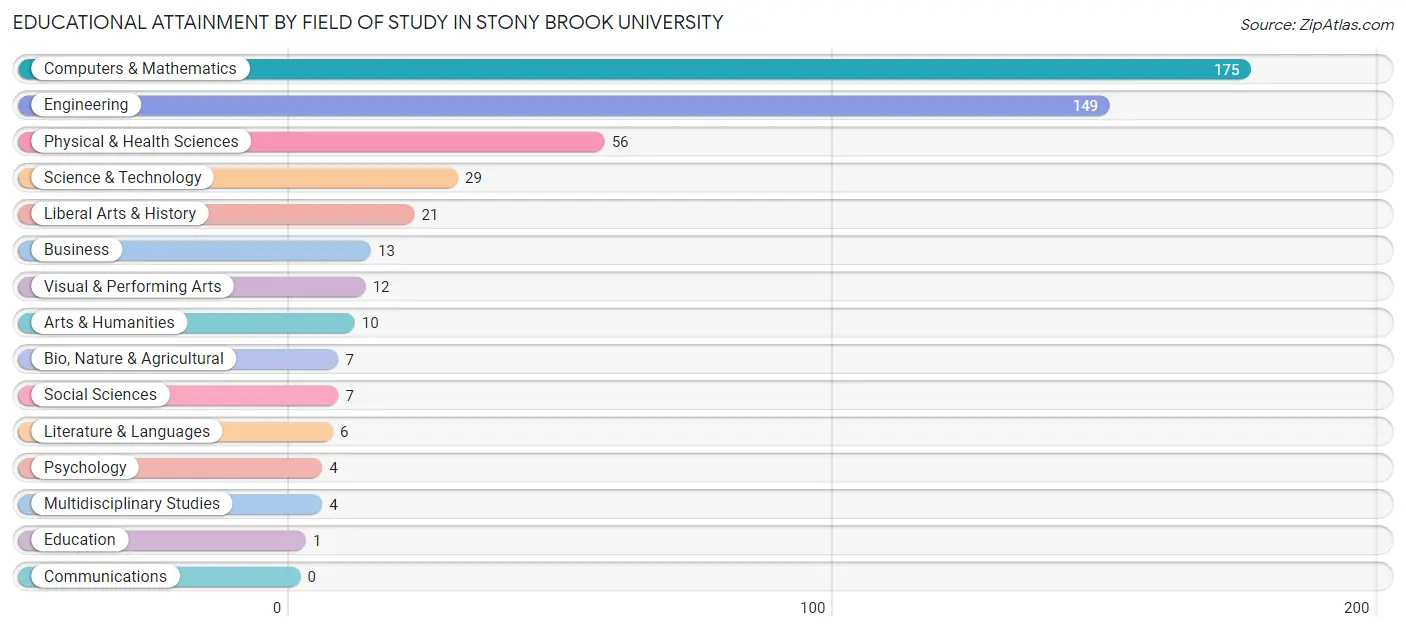
Educational Attainment by Field of Study in Stony Brook University
Computers & mathematics (175 | 35.4%), engineering (149 | 30.2%), physical & health sciences (56 | 11.3%), science & technology (29 | 5.9%), and liberal arts & history (21 | 4.3%) are the most common fields of study among 494 individuals in Stony Brook University who have obtained a bachelor's degree or higher.
| Field of Study | # Graduates | % Graduates |
| Computers & Mathematics | 175 | 35.4% |
| Bio, Nature & Agricultural | 7 | 1.4% |
| Physical & Health Sciences | 56 | 11.3% |
| Psychology | 4 | 0.8% |
| Social Sciences | 7 | 1.4% |
| Engineering | 149 | 30.2% |
| Multidisciplinary Studies | 4 | 0.8% |
| Science & Technology | 29 | 5.9% |
| Business | 13 | 2.6% |
| Education | 1 | 0.2% |
| Literature & Languages | 6 | 1.2% |
| Liberal Arts & History | 21 | 4.3% |
| Visual & Performing Arts | 12 | 2.4% |
| Communications | 0 | 0.0% |
| Arts & Humanities | 10 | 2.0% |
| Total | 494 | 100.0% |
Transportation & Commute in Stony Brook University
Vehicle Availability by Sex in Stony Brook University
| Vehicles Available | Male | Female |
| No Vehicle | 0 (0.0%) | 0 (0.0%) |
| 1 Vehicle | 0 (0.0%) | 0 (0.0%) |
| 2 Vehicles | 0 (0.0%) | 0 (0.0%) |
| 3 Vehicles | 0 (0.0%) | 0 (0.0%) |
| 4 Vehicles | 0 (0.0%) | 0 (0.0%) |
| 5 or more Vehicles | 0 (0.0%) | 0 (0.0%) |
| Total | 0 (0.0%) | 0 (0.0%) |
Commute Time in Stony Brook University
The most frequently occuring commute durations in Stony Brook University are 10 to 14 minutes (622 commuters, 25.6%), 5 to 9 minutes (475 commuters, 19.5%), and 15 to 19 minutes (399 commuters, 16.4%).
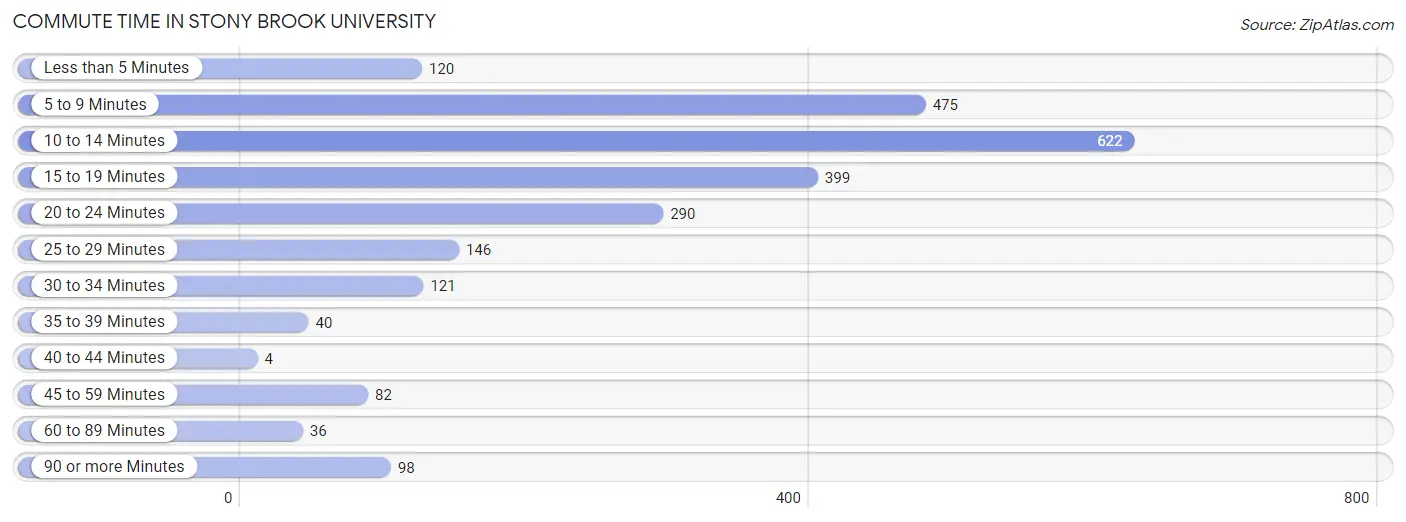
| Commute Time | # Commuters | % Commuters |
| Less than 5 Minutes | 120 | 4.9% |
| 5 to 9 Minutes | 475 | 19.5% |
| 10 to 14 Minutes | 622 | 25.6% |
| 15 to 19 Minutes | 399 | 16.4% |
| 20 to 24 Minutes | 290 | 11.9% |
| 25 to 29 Minutes | 146 | 6.0% |
| 30 to 34 Minutes | 121 | 5.0% |
| 35 to 39 Minutes | 40 | 1.6% |
| 40 to 44 Minutes | 4 | 0.2% |
| 45 to 59 Minutes | 82 | 3.4% |
| 60 to 89 Minutes | 36 | 1.5% |
| 90 or more Minutes | 98 | 4.0% |
Commute Time by Sex in Stony Brook University
The most common commute times in Stony Brook University are 10 to 14 minutes (270 commuters, 24.9%) for males and 10 to 14 minutes (352 commuters, 26.1%) for females.
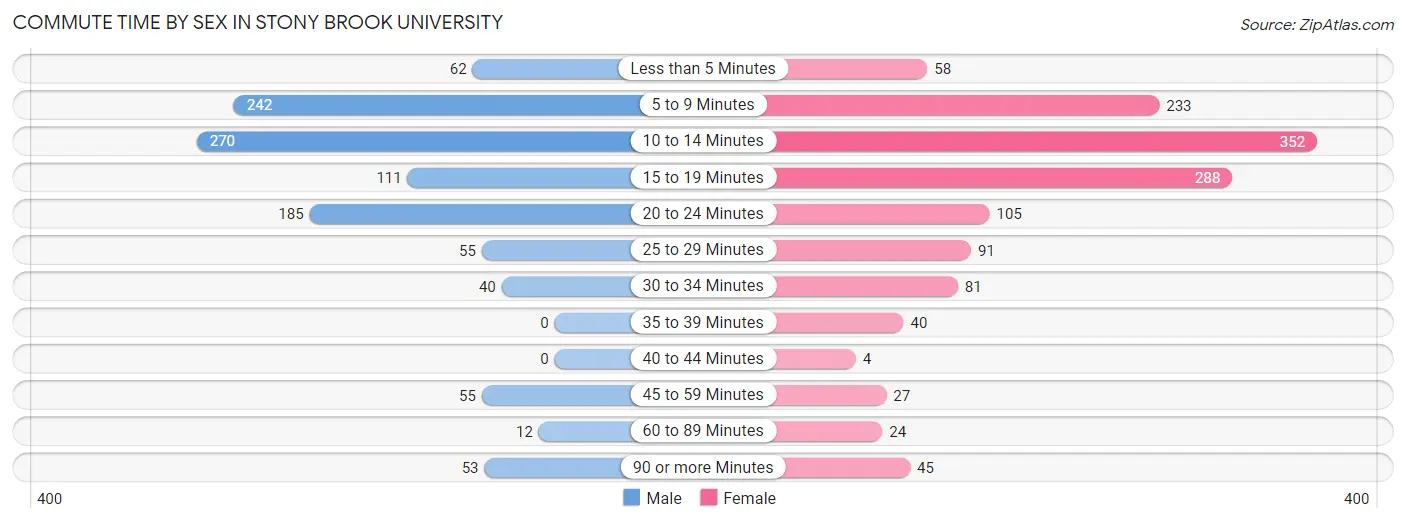
| Commute Time | Male | Female |
| Less than 5 Minutes | 62 (5.7%) | 58 (4.3%) |
| 5 to 9 Minutes | 242 (22.3%) | 233 (17.3%) |
| 10 to 14 Minutes | 270 (24.9%) | 352 (26.1%) |
| 15 to 19 Minutes | 111 (10.2%) | 288 (21.4%) |
| 20 to 24 Minutes | 185 (17.1%) | 105 (7.8%) |
| 25 to 29 Minutes | 55 (5.1%) | 91 (6.8%) |
| 30 to 34 Minutes | 40 (3.7%) | 81 (6.0%) |
| 35 to 39 Minutes | 0 (0.0%) | 40 (3.0%) |
| 40 to 44 Minutes | 0 (0.0%) | 4 (0.3%) |
| 45 to 59 Minutes | 55 (5.1%) | 27 (2.0%) |
| 60 to 89 Minutes | 12 (1.1%) | 24 (1.8%) |
| 90 or more Minutes | 53 (4.9%) | 45 (3.3%) |
Time of Departure to Work by Sex in Stony Brook University
The most frequent times of departure to work in Stony Brook University are 4:00 PM to 11:59 PM (207, 19.1%) for males and 12:00 PM to 3:59 PM (285, 21.1%) for females.
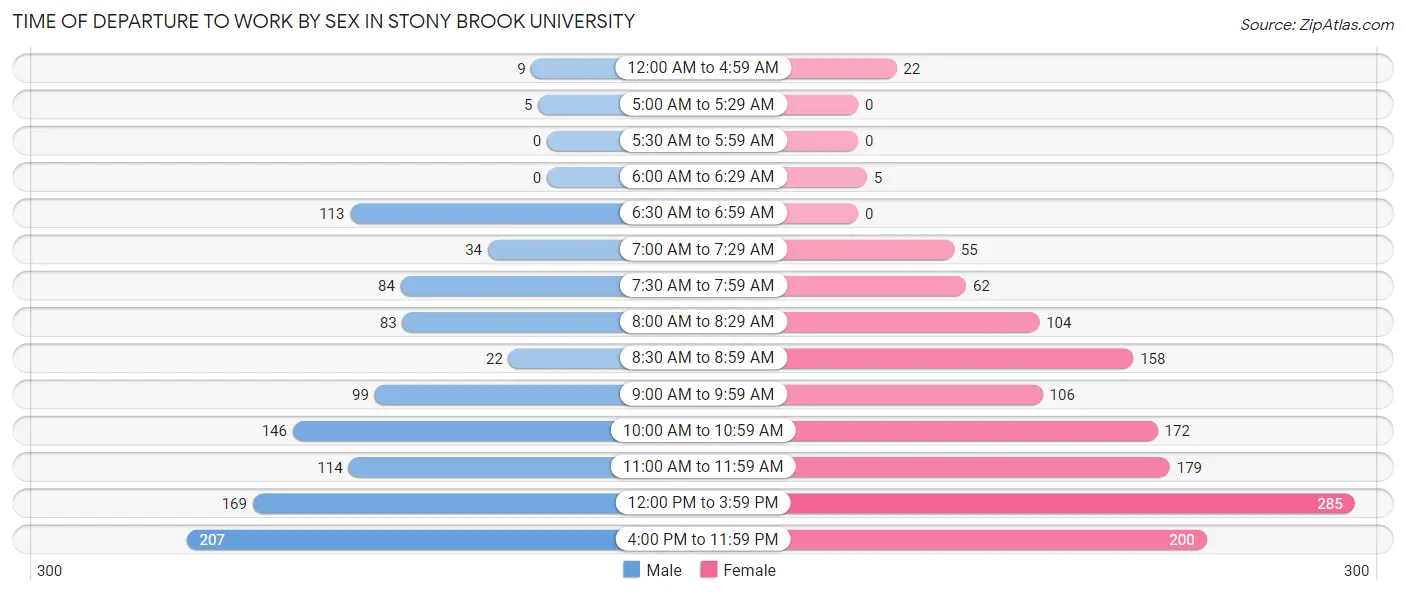
| Time of Departure | Male | Female |
| 12:00 AM to 4:59 AM | 9 (0.8%) | 22 (1.6%) |
| 5:00 AM to 5:29 AM | 5 (0.5%) | 0 (0.0%) |
| 5:30 AM to 5:59 AM | 0 (0.0%) | 0 (0.0%) |
| 6:00 AM to 6:29 AM | 0 (0.0%) | 5 (0.4%) |
| 6:30 AM to 6:59 AM | 113 (10.4%) | 0 (0.0%) |
| 7:00 AM to 7:29 AM | 34 (3.1%) | 55 (4.1%) |
| 7:30 AM to 7:59 AM | 84 (7.7%) | 62 (4.6%) |
| 8:00 AM to 8:29 AM | 83 (7.6%) | 104 (7.7%) |
| 8:30 AM to 8:59 AM | 22 (2.0%) | 158 (11.7%) |
| 9:00 AM to 9:59 AM | 99 (9.1%) | 106 (7.9%) |
| 10:00 AM to 10:59 AM | 146 (13.5%) | 172 (12.8%) |
| 11:00 AM to 11:59 AM | 114 (10.5%) | 179 (13.3%) |
| 12:00 PM to 3:59 PM | 169 (15.6%) | 285 (21.1%) |
| 4:00 PM to 11:59 PM | 207 (19.1%) | 200 (14.8%) |
| Total | 1,085 (100.0%) | 1,348 (100.0%) |
Housing Occupancy in Stony Brook University
Occupancy by Ownership in Stony Brook University
| Occupancy | # Housing Units | % Housing Units |
| Owner Occupied Housing Units | 0 | 0.0% |
| Renter-Occupied Housing Units | 0 | 0.0% |
| Total Occupied Housing Units | 0 | 0.0% |
Occupancy by Household Size in Stony Brook University
| Household Size | # Housing Units | % Housing Units |
| 1-Person Household | 0 | 0.0% |
| 2-Person Household | 0 | 0.0% |
| 3-Person Household | 0 | 0.0% |
| 4+ Person Household | 0 | 0.0% |
| Total Housing Units | 0 | 0.0% |
Occupancy by Ownership by Household Size in Stony Brook University
| Household Size | Owner-occupied | Renter-occupied |
| 1-Person Household | 0 (0.0%) | 0 (0.0%) |
| 2-Person Household | 0 (0.0%) | 0 (0.0%) |
| 3-Person Household | 0 (0.0%) | 0 (0.0%) |
| 4+ Person Household | 0 (0.0%) | 0 (0.0%) |
| Total Housing Units | 0 (0.0%) | 0 (0.0%) |
Occupancy by Educational Attainment in Stony Brook University
| Household Size | Owner-occupied | Renter-occupied |
| Less than High School | 0 (0.0%) | 0 (0.0%) |
| High School Diploma | 0 (0.0%) | 0 (0.0%) |
| College/Associate Degree | 0 (0.0%) | 0 (0.0%) |
| Bachelor's Degree or higher | 0 (0.0%) | 0 (0.0%) |
Occupancy by Age of Householder in Stony Brook University
| Age Bracket | # Households | % Households |
| Under 35 Years | 0 | 0.0% |
| 35 to 44 Years | 0 | 0.0% |
| 45 to 54 Years | 0 | 0.0% |
| 55 to 64 Years | 0 | 0.0% |
| 65 to 74 Years | 0 | 0.0% |
| 75 to 84 Years | 0 | 0.0% |
| 85 Years and Over | 0 | 0.0% |
| Total | 0 | 0.0% |
Housing Finances in Stony Brook University
Median Income by Occupancy in Stony Brook University
| Occupancy Type | # Households | Median Income |
| Owner-Occupied | 0 (0.0%) | $0 |
| Renter-Occupied | 0 (0.0%) | $0 |
| Average | 0 (0.0%) | $0 |
Occupancy by Householder Income Bracket in Stony Brook University
| Income Bracket | Owner-occupied | Renter-occupied |
| Less than $5,000 | 0 (0.0%) | 0 (0.0%) |
| $5,000 to $9,999 | 0 (0.0%) | 0 (0.0%) |
| $10,000 to $14,999 | 0 (0.0%) | 0 (0.0%) |
| $15,000 to $19,999 | 0 (0.0%) | 0 (0.0%) |
| $20,000 to $24,999 | 0 (0.0%) | 0 (0.0%) |
| $25,000 to $34,999 | 0 (0.0%) | 0 (0.0%) |
| $35,000 to $49,999 | 0 (0.0%) | 0 (0.0%) |
| $50,000 to $74,999 | 0 (0.0%) | 0 (0.0%) |
| $75,000 to $99,999 | 0 (0.0%) | 0 (0.0%) |
| $100,000 to $149,999 | 0 (0.0%) | 0 (0.0%) |
| $150,000 or more | 0 (0.0%) | 0 (0.0%) |
| Total | 0 (0.0%) | 0 (0.0%) |
Monthly Housing Cost Tiers in Stony Brook University
| Monthly Cost | Owner-occupied | Renter-occupied |
| Less than $300 | 0 (0.0%) | 0 (0.0%) |
| $300 to $499 | 0 (0.0%) | 0 (0.0%) |
| $500 to $799 | 0 (0.0%) | 0 (0.0%) |
| $800 to $999 | 0 (0.0%) | 0 (0.0%) |
| $1,000 to $1,499 | 0 (0.0%) | 0 (0.0%) |
| $1,500 to $1,999 | 0 (0.0%) | 0 (0.0%) |
| $2,000 to $2,499 | 0 (0.0%) | 0 (0.0%) |
| $2,500 to $2,999 | 0 (0.0%) | 0 (0.0%) |
| $3,000 or more | 0 (0.0%) | 0 (0.0%) |
| Total | 0 (0.0%) | 0 (0.0%) |
Physical Housing Characteristics in Stony Brook University
Housing Structures in Stony Brook University
| Structure Type | # Housing Units | % Housing Units |
| Single Unit, Detached | 0 | 0.0% |
| Single Unit, Attached | 0 | 0.0% |
| 2 Unit Apartments | 0 | 0.0% |
| 3 or 4 Unit Apartments | 0 | 0.0% |
| 5 to 9 Unit Apartments | 0 | 0.0% |
| 10 or more Apartments | 0 | 0.0% |
| Mobile Home / Other | 0 | 0.0% |
| Total | 0 | 0.0% |
Housing Structures by Occupancy in Stony Brook University
| Structure Type | Owner-occupied | Renter-occupied |
| Single Unit, Detached | 0 (0.0%) | 0 (0.0%) |
| Single Unit, Attached | 0 (0.0%) | 0 (0.0%) |
| 2 Unit Apartments | 0 (0.0%) | 0 (0.0%) |
| 3 or 4 Unit Apartments | 0 (0.0%) | 0 (0.0%) |
| 5 to 9 Unit Apartments | 0 (0.0%) | 0 (0.0%) |
| 10 or more Apartments | 0 (0.0%) | 0 (0.0%) |
| Mobile Home / Other | 0 (0.0%) | 0 (0.0%) |
| Total | 0 (0.0%) | 0 (0.0%) |
Housing Structures by Number of Rooms in Stony Brook University
| Number of Rooms | Owner-occupied | Renter-occupied |
| 1 Room | 0 (0.0%) | 0 (0.0%) |
| 2 or 3 Rooms | 0 (0.0%) | 0 (0.0%) |
| 4 or 5 Rooms | 0 (0.0%) | 0 (0.0%) |
| 6 or 7 Rooms | 0 (0.0%) | 0 (0.0%) |
| 8 or more Rooms | 0 (0.0%) | 0 (0.0%) |
| Total | 0 (0.0%) | 0 (0.0%) |
Housing Structure by Heating Type in Stony Brook University
| Heating Type | Owner-occupied | Renter-occupied |
| Utility Gas | 0 (0.0%) | 0 (0.0%) |
| Bottled, Tank, or LP Gas | 0 (0.0%) | 0 (0.0%) |
| Electricity | 0 (0.0%) | 0 (0.0%) |
| Fuel Oil or Kerosene | 0 (0.0%) | 0 (0.0%) |
| Coal or Coke | 0 (0.0%) | 0 (0.0%) |
| All other Fuels | 0 (0.0%) | 0 (0.0%) |
| No Fuel Used | 0 (0.0%) | 0 (0.0%) |
| Total | 0 (0.0%) | 0 (0.0%) |
Household Vehicle Usage in Stony Brook University
| Vehicles per Household | Owner-occupied | Renter-occupied |
| No Vehicle | 0 (0.0%) | 0 (0.0%) |
| 1 Vehicle | 0 (0.0%) | 0 (0.0%) |
| 2 Vehicles | 0 (0.0%) | 0 (0.0%) |
| 3 or more Vehicles | 0 (0.0%) | 0 (0.0%) |
| Total | 0 (0.0%) | 0 (0.0%) |
Real Estate & Mortgages in Stony Brook University
Real Estate and Mortgage Overview in Stony Brook University
| Characteristic | Without Mortgage | With Mortgage |
| Housing Units | 0 | 0 |
| Median Property Value | - | - |
| Median Household Income | - | - |
| Monthly Housing Costs | - | - |
| Real Estate Taxes | - | - |
Property Value by Mortgage Status in Stony Brook University
| Property Value | Without Mortgage | With Mortgage |
| Less than $50,000 | 0 (0.0%) | 0 (0.0%) |
| $50,000 to $99,999 | 0 (0.0%) | 0 (0.0%) |
| $100,000 to $299,999 | 0 (0.0%) | 0 (0.0%) |
| $300,000 to $499,999 | 0 (0.0%) | 0 (0.0%) |
| $500,000 to $749,999 | 0 (0.0%) | 0 (0.0%) |
| $750,000 to $999,999 | 0 (0.0%) | 0 (0.0%) |
| $1,000,000 or more | 0 (0.0%) | 0 (0.0%) |
| Total | 0 (0.0%) | 0 (0.0%) |
Household Income by Mortgage Status in Stony Brook University
| Household Income | Without Mortgage | With Mortgage |
| Less than $10,000 | 0 (0.0%) | 0 (0.0%) |
| $10,000 to $24,999 | 0 (0.0%) | 0 (0.0%) |
| $25,000 to $34,999 | 0 (0.0%) | 0 (0.0%) |
| $35,000 to $49,999 | 0 (0.0%) | 0 (0.0%) |
| $50,000 to $74,999 | 0 (0.0%) | 0 (0.0%) |
| $75,000 to $99,999 | 0 (0.0%) | 0 (0.0%) |
| $100,000 to $149,999 | 0 (0.0%) | 0 (0.0%) |
| $150,000 or more | 0 (0.0%) | 0 (0.0%) |
| Total | 0 (0.0%) | 0 (0.0%) |
Property Value to Household Income Ratio in Stony Brook University
| Value-to-Income Ratio | Without Mortgage | With Mortgage |
| Less than 2.0x | 0 (0.0%) | 0 (0.0%) |
| 2.0x to 2.9x | 0 (0.0%) | 0 (0.0%) |
| 3.0x to 3.9x | 0 (0.0%) | 0 (0.0%) |
| 4.0x or more | 0 (0.0%) | 0 (0.0%) |
| Total | 0 (0.0%) | 0 (0.0%) |
Real Estate Taxes by Mortgage Status in Stony Brook University
| Property Taxes | Without Mortgage | With Mortgage |
| Less than $800 | 0 (0.0%) | 0 (0.0%) |
| $800 to $1,499 | 0 (0.0%) | 0 (0.0%) |
| $800 to $1,499 | 0 (0.0%) | 0 (0.0%) |
| Total | 0 (0.0%) | 0 (0.0%) |
Health & Disability in Stony Brook University
Health Insurance Coverage by Age in Stony Brook University
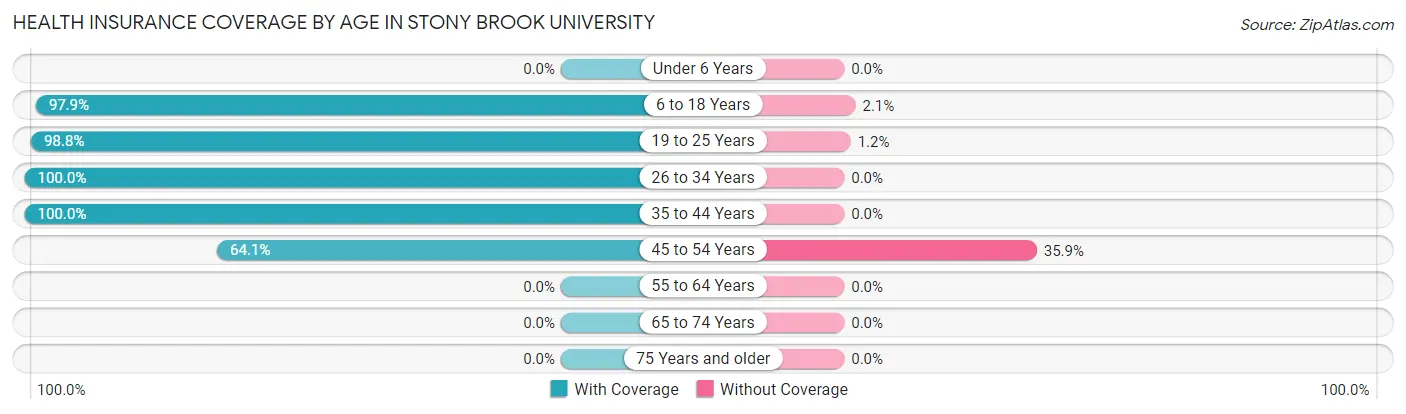
| Age Bracket | With Coverage | Without Coverage |
| Under 6 Years | 0 (0.0%) | 0 (0.0%) |
| 6 to 18 Years | 2,661 (97.9%) | 57 (2.1%) |
| 19 to 25 Years | 5,341 (98.8%) | 65 (1.2%) |
| 26 to 34 Years | 262 (100.0%) | 0 (0.0%) |
| 35 to 44 Years | 32 (100.0%) | 0 (0.0%) |
| 45 to 54 Years | 25 (64.1%) | 14 (35.9%) |
| 55 to 64 Years | 0 (0.0%) | 0 (0.0%) |
| 65 to 74 Years | 0 (0.0%) | 0 (0.0%) |
| 75 Years and older | 0 (0.0%) | 0 (0.0%) |
| Total | 8,321 (98.4%) | 136 (1.6%) |
Health Insurance Coverage by Citizenship Status in Stony Brook University
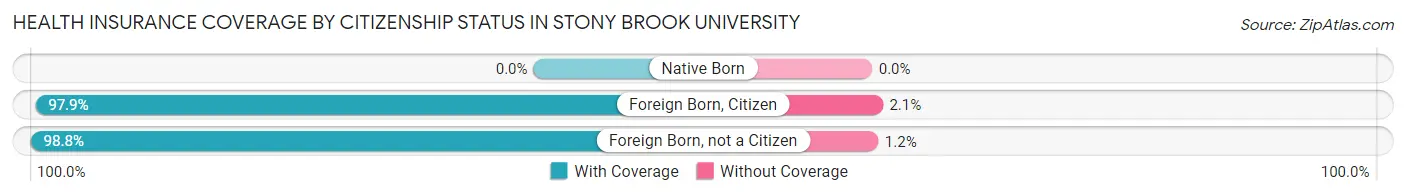
| Citizenship Status | With Coverage | Without Coverage |
| Native Born | 0 (0.0%) | 0 (0.0%) |
| Foreign Born, Citizen | 2,661 (97.9%) | 57 (2.1%) |
| Foreign Born, not a Citizen | 5,341 (98.8%) | 65 (1.2%) |
Health Insurance Coverage by Household Income in Stony Brook University
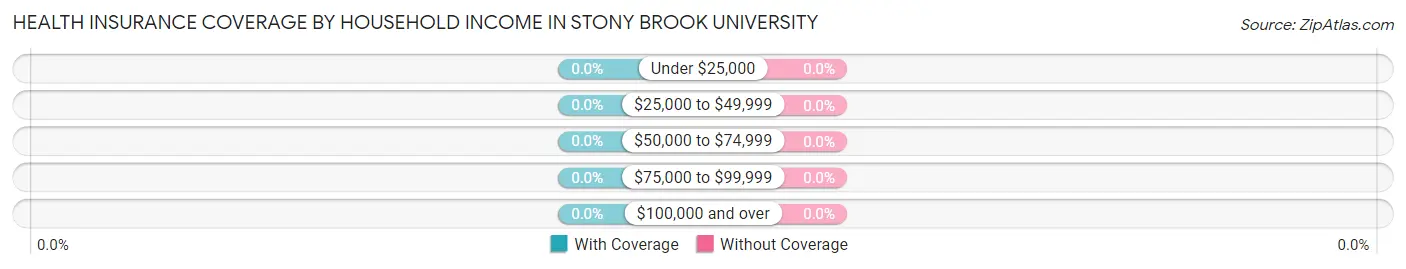
| Household Income | With Coverage | Without Coverage |
| Under $25,000 | 0 (0.0%) | 0 (0.0%) |
| $25,000 to $49,999 | 0 (0.0%) | 0 (0.0%) |
| $50,000 to $74,999 | 0 (0.0%) | 0 (0.0%) |
| $75,000 to $99,999 | 0 (0.0%) | 0 (0.0%) |
| $100,000 and over | 0 (0.0%) | 0 (0.0%) |
Public vs Private Health Insurance Coverage by Age in Stony Brook University
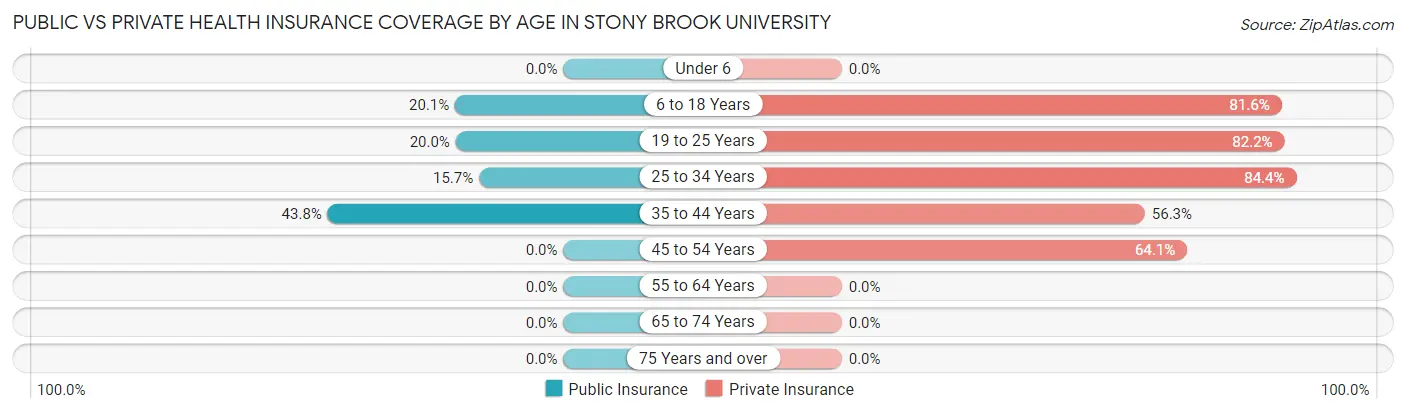
| Age Bracket | Public Insurance | Private Insurance |
| Under 6 | 0 (0.0%) | 0 (0.0%) |
| 6 to 18 Years | 546 (20.1%) | 2,219 (81.6%) |
| 19 to 25 Years | 1,080 (20.0%) | 4,441 (82.2%) |
| 25 to 34 Years | 41 (15.7%) | 221 (84.4%) |
| 35 to 44 Years | 14 (43.8%) | 18 (56.2%) |
| 45 to 54 Years | 0 (0.0%) | 25 (64.1%) |
| 55 to 64 Years | 0 (0.0%) | 0 (0.0%) |
| 65 to 74 Years | 0 (0.0%) | 0 (0.0%) |
| 75 Years and over | 0 (0.0%) | 0 (0.0%) |
| Total | 1,681 (19.9%) | 6,924 (81.9%) |
Disability Status by Sex by Age in Stony Brook University
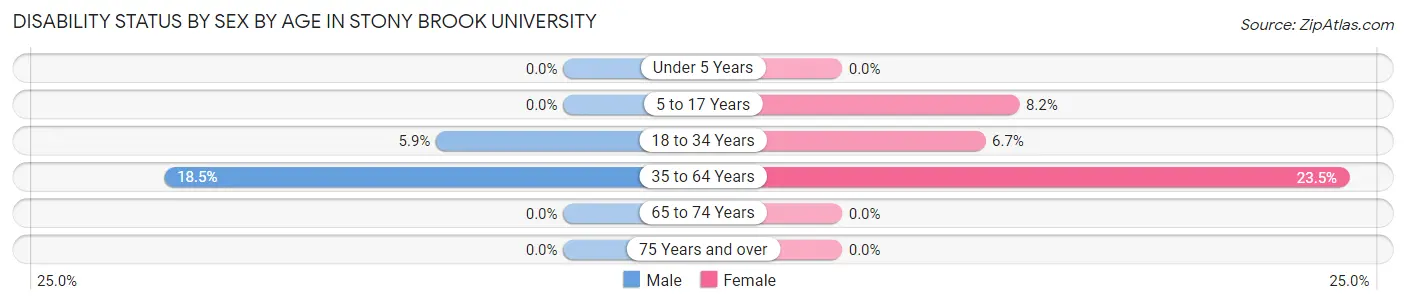
| Age Bracket | Male | Female |
| Under 5 Years | 0 (0.0%) | 0 (0.0%) |
| 5 to 17 Years | 0 (0.0%) | 6 (8.2%) |
| 18 to 34 Years | 240 (5.9%) | 276 (6.7%) |
| 35 to 64 Years | 10 (18.5%) | 4 (23.5%) |
| 65 to 74 Years | 0 (0.0%) | 0 (0.0%) |
| 75 Years and over | 0 (0.0%) | 0 (0.0%) |
Disability Class by Sex by Age in Stony Brook University
Disability Class: Hearing Difficulty
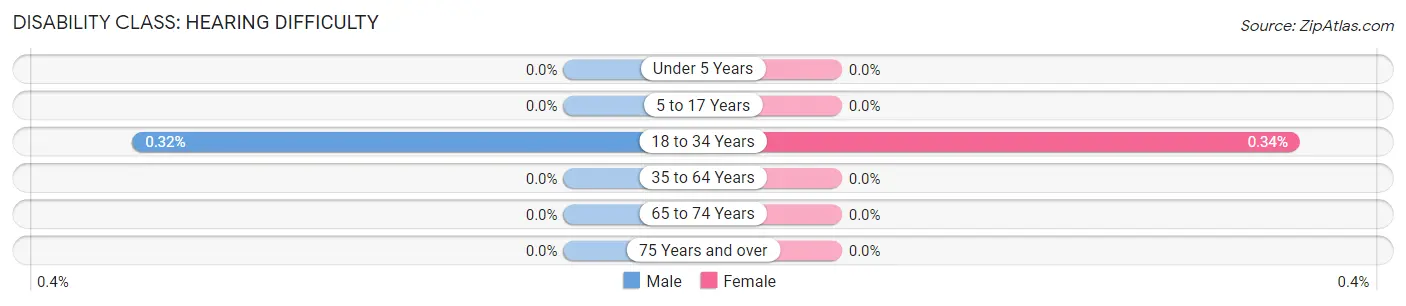
| Age Bracket | Male | Female |
| Under 5 Years | 0 (0.0%) | 0 (0.0%) |
| 5 to 17 Years | 0 (0.0%) | 0 (0.0%) |
| 18 to 34 Years | 13 (0.3%) | 14 (0.3%) |
| 35 to 64 Years | 0 (0.0%) | 0 (0.0%) |
| 65 to 74 Years | 0 (0.0%) | 0 (0.0%) |
| 75 Years and over | 0 (0.0%) | 0 (0.0%) |
Disability Class: Vision Difficulty
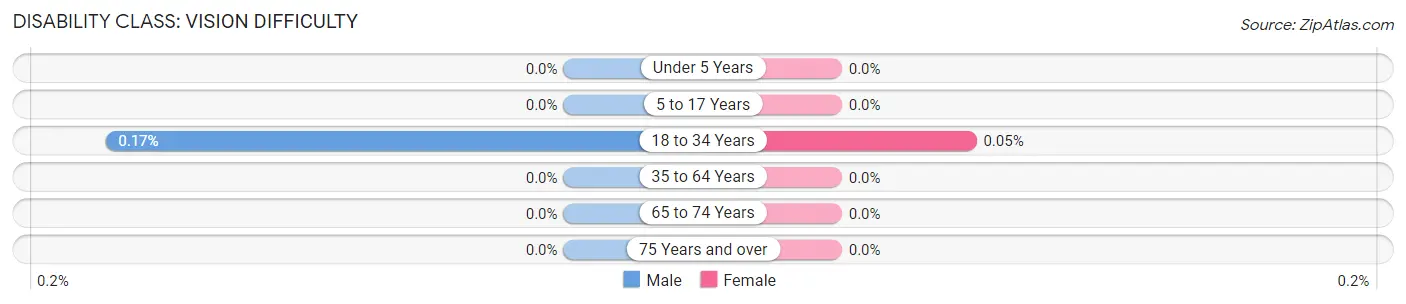
| Age Bracket | Male | Female |
| Under 5 Years | 0 (0.0%) | 0 (0.0%) |
| 5 to 17 Years | 0 (0.0%) | 0 (0.0%) |
| 18 to 34 Years | 7 (0.2%) | 2 (0.1%) |
| 35 to 64 Years | 0 (0.0%) | 0 (0.0%) |
| 65 to 74 Years | 0 (0.0%) | 0 (0.0%) |
| 75 Years and over | 0 (0.0%) | 0 (0.0%) |
Disability Class: Cognitive Difficulty
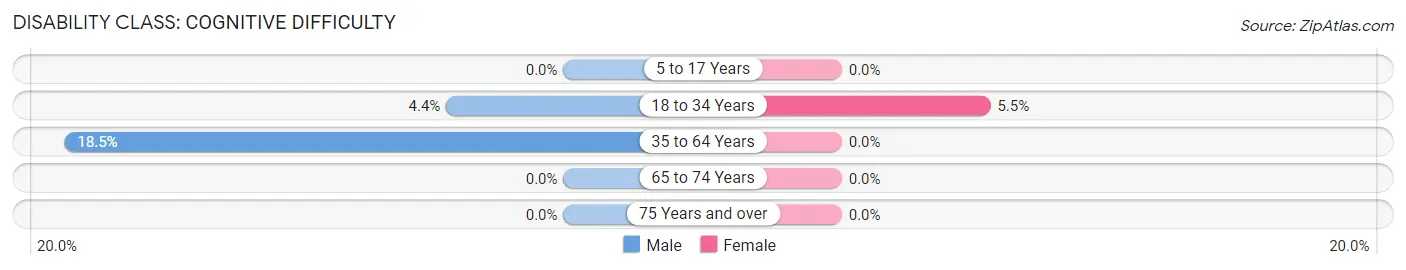
| Age Bracket | Male | Female |
| 5 to 17 Years | 0 (0.0%) | 0 (0.0%) |
| 18 to 34 Years | 177 (4.3%) | 229 (5.5%) |
| 35 to 64 Years | 10 (18.5%) | 0 (0.0%) |
| 65 to 74 Years | 0 (0.0%) | 0 (0.0%) |
| 75 Years and over | 0 (0.0%) | 0 (0.0%) |
Disability Class: Ambulatory Difficulty
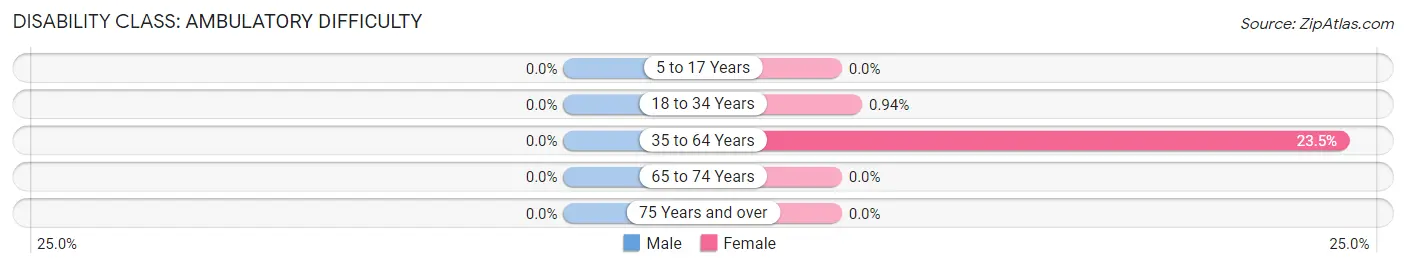
| Age Bracket | Male | Female |
| 5 to 17 Years | 0 (0.0%) | 0 (0.0%) |
| 18 to 34 Years | 0 (0.0%) | 39 (0.9%) |
| 35 to 64 Years | 0 (0.0%) | 4 (23.5%) |
| 65 to 74 Years | 0 (0.0%) | 0 (0.0%) |
| 75 Years and over | 0 (0.0%) | 0 (0.0%) |
Disability Class: Self-Care Difficulty
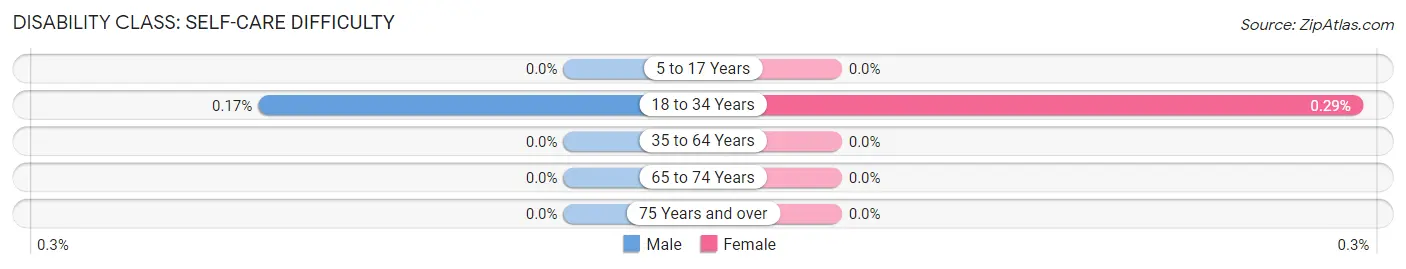
| Age Bracket | Male | Female |
| 5 to 17 Years | 0 (0.0%) | 0 (0.0%) |
| 18 to 34 Years | 7 (0.2%) | 12 (0.3%) |
| 35 to 64 Years | 0 (0.0%) | 0 (0.0%) |
| 65 to 74 Years | 0 (0.0%) | 0 (0.0%) |
| 75 Years and over | 0 (0.0%) | 0 (0.0%) |
Technology Access in Stony Brook University
Computing Device Access in Stony Brook University
| Device Type | # Households | % Households |
| Desktop or Laptop | 0 | 0.0% |
| Smartphone | 0 | 0.0% |
| Tablet | 0 | 0.0% |
| No Computing Device | 0 | 0.0% |
| Total | 0 | 0.0% |
Internet Access in Stony Brook University
| Internet Type | # Households | % Households |
| Dial-Up Internet | 0 | 0.0% |
| Broadband Home | 0 | 0.0% |
| Cellular Data Only | 0 | 0.0% |
| Satellite Internet | 0 | 0.0% |
| No Internet | 0 | 0.0% |
| Total | 0 | 0.0% |
Stony Brook University Summary
Stony Brook University is located in Stony Brook, New York, on the north shore of Long Island. It is a public research university and part of the State University of New York (SUNY) system. Founded in 1957, Stony Brook University is one of the four university centers of the SUNY system. It is a comprehensive research university with a strong emphasis on undergraduate education.
History
Stony Brook University was founded in 1957 as the State University College on Long Island. It was established as a response to the need for higher education on Long Island, which had grown significantly in the post-World War II era. The college was initially located in Oyster Bay, but moved to its current location in 1962. In 1965, the college was renamed the State University of New York at Stony Brook. In 1966, the university was designated a doctoral-granting institution and began offering graduate degrees. In 2001, the university was renamed Stony Brook University.
Geography
Stony Brook University is located in Stony Brook, New York, on the north shore of Long Island. It is situated on a 1,000-acre campus, which includes a nature preserve, a marine science center, and a wildlife sanctuary. The university is located approximately 60 miles east of New York City.
Economy
Stony Brook University is a major economic engine for the region. The university has an annual economic impact of $4.3 billion, and it supports more than 30,000 jobs in the region. The university also contributes to the local economy through its research and development activities, which generate more than $1 billion in economic activity each year.
Demographics
As of fall 2020, Stony Brook University had a total enrollment of 25,845 students. The student body is diverse, with students from all 50 states and more than 100 countries. The student body is also diverse in terms of race and ethnicity, with students from a variety of backgrounds. The university also has a large international student population, with more than 4,000 international students enrolled.
Common Questions
What is Per Capita Income in Stony Brook University?
Per Capita income in Stony Brook University is $6,086.
What is Income or Wage Gap in Stony Brook University?
Income or Wage Gap in Stony Brook University is 33.9%.
Women in Stony Brook University earn 66.1 cents for every dollar earned by a man.
What is the Total Population of Stony Brook University?
Total Population of Stony Brook University is 8,755.
What is the Total Male Population of Stony Brook University?
Total Male Population of Stony Brook University is 4,459.
What is the Total Female Population of Stony Brook University?
Total Female Population of Stony Brook University is 4,296.
What is the Ratio of Males per 100 Females in Stony Brook University?
There are 103.79 Males per 100 Females in Stony Brook University.
What is the Ratio of Females per 100 Males in Stony Brook University?
There are 96.34 Females per 100 Males in Stony Brook University.
What is the Median Population Age in Stony Brook University?
Median Population Age in Stony Brook University is 20.0 Years.
How Large is the Labor Force in Stony Brook University?
There are 3,117 People in the Labor Forcein in Stony Brook University.
What is the Percentage of People in the Labor Force in Stony Brook University?
35.6% of People are in the Labor Force in Stony Brook University.
What is the Unemployment Rate in Stony Brook University?
Unemployment Rate in Stony Brook University is 12.6%.