Potsdam, NY Map & Demographics
Potsdam Map
Potsdam Overview
$21,008
PER CAPITA INCOME
$79,097
AVG FAMILY INCOME
$31,584
AVG HOUSEHOLD INCOME
22.4%
WAGE / INCOME GAP [ % ]
77.6¢/ $1
WAGE / INCOME GAP [ $ ]
$9,763
FAMILY INCOME DEFICIT
0.55
INEQUALITY / GINI INDEX
8,570
TOTAL POPULATION
4,674
MALE POPULATION
3,896
FEMALE POPULATION
119.97
MALES / 100 FEMALES
83.35
FEMALES / 100 MALES
21.7
MEDIAN AGE
2.7
AVG FAMILY SIZE
1.8
AVG HOUSEHOLD SIZE
3,880
LABOR FORCE [ PEOPLE ]
47.9%
PERCENT IN LABOR FORCE
9.3%
UNEMPLOYMENT RATE
Potsdam Area Codes
Income in Potsdam
Income Overview in Potsdam
Per Capita Income in Potsdam is $21,008, while median incomes of families and households are $79,097 and $31,584 respectively.
| Characteristic | Number | Measure |
| Per Capita Income | 8,570 | $21,008 |
| Median Family Income | 851 | $79,097 |
| Mean Family Income | 851 | $113,106 |
| Median Household Income | 2,575 | $31,584 |
| Mean Household Income | 2,575 | $59,580 |
| Income Deficit | 851 | $9,763 |
| Wage / Income Gap (%) | 8,570 | 22.42% |
| Wage / Income Gap ($) | 8,570 | 77.58¢ per $1 |
| Gini / Inequality Index | 8,570 | 0.55 |
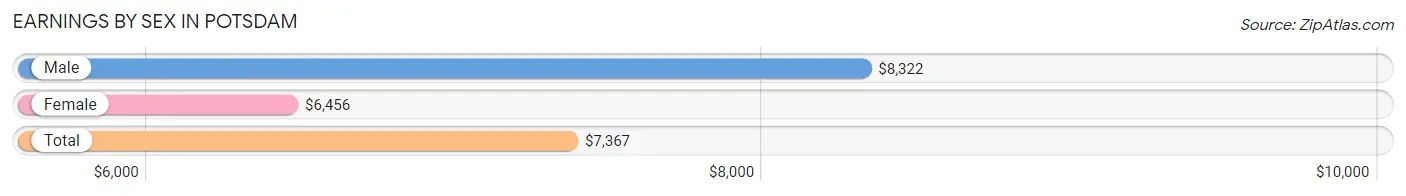
Earnings by Sex in Potsdam
Average Earnings in Potsdam are $7,367, $8,322 for men and $6,456 for women, a difference of 22.4%.
| Sex | Number | Average Earnings |
| Male | 3,384 (59.2%) | $8,322 |
| Female | 2,328 (40.8%) | $6,456 |
| Total | 5,712 (100.0%) | $7,367 |
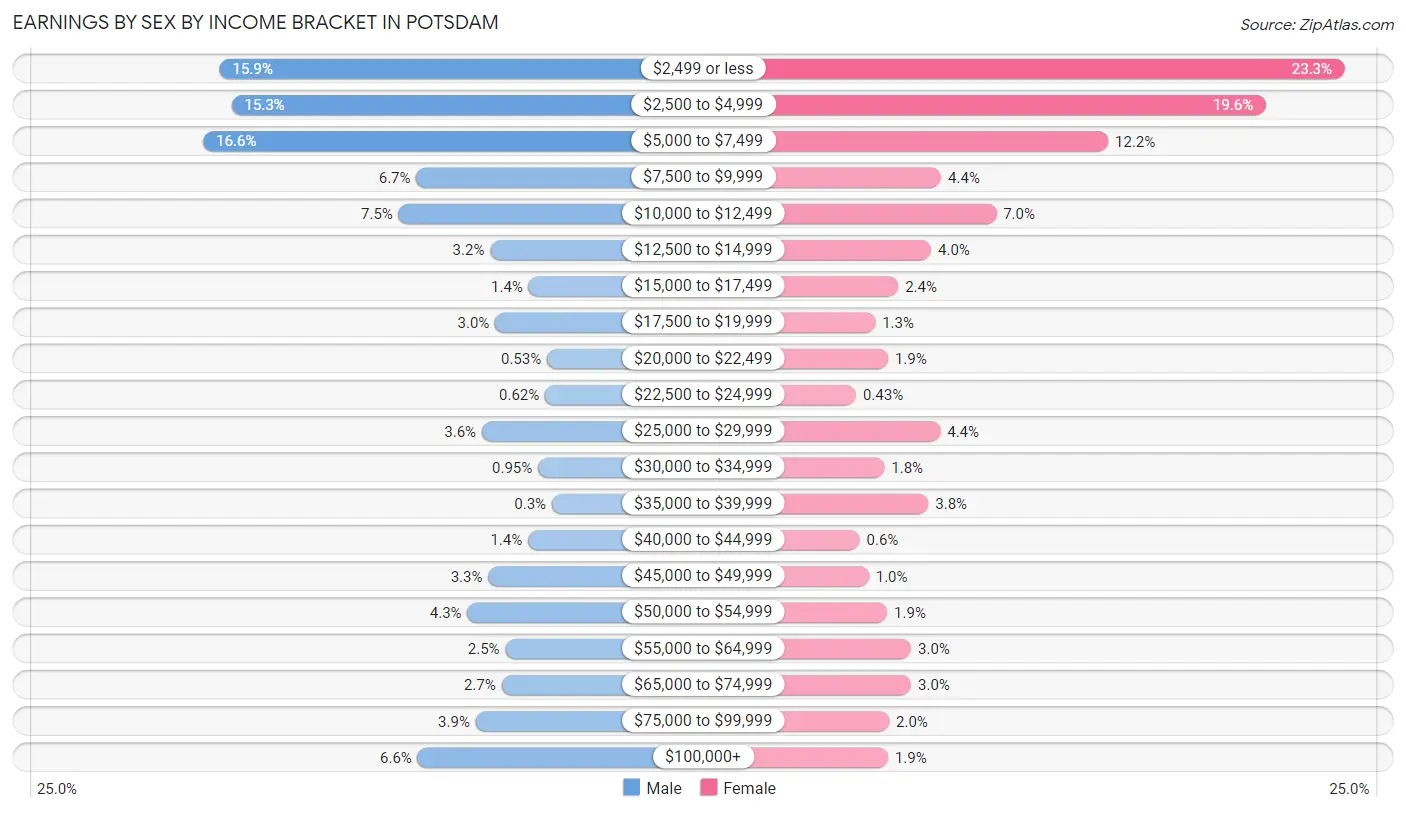
Earnings by Sex by Income Bracket in Potsdam
The most common earnings brackets in Potsdam are $5,000 to $7,499 for men (563 | 16.6%) and $2,499 or less for women (542 | 23.3%).
| Income | Male | Female |
| $2,499 or less | 537 (15.9%) | 542 (23.3%) |
| $2,500 to $4,999 | 518 (15.3%) | 456 (19.6%) |
| $5,000 to $7,499 | 563 (16.6%) | 285 (12.2%) |
| $7,500 to $9,999 | 225 (6.7%) | 103 (4.4%) |
| $10,000 to $12,499 | 253 (7.5%) | 163 (7.0%) |
| $12,500 to $14,999 | 108 (3.2%) | 92 (4.0%) |
| $15,000 to $17,499 | 47 (1.4%) | 56 (2.4%) |
| $17,500 to $19,999 | 100 (3.0%) | 31 (1.3%) |
| $20,000 to $22,499 | 18 (0.5%) | 45 (1.9%) |
| $22,500 to $24,999 | 21 (0.6%) | 10 (0.4%) |
| $25,000 to $29,999 | 121 (3.6%) | 102 (4.4%) |
| $30,000 to $34,999 | 32 (0.9%) | 41 (1.8%) |
| $35,000 to $39,999 | 10 (0.3%) | 89 (3.8%) |
| $40,000 to $44,999 | 48 (1.4%) | 14 (0.6%) |
| $45,000 to $49,999 | 111 (3.3%) | 24 (1.0%) |
| $50,000 to $54,999 | 144 (4.3%) | 44 (1.9%) |
| $55,000 to $64,999 | 84 (2.5%) | 70 (3.0%) |
| $65,000 to $74,999 | 90 (2.7%) | 70 (3.0%) |
| $75,000 to $99,999 | 131 (3.9%) | 46 (2.0%) |
| $100,000+ | 223 (6.6%) | 45 (1.9%) |
| Total | 3,384 (100.0%) | 2,328 (100.0%) |
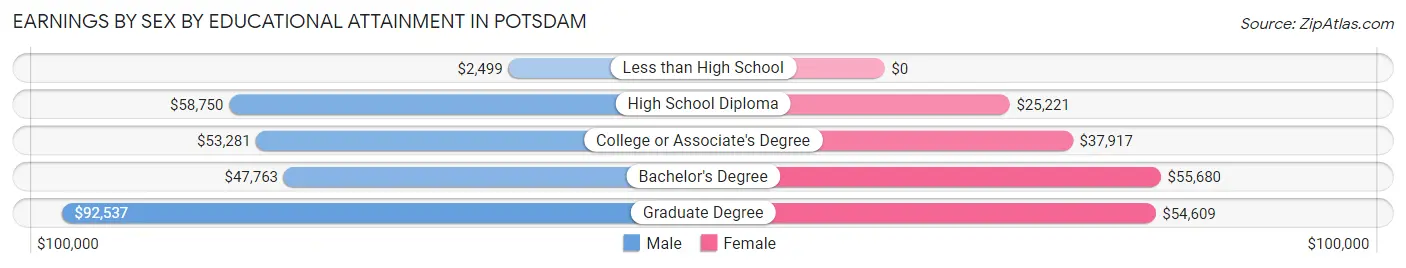
Earnings by Sex by Educational Attainment in Potsdam
Average earnings in Potsdam are $53,872 for men and $37,738 for women, a difference of 29.9%. Men with an educational attainment of graduate degree enjoy the highest average annual earnings of $92,537, while those with less than high school education earn the least with $2,499. Women with an educational attainment of bachelor's degree earn the most with the average annual earnings of $55,680, while those with high school diploma education have the smallest earnings of $25,221.
| Educational Attainment | Male Income | Female Income |
| Less than High School | $2,499 | $0 |
| High School Diploma | $58,750 | $25,221 |
| College or Associate's Degree | $53,281 | $37,917 |
| Bachelor's Degree | $47,763 | $55,680 |
| Graduate Degree | $92,537 | $54,609 |
| Total | $53,872 | $37,738 |
Family Income in Potsdam
Family Income Brackets in Potsdam
According to the Potsdam family income data, there are 196 families falling into the $50,000 to $74,999 income range, which is the most common income bracket and makes up 23.0% of all families. Conversely, the $10,000 to $14,999 income bracket is the least frequent group with only 26 families (3.1%) belonging to this category.
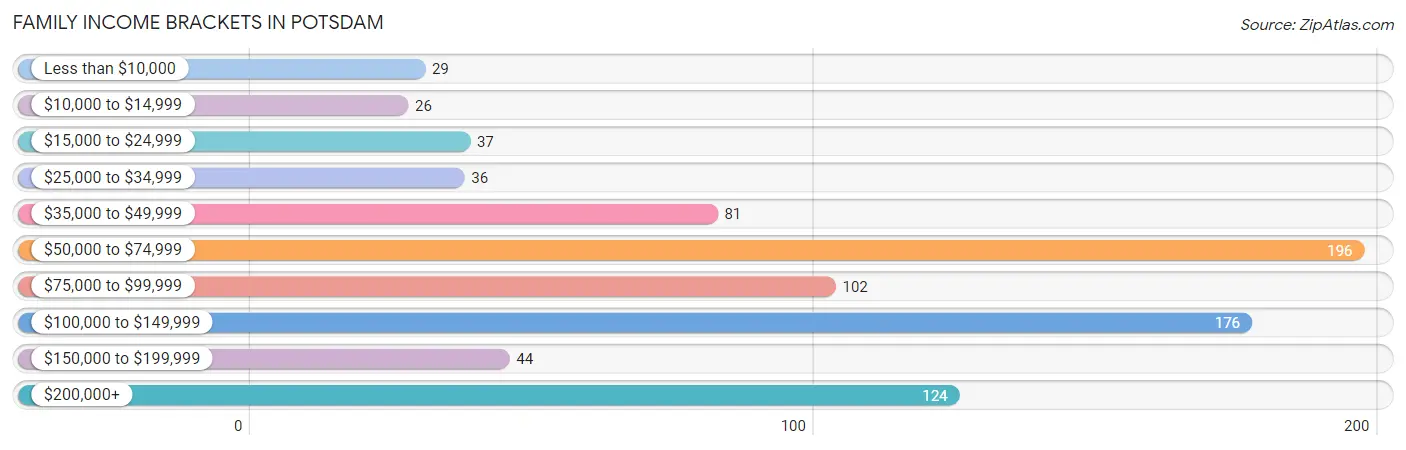
| Income Bracket | # Families | % Families |
| Less than $10,000 | 29 | 3.4% |
| $10,000 to $14,999 | 26 | 3.1% |
| $15,000 to $24,999 | 37 | 4.3% |
| $25,000 to $34,999 | 36 | 4.2% |
| $35,000 to $49,999 | 81 | 9.5% |
| $50,000 to $74,999 | 196 | 23.0% |
| $75,000 to $99,999 | 102 | 12.0% |
| $100,000 to $149,999 | 176 | 20.7% |
| $150,000 to $199,999 | 44 | 5.2% |
| $200,000+ | 124 | 14.6% |
Family Income by Famaliy Size in Potsdam
3-person families (295 | 34.7%) account for the highest median family income in Potsdam with $103,494 per family, while 3-person families (295 | 34.7%) have the highest median income of $34,498 per family member.
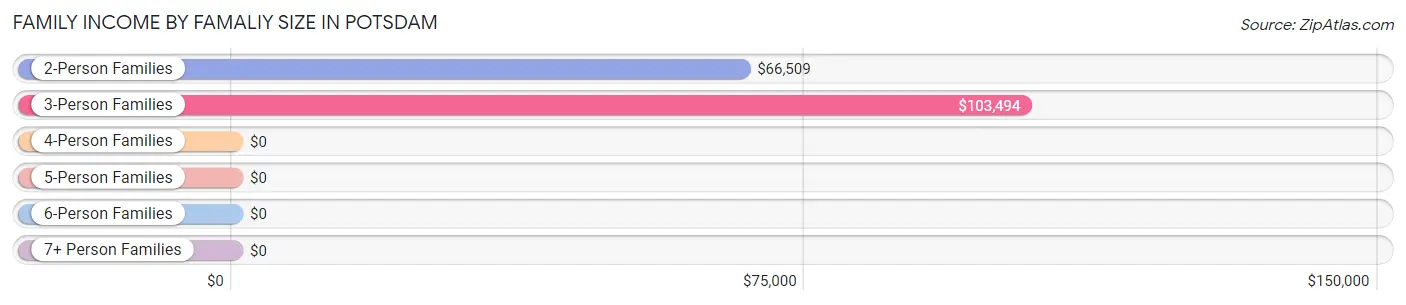
| Income Bracket | # Families | Median Income |
| 2-Person Families | 337 (39.6%) | $66,509 |
| 3-Person Families | 295 (34.7%) | $103,494 |
| 4-Person Families | 169 (19.9%) | $0 |
| 5-Person Families | 16 (1.9%) | $0 |
| 6-Person Families | 31 (3.6%) | $0 |
| 7+ Person Families | 3 (0.4%) | $0 |
| Total | 851 (100.0%) | $79,097 |
Family Income by Number of Earners in Potsdam
The median family income in Potsdam is $79,097, with families comprising 3+ earners (100) having the highest median family income of $239,609, while families with 1 earner (297) have the lowest median family income of $54,382, accounting for 11.7% and 34.9% of families, respectively.
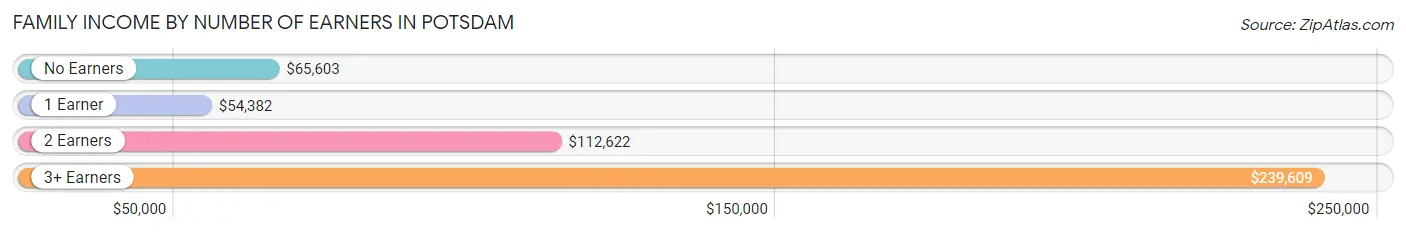
| Number of Earners | # Families | Median Income |
| No Earners | 86 (10.1%) | $65,603 |
| 1 Earner | 297 (34.9%) | $54,382 |
| 2 Earners | 368 (43.2%) | $112,622 |
| 3+ Earners | 100 (11.7%) | $239,609 |
| Total | 851 (100.0%) | $79,097 |
Household Income in Potsdam
Household Income Brackets in Potsdam
With 494 households falling in the category, the $15,000 to $24,999 income range is the most frequent in Potsdam, accounting for 19.2% of all households. In contrast, only 70 households (2.7%) fall into the $150,000 to $199,999 income bracket, making it the least populous group.
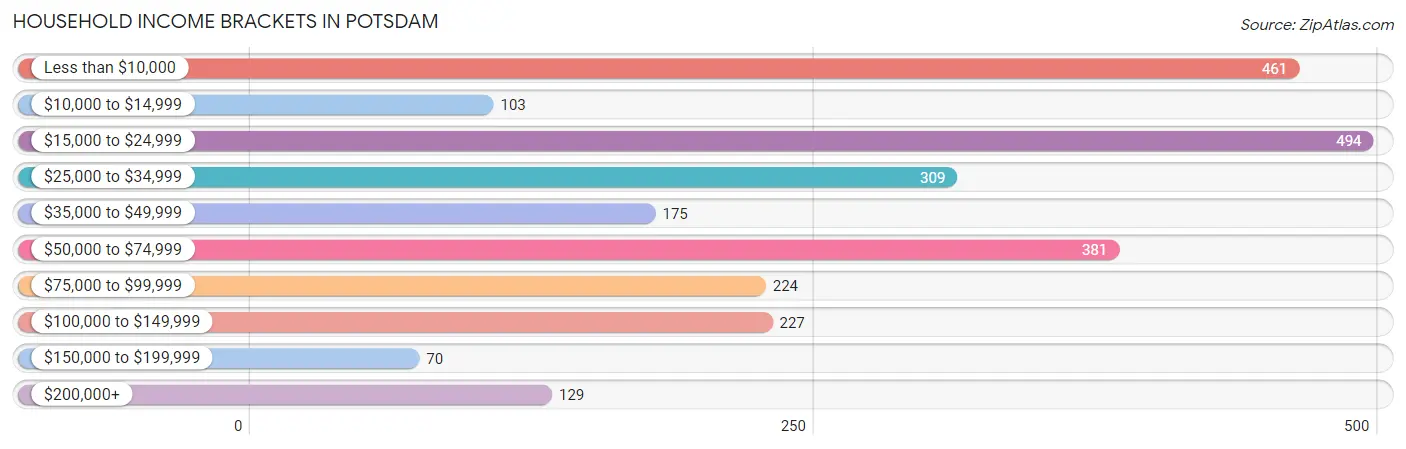
| Income Bracket | # Households | % Households |
| Less than $10,000 | 461 | 17.9% |
| $10,000 to $14,999 | 103 | 4.0% |
| $15,000 to $24,999 | 494 | 19.2% |
| $25,000 to $34,999 | 309 | 12.0% |
| $35,000 to $49,999 | 175 | 6.8% |
| $50,000 to $74,999 | 381 | 14.8% |
| $75,000 to $99,999 | 224 | 8.7% |
| $100,000 to $149,999 | 227 | 8.8% |
| $150,000 to $199,999 | 70 | 2.7% |
| $200,000+ | 129 | 5.0% |
Household Income by Householder Age in Potsdam
The median household income in Potsdam is $31,584, with the highest median household income of $69,479 found in the 45 to 64 years age bracket for the primary householder. A total of 523 households (20.3%) fall into this category. Meanwhile, the 15 to 24 years age bracket for the primary householder has the lowest median household income of $0, with 573 households (22.3%) in this group.
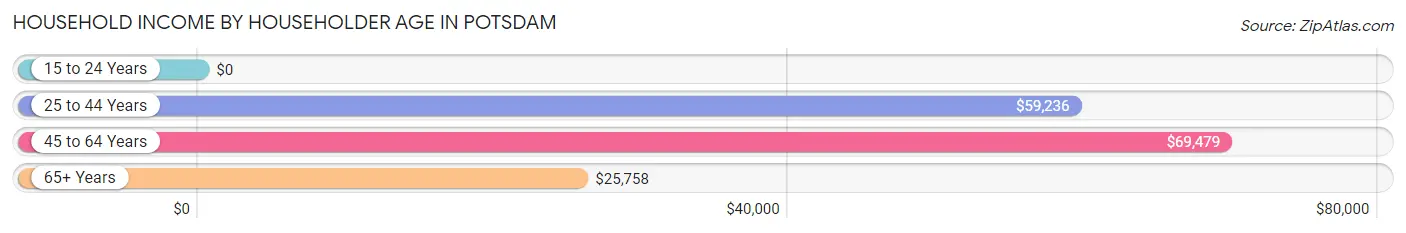
| Income Bracket | # Households | Median Income |
| 15 to 24 Years | 573 (22.3%) | $0 |
| 25 to 44 Years | 733 (28.5%) | $59,236 |
| 45 to 64 Years | 523 (20.3%) | $69,479 |
| 65+ Years | 746 (29.0%) | $25,758 |
| Total | 2,575 (100.0%) | $31,584 |
Poverty in Potsdam
Income Below Poverty by Sex and Age in Potsdam
With 32.2% poverty level for males and 14.3% for females among the residents of Potsdam, 18 to 24 year old males and 5 year old females are the most vulnerable to poverty, with 583 males (79.4%) and 9 females (100.0%) in their respective age groups living below the poverty level.
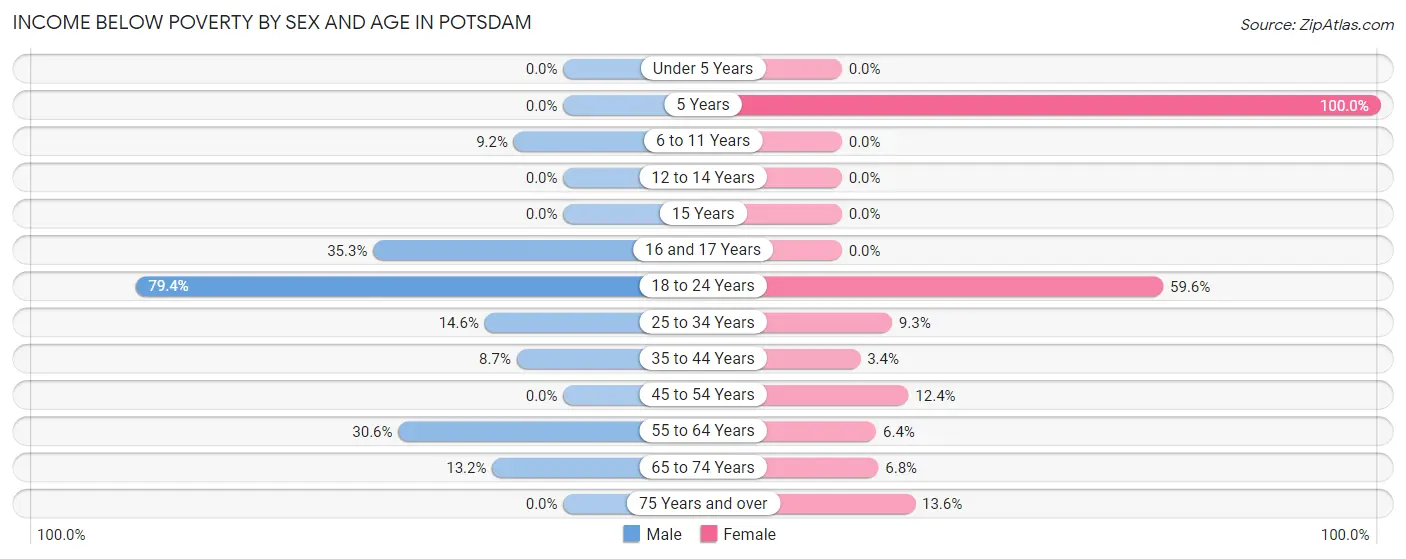
| Age Bracket | Male | Female |
| Under 5 Years | 0 (0.0%) | 0 (0.0%) |
| 5 Years | 0 (0.0%) | 9 (100.0%) |
| 6 to 11 Years | 8 (9.2%) | 0 (0.0%) |
| 12 to 14 Years | 0 (0.0%) | 0 (0.0%) |
| 15 Years | 0 (0.0%) | 0 (0.0%) |
| 16 and 17 Years | 30 (35.3%) | 0 (0.0%) |
| 18 to 24 Years | 583 (79.4%) | 133 (59.6%) |
| 25 to 34 Years | 62 (14.6%) | 24 (9.3%) |
| 35 to 44 Years | 32 (8.6%) | 9 (3.4%) |
| 45 to 54 Years | 0 (0.0%) | 32 (12.4%) |
| 55 to 64 Years | 98 (30.6%) | 10 (6.4%) |
| 65 to 74 Years | 31 (13.2%) | 11 (6.8%) |
| 75 Years and over | 0 (0.0%) | 59 (13.6%) |
| Total | 844 (32.2%) | 287 (14.3%) |
Income Above Poverty by Sex and Age in Potsdam
According to the poverty statistics in Potsdam, males aged under 5 years and females aged under 5 years are the age groups that are most secure financially, with 100.0% of males and 100.0% of females in these age groups living above the poverty line.
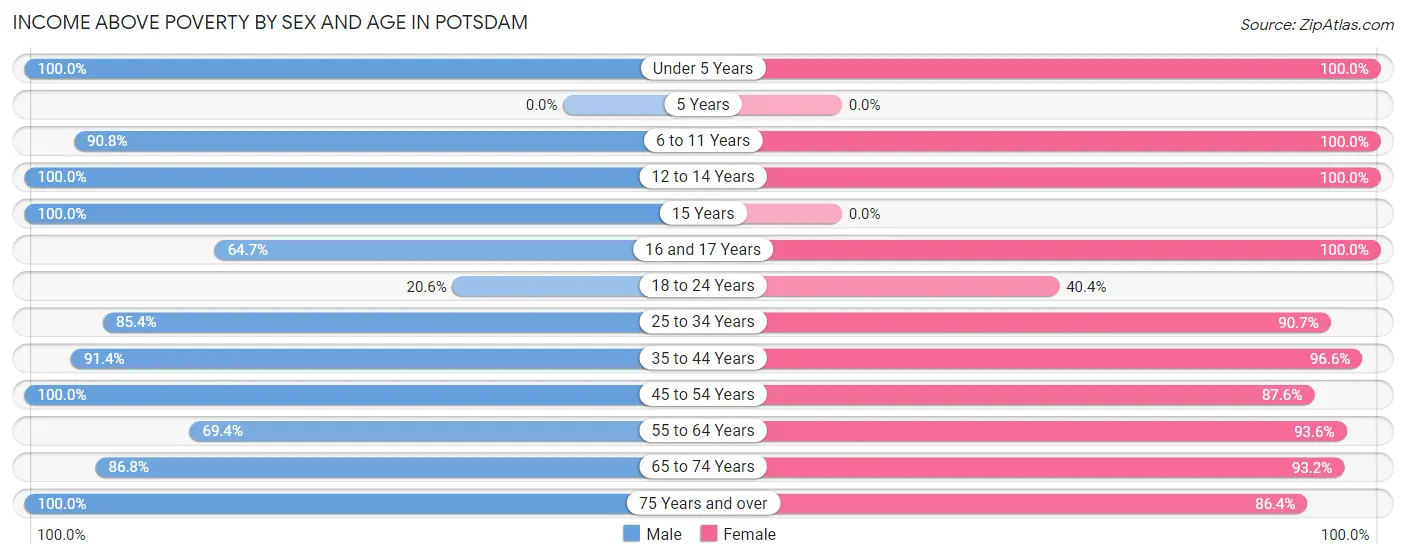
| Age Bracket | Male | Female |
| Under 5 Years | 97 (100.0%) | 35 (100.0%) |
| 5 Years | 0 (0.0%) | 0 (0.0%) |
| 6 to 11 Years | 79 (90.8%) | 74 (100.0%) |
| 12 to 14 Years | 35 (100.0%) | 96 (100.0%) |
| 15 Years | 36 (100.0%) | 0 (0.0%) |
| 16 and 17 Years | 55 (64.7%) | 35 (100.0%) |
| 18 to 24 Years | 151 (20.6%) | 90 (40.4%) |
| 25 to 34 Years | 363 (85.4%) | 234 (90.7%) |
| 35 to 44 Years | 338 (91.3%) | 254 (96.6%) |
| 45 to 54 Years | 168 (100.0%) | 227 (87.6%) |
| 55 to 64 Years | 222 (69.4%) | 147 (93.6%) |
| 65 to 74 Years | 204 (86.8%) | 151 (93.2%) |
| 75 Years and over | 30 (100.0%) | 375 (86.4%) |
| Total | 1,778 (67.8%) | 1,718 (85.7%) |
Income Below Poverty Among Married-Couple Families in Potsdam
The poverty statistics for married-couple families in Potsdam show that 8.3% or 64 of the total 767 families live below the poverty line. Families with no children have the highest poverty rate of 16.0%, comprising of 55 families. On the other hand, families with 3 or 4 children have the lowest poverty rate of 0.0%, which includes 0 families.
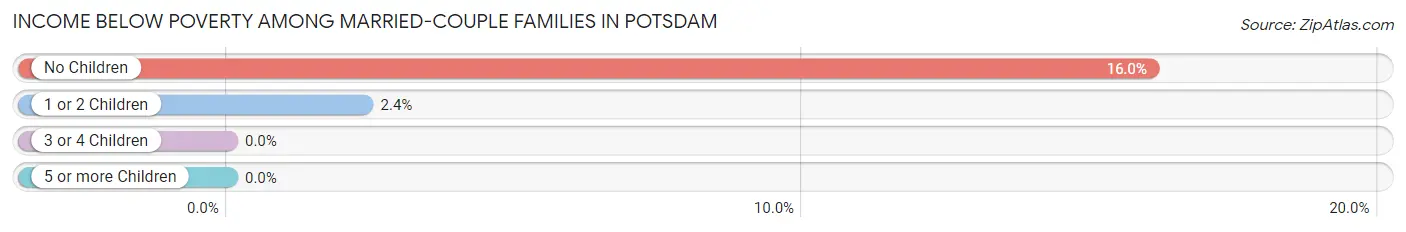
| Children | Above Poverty | Below Poverty |
| No Children | 288 (84.0%) | 55 (16.0%) |
| 1 or 2 Children | 372 (97.6%) | 9 (2.4%) |
| 3 or 4 Children | 40 (100.0%) | 0 (0.0%) |
| 5 or more Children | 3 (100.0%) | 0 (0.0%) |
| Total | 703 (91.7%) | 64 (8.3%) |
Income Below Poverty Among Single-Parent Households in Potsdam
| Children | Single Father | Single Mother |
| No Children | 0 (0.0%) | 0 (0.0%) |
| 1 or 2 Children | 0 (0.0%) | 0 (0.0%) |
| 3 or 4 Children | 0 (0.0%) | 0 (0.0%) |
| 5 or more Children | 0 (0.0%) | 0 (0.0%) |
| Total | 0 (0.0%) | 0 (0.0%) |
Income Below Poverty Among Married-Couple vs Single-Parent Households in Potsdam
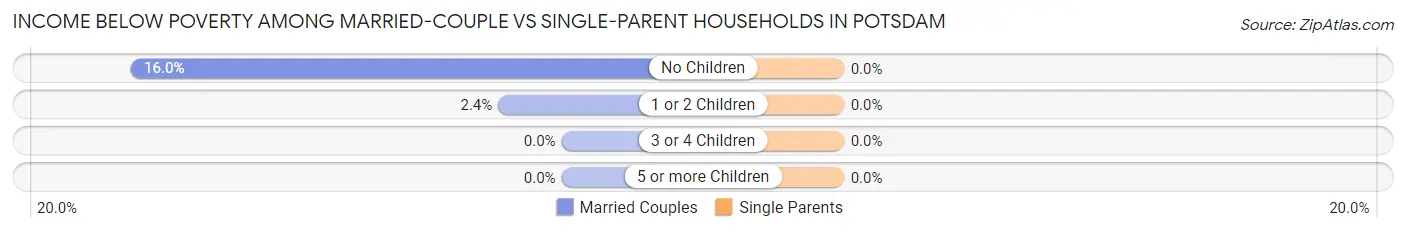
| Children | Married-Couple Families | Single-Parent Households |
| No Children | 55 (16.0%) | 0 (0.0%) |
| 1 or 2 Children | 9 (2.4%) | 0 (0.0%) |
| 3 or 4 Children | 0 (0.0%) | 0 (0.0%) |
| 5 or more Children | 0 (0.0%) | 0 (0.0%) |
| Total | 64 (8.3%) | 0 (0.0%) |
Race in Potsdam
The most populous races in Potsdam are White / Caucasian (6,972 | 81.4%), Asian (526 | 6.1%), and Black / African American (514 | 6.0%).
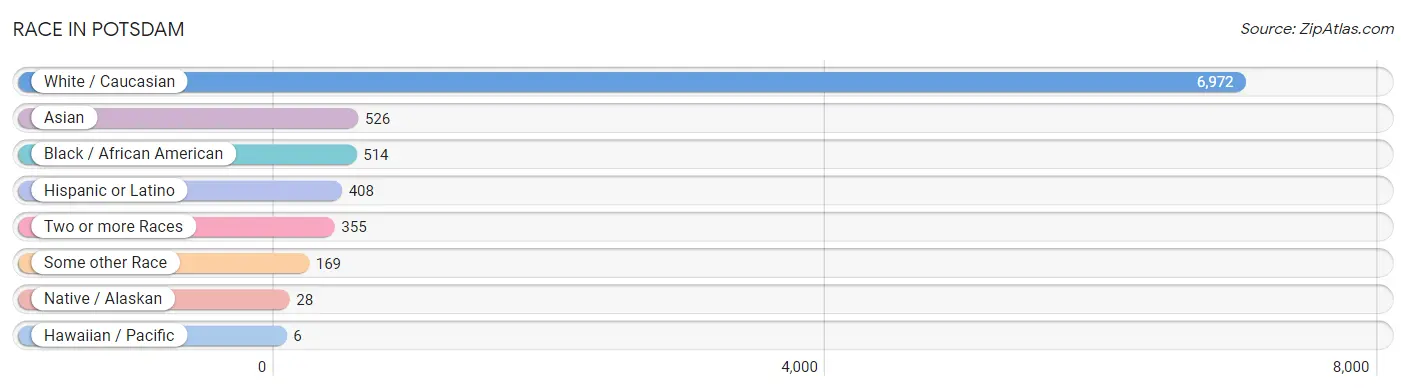
| Race | # Population | % Population |
| Asian | 526 | 6.1% |
| Black / African American | 514 | 6.0% |
| Hawaiian / Pacific | 6 | 0.1% |
| Hispanic or Latino | 408 | 4.8% |
| Native / Alaskan | 28 | 0.3% |
| White / Caucasian | 6,972 | 81.4% |
| Two or more Races | 355 | 4.1% |
| Some other Race | 169 | 2.0% |
| Total | 8,570 | 100.0% |
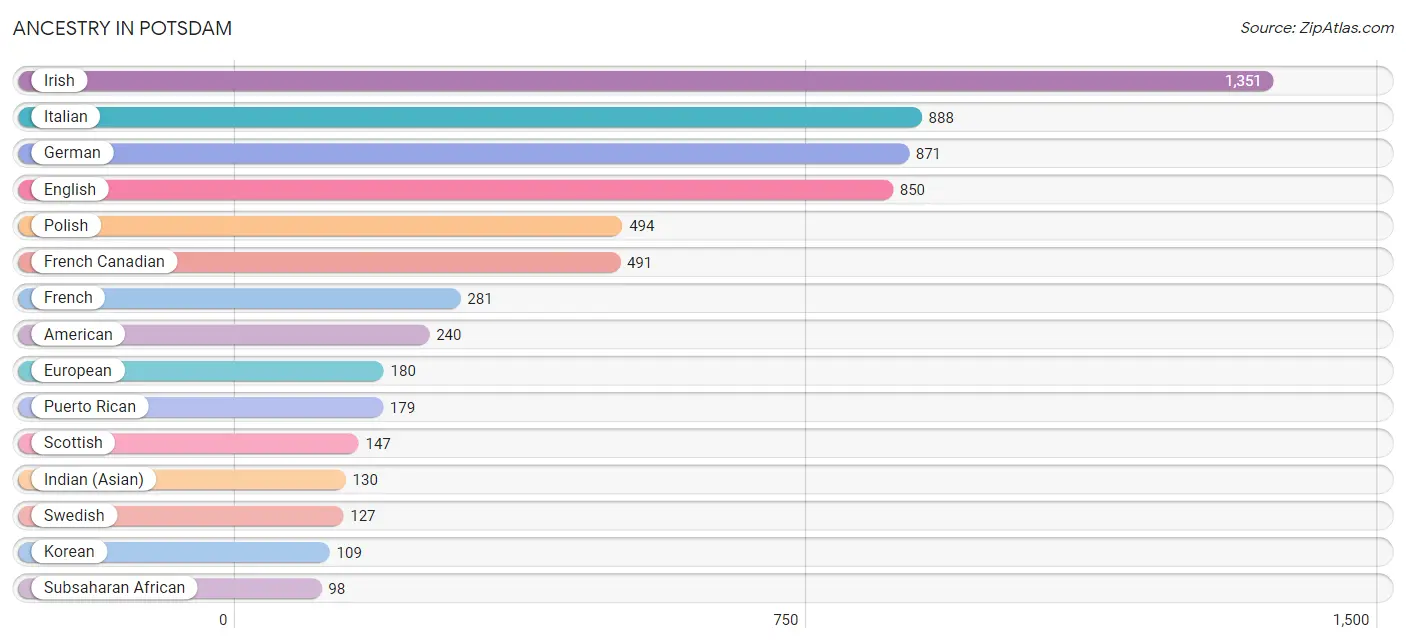
Ancestry in Potsdam
The most populous ancestries reported in Potsdam are Irish (1,351 | 15.8%), Italian (888 | 10.4%), German (871 | 10.2%), English (850 | 9.9%), and Polish (494 | 5.8%), together accounting for 52.0% of all Potsdam residents.
| Ancestry | # Population | % Population |
| African | 51 | 0.6% |
| American | 240 | 2.8% |
| Arab | 3 | 0.0% |
| Argentinean | 12 | 0.1% |
| Armenian | 36 | 0.4% |
| Australian | 8 | 0.1% |
| Austrian | 8 | 0.1% |
| Belgian | 21 | 0.3% |
| Brazilian | 15 | 0.2% |
| British | 54 | 0.6% |
| British West Indian | 8 | 0.1% |
| Bulgarian | 5 | 0.1% |
| Burmese | 57 | 0.7% |
| Canadian | 55 | 0.6% |
| Cape Verdean | 13 | 0.2% |
| Central American | 16 | 0.2% |
| Cherokee | 14 | 0.2% |
| Chilean | 15 | 0.2% |
| Croatian | 19 | 0.2% |
| Czech | 22 | 0.3% |
| Dominican | 53 | 0.6% |
| Dutch | 89 | 1.0% |
| Eastern European | 40 | 0.5% |
| English | 850 | 9.9% |
| Ethiopian | 5 | 0.1% |
| European | 180 | 2.1% |
| Filipino | 19 | 0.2% |
| Finnish | 16 | 0.2% |
| French | 281 | 3.3% |
| French American Indian | 10 | 0.1% |
| French Canadian | 491 | 5.7% |
| German | 871 | 10.2% |
| Ghanaian | 17 | 0.2% |
| Greek | 66 | 0.8% |
| Guatemalan | 10 | 0.1% |
| Haitian | 64 | 0.7% |
| Honduran | 3 | 0.0% |
| Hungarian | 33 | 0.4% |
| Indian (Asian) | 130 | 1.5% |
| Indonesian | 7 | 0.1% |
| Iranian | 26 | 0.3% |
| Iraqi | 1 | 0.0% |
| Irish | 1,351 | 15.8% |
| Iroquois | 25 | 0.3% |
| Israeli | 13 | 0.2% |
| Italian | 888 | 10.4% |
| Jamaican | 10 | 0.1% |
| Kenyan | 5 | 0.1% |
| Korean | 109 | 1.3% |
| Laotian | 14 | 0.2% |
| Lebanese | 2 | 0.0% |
| Lithuanian | 6 | 0.1% |
| Mexican | 75 | 0.9% |
| Mongolian | 5 | 0.1% |
| Nigerian | 3 | 0.0% |
| Norwegian | 42 | 0.5% |
| Panamanian | 3 | 0.0% |
| Paraguayan | 10 | 0.1% |
| Peruvian | 11 | 0.1% |
| Polish | 494 | 5.8% |
| Portuguese | 23 | 0.3% |
| Puerto Rican | 179 | 2.1% |
| Romanian | 24 | 0.3% |
| Russian | 80 | 0.9% |
| Scandinavian | 17 | 0.2% |
| Scotch-Irish | 45 | 0.5% |
| Scottish | 147 | 1.7% |
| Serbian | 20 | 0.2% |
| Slavic | 6 | 0.1% |
| Slovak | 28 | 0.3% |
| Slovene | 17 | 0.2% |
| South American | 48 | 0.6% |
| Spaniard | 19 | 0.2% |
| Sri Lankan | 32 | 0.4% |
| Subsaharan African | 98 | 1.1% |
| Swedish | 127 | 1.5% |
| Swiss | 21 | 0.3% |
| Thai | 55 | 0.6% |
| Ukrainian | 93 | 1.1% |
| Vietnamese | 36 | 0.4% |
| Welsh | 17 | 0.2% |
| West Indian | 6 | 0.1% | View All 82 Rows |
Immigrants in Potsdam
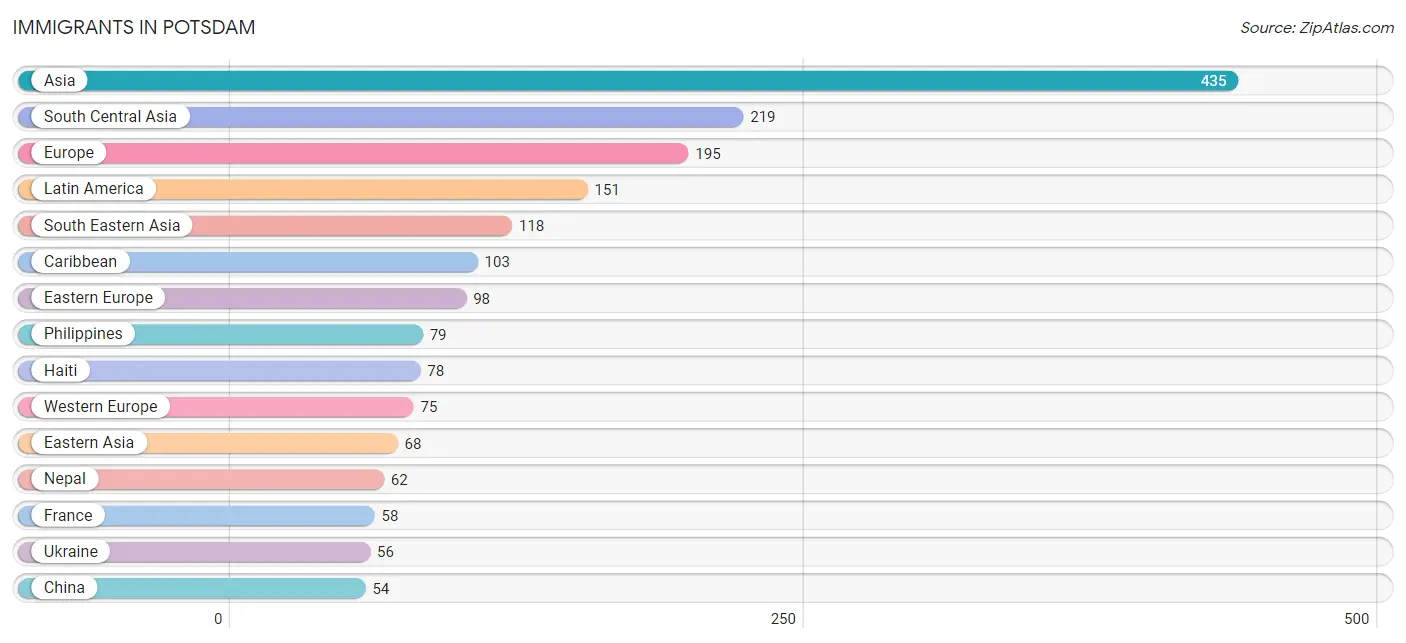
The most numerous immigrant groups reported in Potsdam came from Asia (435 | 5.1%), South Central Asia (219 | 2.6%), Europe (195 | 2.3%), Latin America (151 | 1.8%), and South Eastern Asia (118 | 1.4%), together accounting for 13.1% of all Potsdam residents.
| Immigration Origin | # Population | % Population |
| Africa | 34 | 0.4% |
| Argentina | 10 | 0.1% |
| Asia | 435 | 5.1% |
| Bangladesh | 36 | 0.4% |
| Brazil | 15 | 0.2% |
| Bulgaria | 5 | 0.1% |
| Cameroon | 8 | 0.1% |
| Canada | 31 | 0.4% |
| Caribbean | 103 | 1.2% |
| Central America | 4 | 0.1% |
| Chile | 15 | 0.2% |
| China | 54 | 0.6% |
| Czechoslovakia | 15 | 0.2% |
| Dominican Republic | 9 | 0.1% |
| Eastern Africa | 10 | 0.1% |
| Eastern Asia | 68 | 0.8% |
| Eastern Europe | 98 | 1.1% |
| El Salvador | 1 | 0.0% |
| Ethiopia | 5 | 0.1% |
| Europe | 195 | 2.3% |
| France | 58 | 0.7% |
| Germany | 17 | 0.2% |
| Haiti | 78 | 0.9% |
| India | 43 | 0.5% |
| Iran | 27 | 0.3% |
| Iraq | 30 | 0.4% |
| Italy | 3 | 0.0% |
| Jamaica | 10 | 0.1% |
| Kenya | 5 | 0.1% |
| Korea | 14 | 0.2% |
| Latin America | 151 | 1.8% |
| Middle Africa | 21 | 0.3% |
| Nepal | 62 | 0.7% |
| Nigeria | 3 | 0.0% |
| Northern Europe | 19 | 0.2% |
| Oceania | 5 | 0.1% |
| Pakistan | 29 | 0.3% |
| Panama | 3 | 0.0% |
| Peru | 4 | 0.1% |
| Philippines | 79 | 0.9% |
| Russia | 20 | 0.2% |
| Scotland | 9 | 0.1% |
| Serbia | 2 | 0.0% |
| South America | 44 | 0.5% |
| South Central Asia | 219 | 2.6% |
| South Eastern Asia | 118 | 1.4% |
| Southern Europe | 3 | 0.0% |
| Sri Lanka | 12 | 0.1% |
| Taiwan | 7 | 0.1% |
| Ukraine | 56 | 0.6% |
| Vietnam | 32 | 0.4% |
| Western Africa | 3 | 0.0% |
| Western Asia | 30 | 0.4% |
| Western Europe | 75 | 0.9% | View All 54 Rows |
Sex and Age in Potsdam
Sex and Age in Potsdam
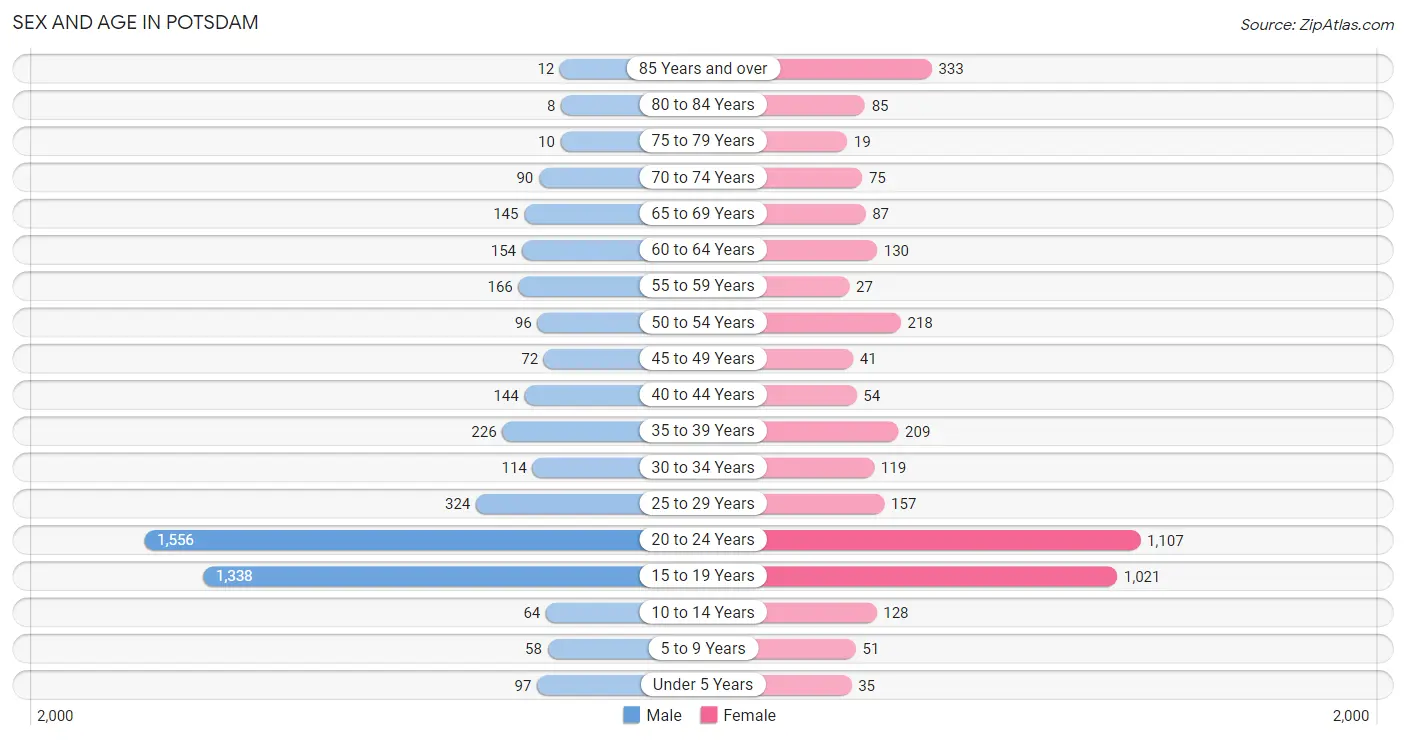
The most populous age groups in Potsdam are 20 to 24 Years (1,556 | 33.3%) for men and 20 to 24 Years (1,107 | 28.4%) for women.
| Age Bracket | Male | Female |
| Under 5 Years | 97 (2.1%) | 35 (0.9%) |
| 5 to 9 Years | 58 (1.2%) | 51 (1.3%) |
| 10 to 14 Years | 64 (1.4%) | 128 (3.3%) |
| 15 to 19 Years | 1,338 (28.6%) | 1,021 (26.2%) |
| 20 to 24 Years | 1,556 (33.3%) | 1,107 (28.4%) |
| 25 to 29 Years | 324 (6.9%) | 157 (4.0%) |
| 30 to 34 Years | 114 (2.4%) | 119 (3.0%) |
| 35 to 39 Years | 226 (4.8%) | 209 (5.4%) |
| 40 to 44 Years | 144 (3.1%) | 54 (1.4%) |
| 45 to 49 Years | 72 (1.5%) | 41 (1.1%) |
| 50 to 54 Years | 96 (2.1%) | 218 (5.6%) |
| 55 to 59 Years | 166 (3.5%) | 27 (0.7%) |
| 60 to 64 Years | 154 (3.3%) | 130 (3.3%) |
| 65 to 69 Years | 145 (3.1%) | 87 (2.2%) |
| 70 to 74 Years | 90 (1.9%) | 75 (1.9%) |
| 75 to 79 Years | 10 (0.2%) | 19 (0.5%) |
| 80 to 84 Years | 8 (0.2%) | 85 (2.2%) |
| 85 Years and over | 12 (0.3%) | 333 (8.6%) |
| Total | 4,674 (100.0%) | 3,896 (100.0%) |
Families and Households in Potsdam
Median Family Size in Potsdam
| Family Type | # Families | Family Size |
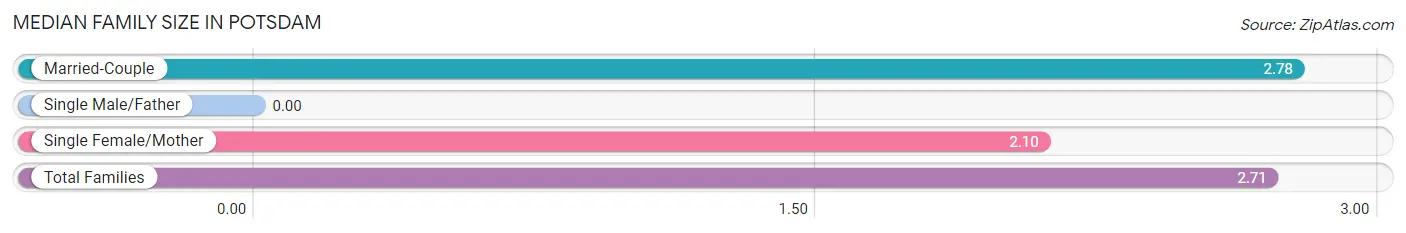
| Married-Couple | 767 (90.1%) | 2.78 |
| Single Male/Father | 0 (0.0%) | - |
| Single Female/Mother | 84 (9.9%) | 2.10 |
| Total Families | 851 (100.0%) | 2.71 |
Median Household Size in Potsdam
| Household Type | # Households | Household Size |
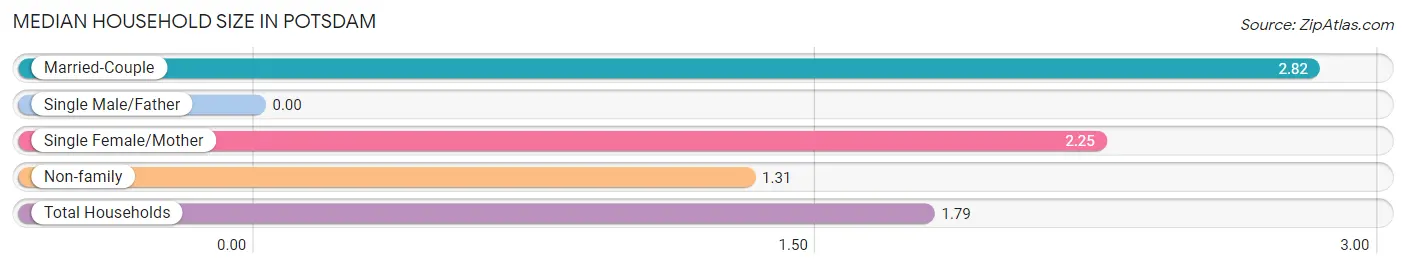
| Married-Couple | 767 (29.8%) | 2.82 |
| Single Male/Father | 0 (0.0%) | - |
| Single Female/Mother | 84 (3.3%) | 2.25 |
| Non-family | 1,724 (66.9%) | 1.31 |
| Total Households | 2,575 (100.0%) | 1.79 |
Household Size by Marriage Status in Potsdam
Out of a total of 2,575 households in Potsdam, 851 (33.1%) are family households, while 1,724 (66.9%) are nonfamily households. The most numerous type of family households are 3-person households, comprising 328, and the most common type of nonfamily households are 1-person households, comprising 1,401.
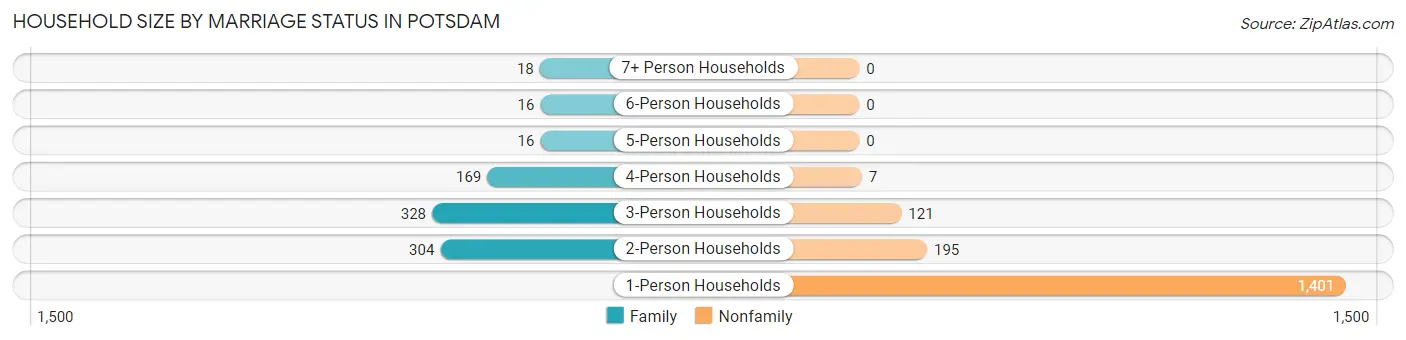
| Household Size | Family Households | Nonfamily Households |
| 1-Person Households | - | 1,401 (54.4%) |
| 2-Person Households | 304 (11.8%) | 195 (7.6%) |
| 3-Person Households | 328 (12.7%) | 121 (4.7%) |
| 4-Person Households | 169 (6.6%) | 7 (0.3%) |
| 5-Person Households | 16 (0.6%) | 0 (0.0%) |
| 6-Person Households | 16 (0.6%) | 0 (0.0%) |
| 7+ Person Households | 18 (0.7%) | 0 (0.0%) |
| Total | 851 (33.1%) | 1,724 (66.9%) |
Female Fertility in Potsdam
Fertility by Age in Potsdam
Average fertility rate in Potsdam is 12.0 births per 1,000 women. Women in the age bracket of 35 to 50 years have the highest fertility rate with 67.0 births per 1,000 women. Women in the age bracket of 35 to 50 years acount for 76.5% of all women with births.
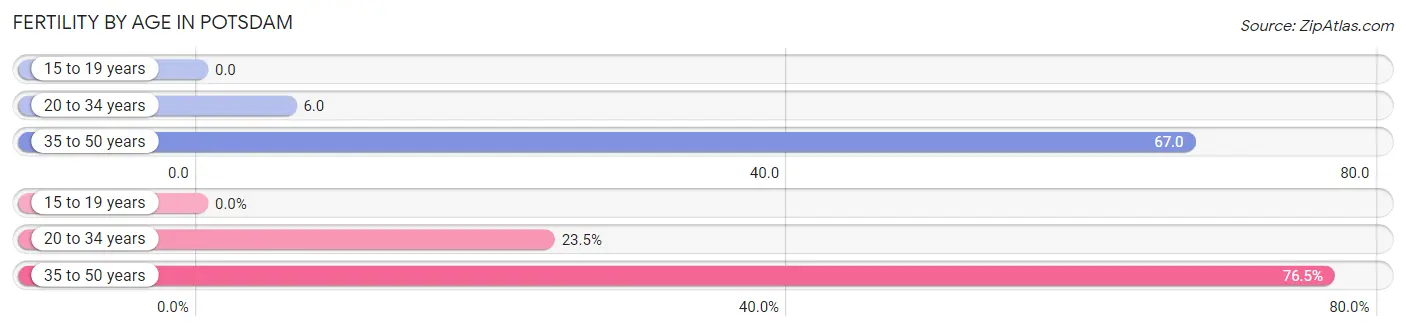
| Age Bracket | Women with Births | Births / 1,000 Women |
| 15 to 19 years | 0 (0.0%) | 0.0 |
| 20 to 34 years | 8 (23.5%) | 6.0 |
| 35 to 50 years | 26 (76.5%) | 67.0 |
| Total | 34 (100.0%) | 12.0 |
Fertility by Age by Marriage Status in Potsdam
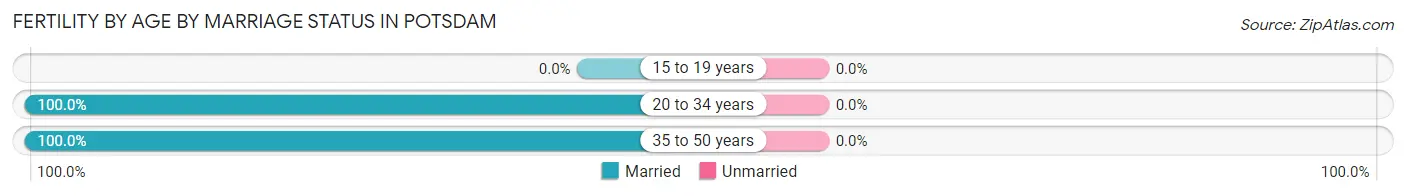
| Age Bracket | Married | Unmarried |
| 15 to 19 years | 0 (0.0%) | 0 (0.0%) |
| 20 to 34 years | 8 (100.0%) | 0 (0.0%) |
| 35 to 50 years | 26 (100.0%) | 0 (0.0%) |
| Total | 34 (100.0%) | 0 (0.0%) |
Fertility by Education in Potsdam
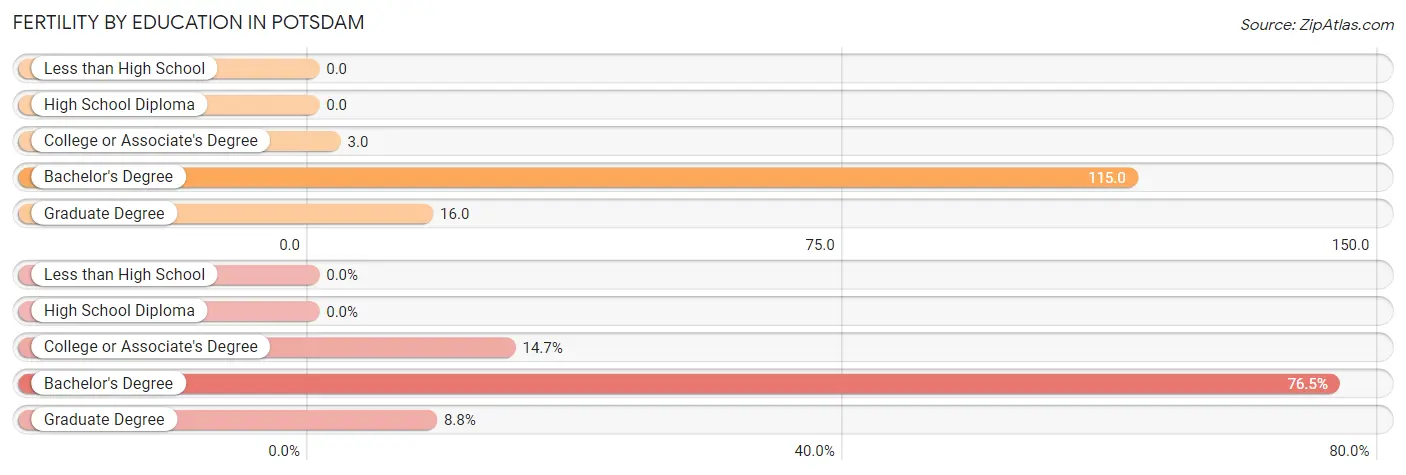
| Educational Attainment | Women with Births | Births / 1,000 Women |
| Less than High School | 0 (0.0%) | 0.0 |
| High School Diploma | 0 (0.0%) | 0.0 |
| College or Associate's Degree | 5 (14.7%) | 3.0 |
| Bachelor's Degree | 26 (76.5%) | 115.0 |
| Graduate Degree | 3 (8.8%) | 16.0 |
| Total | 34 (100.0%) | 12.0 |
Fertility by Education by Marriage Status in Potsdam
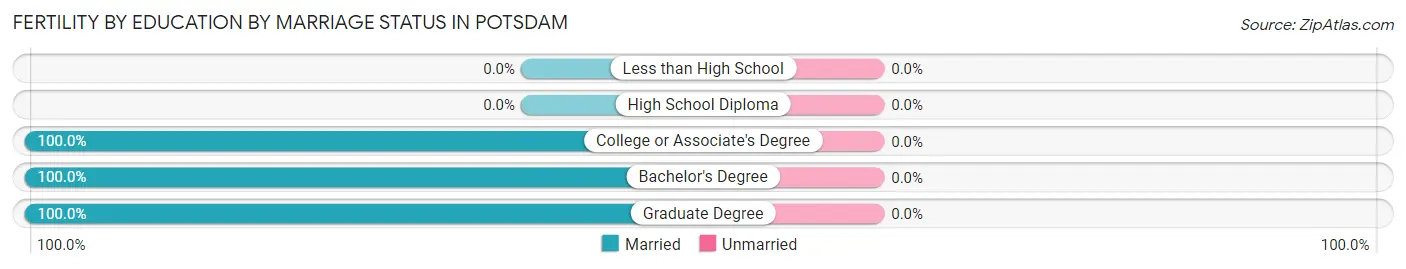
| Educational Attainment | Married | Unmarried |
| Less than High School | 0 (0.0%) | 0 (0.0%) |
| High School Diploma | 0 (0.0%) | 0 (0.0%) |
| College or Associate's Degree | 5 (100.0%) | 0 (0.0%) |
| Bachelor's Degree | 26 (100.0%) | 0 (0.0%) |
| Graduate Degree | 3 (100.0%) | 0 (0.0%) |
| Total | 34 (100.0%) | 0 (0.0%) |
Employment Characteristics in Potsdam
Employment by Class of Employer in Potsdam
Among the 3,385 employed individuals in Potsdam, private company employees (1,711 | 50.5%), not-for-profit organizations (607 | 17.9%), and state government employees (446 | 13.2%) make up the most common classes of employment.
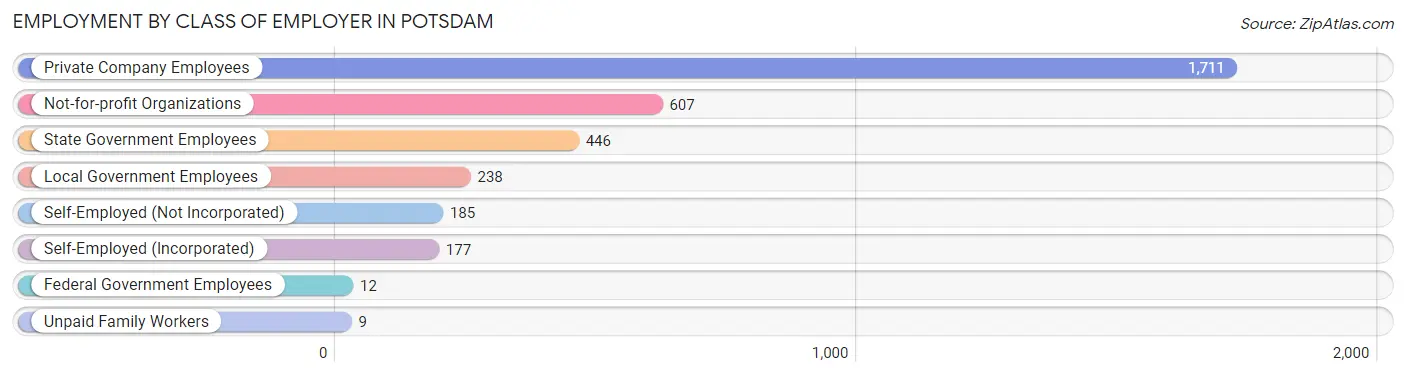
| Employer Class | # Employees | % Employees |
| Private Company Employees | 1,711 | 50.5% |
| Self-Employed (Incorporated) | 177 | 5.2% |
| Self-Employed (Not Incorporated) | 185 | 5.5% |
| Not-for-profit Organizations | 607 | 17.9% |
| Local Government Employees | 238 | 7.0% |
| State Government Employees | 446 | 13.2% |
| Federal Government Employees | 12 | 0.4% |
| Unpaid Family Workers | 9 | 0.3% |
| Total | 3,385 | 100.0% |
Employment Status by Age in Potsdam
According to the labor force statistics for Potsdam, out of the total population over 16 years of age (8,101), 47.9% or 3,880 individuals are in the labor force, with 9.3% or 361 of them unemployed. The age group with the highest labor force participation rate is 25 to 29 years, with 82.1% or 395 individuals in the labor force. Within the labor force, the 20 to 24 years age range has the highest percentage of unemployed individuals, with 16.6% or 237 of them being unemployed.
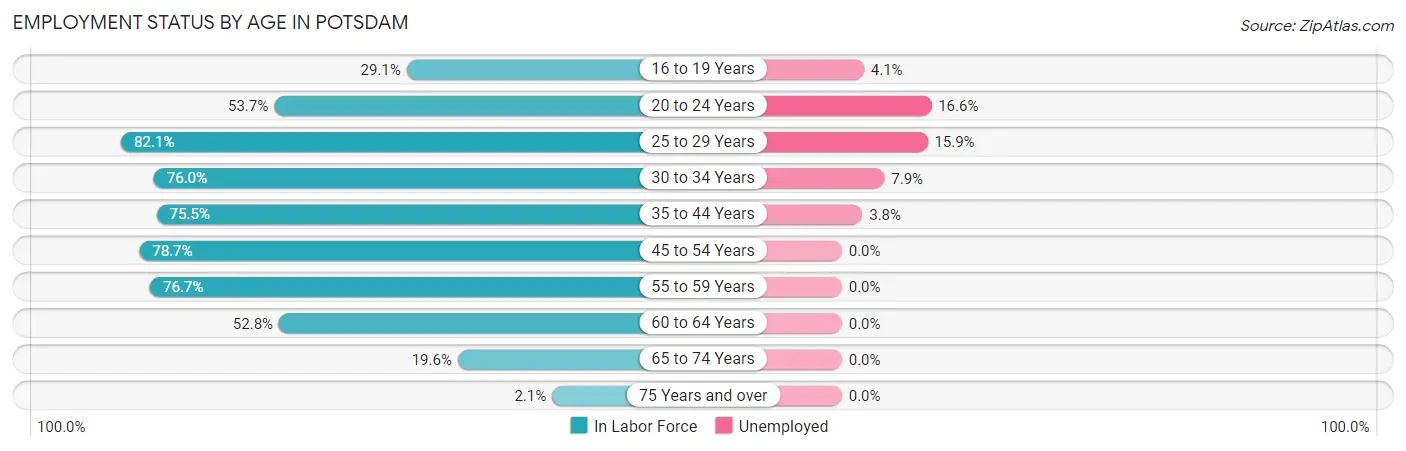
| Age Bracket | In Labor Force | Unemployed |
| 16 to 19 Years | 676 (29.1%) | 28 (4.1%) |
| 20 to 24 Years | 1,430 (53.7%) | 237 (16.6%) |
| 25 to 29 Years | 395 (82.1%) | 63 (15.9%) |
| 30 to 34 Years | 177 (76.0%) | 14 (7.9%) |
| 35 to 44 Years | 478 (75.5%) | 18 (3.8%) |
| 45 to 54 Years | 336 (78.7%) | 0 (0.0%) |
| 55 to 59 Years | 148 (76.7%) | 0 (0.0%) |
| 60 to 64 Years | 150 (52.8%) | 0 (0.0%) |
| 65 to 74 Years | 78 (19.6%) | 0 (0.0%) |
| 75 Years and over | 10 (2.1%) | 0 (0.0%) |
| Total | 3,880 (47.9%) | 361 (9.3%) |
Employment Status by Educational Attainment in Potsdam
According to labor force statistics for Potsdam, 74.8% of individuals (1,684) out of the total population between 25 and 64 years of age (2,251) are in the labor force, with 5.6% or 94 of them being unemployed. The group with the highest labor force participation rate are those with the educational attainment of bachelor's degree or higher, with 87.3% or 898 individuals in the labor force. Within the labor force, individuals with college / associate degree education have the highest percentage of unemployment, with 18.8% or 77 of them being unemployed.
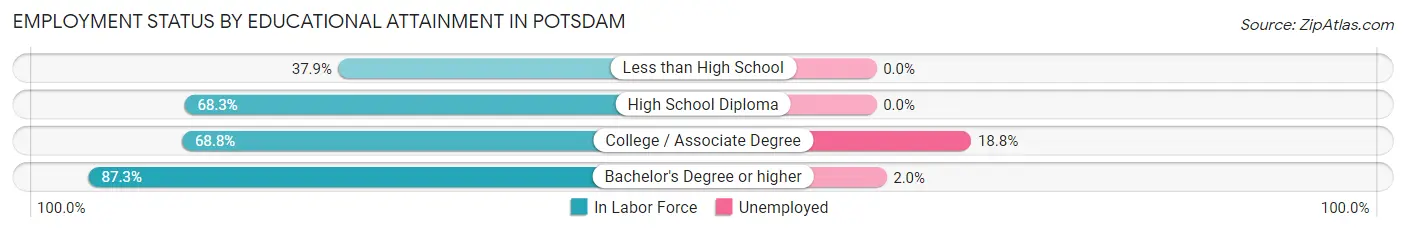
| Educational Attainment | In Labor Force | Unemployed |
| Less than High School | 64 (37.9%) | 0 (0.0%) |
| High School Diploma | 312 (68.3%) | 0 (0.0%) |
| College / Associate Degree | 410 (68.8%) | 112 (18.8%) |
| Bachelor's Degree or higher | 898 (87.3%) | 21 (2.0%) |
| Total | 1,684 (74.8%) | 126 (5.6%) |
Employment Occupations by Sex in Potsdam
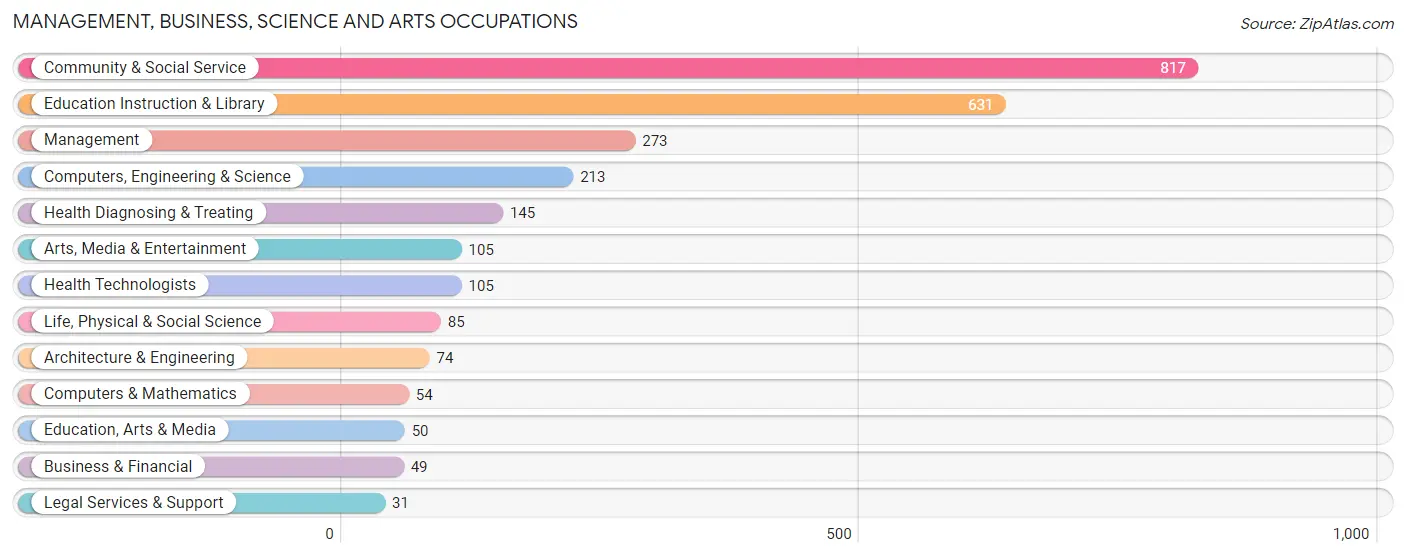
Management, Business, Science and Arts Occupations
The most common Management, Business, Science and Arts occupations in Potsdam are Community & Social Service (817 | 23.2%), Education Instruction & Library (631 | 17.9%), Management (273 | 7.8%), Computers, Engineering & Science (213 | 6.0%), and Health Diagnosing & Treating (145 | 4.1%).
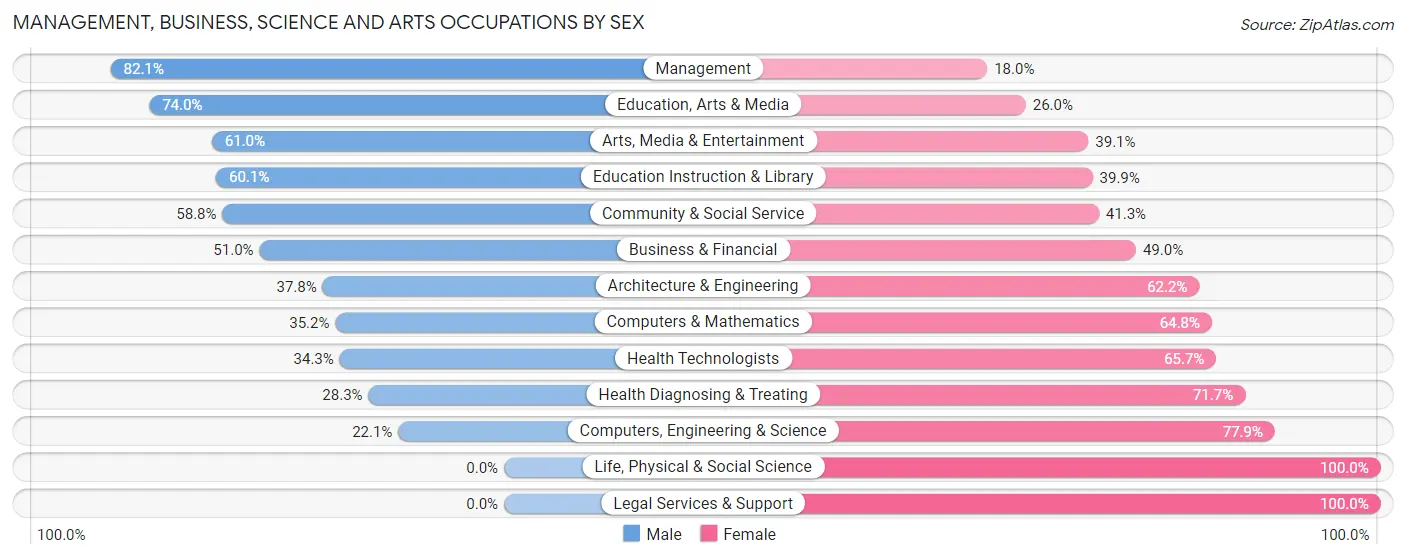
Management, Business, Science and Arts Occupations by Sex
Within the Management, Business, Science and Arts occupations in Potsdam, the most male-oriented occupations are Management (82.1%), Education, Arts & Media (74.0%), and Arts, Media & Entertainment (61.0%), while the most female-oriented occupations are Life, Physical & Social Science (100.0%), Legal Services & Support (100.0%), and Computers, Engineering & Science (77.9%).
| Occupation | Male | Female |
| Management | 224 (82.1%) | 49 (17.9%) |
| Business & Financial | 25 (51.0%) | 24 (49.0%) |
| Computers, Engineering & Science | 47 (22.1%) | 166 (77.9%) |
| Computers & Mathematics | 19 (35.2%) | 35 (64.8%) |
| Architecture & Engineering | 28 (37.8%) | 46 (62.2%) |
| Life, Physical & Social Science | 0 (0.0%) | 85 (100.0%) |
| Community & Social Service | 480 (58.8%) | 337 (41.2%) |
| Education, Arts & Media | 37 (74.0%) | 13 (26.0%) |
| Legal Services & Support | 0 (0.0%) | 31 (100.0%) |
| Education Instruction & Library | 379 (60.1%) | 252 (39.9%) |
| Arts, Media & Entertainment | 64 (61.0%) | 41 (39.1%) |
| Health Diagnosing & Treating | 41 (28.3%) | 104 (71.7%) |
| Health Technologists | 36 (34.3%) | 69 (65.7%) |
| Total (Category) | 817 (54.6%) | 680 (45.4%) |
| Total (Overall) | 2,040 (58.0%) | 1,478 (42.0%) |
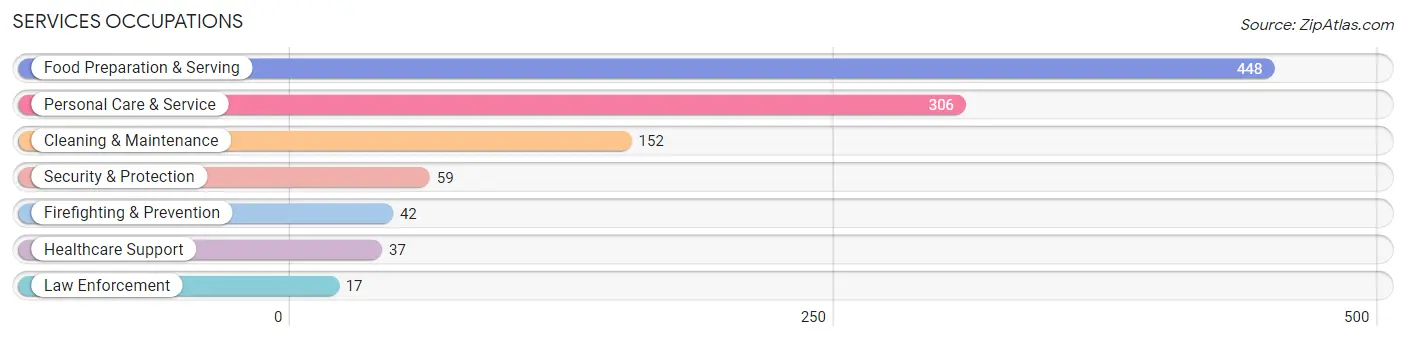
Services Occupations
The most common Services occupations in Potsdam are Food Preparation & Serving (448 | 12.7%), Personal Care & Service (306 | 8.7%), Cleaning & Maintenance (152 | 4.3%), Security & Protection (59 | 1.7%), and Firefighting & Prevention (42 | 1.2%).
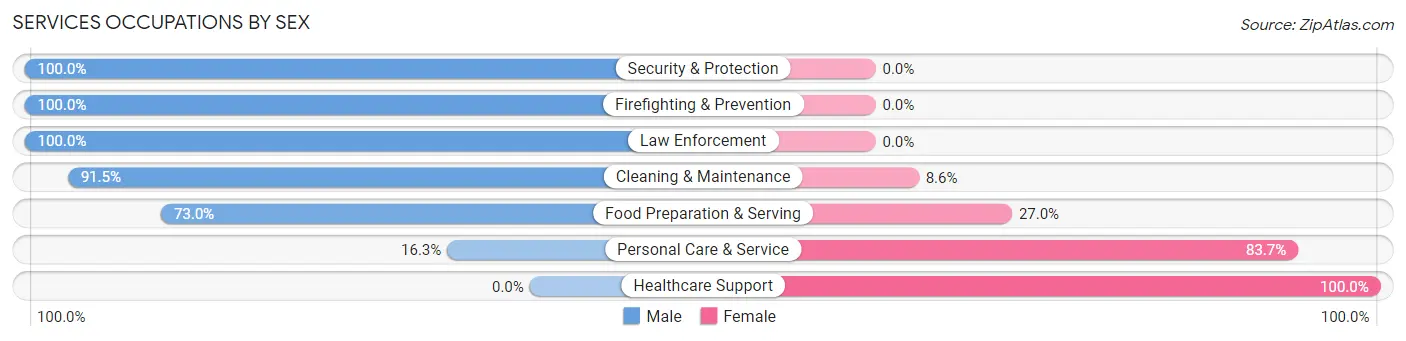
Services Occupations by Sex
Within the Services occupations in Potsdam, the most male-oriented occupations are Security & Protection (100.0%), Firefighting & Prevention (100.0%), and Law Enforcement (100.0%), while the most female-oriented occupations are Healthcare Support (100.0%), Personal Care & Service (83.7%), and Food Preparation & Serving (27.0%).
| Occupation | Male | Female |
| Healthcare Support | 0 (0.0%) | 37 (100.0%) |
| Security & Protection | 59 (100.0%) | 0 (0.0%) |
| Firefighting & Prevention | 42 (100.0%) | 0 (0.0%) |
| Law Enforcement | 17 (100.0%) | 0 (0.0%) |
| Food Preparation & Serving | 327 (73.0%) | 121 (27.0%) |
| Cleaning & Maintenance | 139 (91.4%) | 13 (8.6%) |
| Personal Care & Service | 50 (16.3%) | 256 (83.7%) |
| Total (Category) | 575 (57.4%) | 427 (42.6%) |
| Total (Overall) | 2,040 (58.0%) | 1,478 (42.0%) |
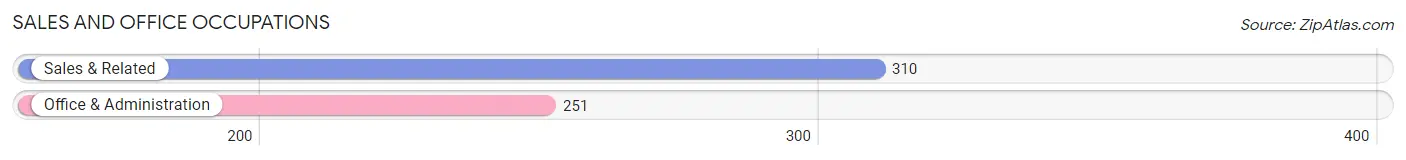
Sales and Office Occupations
The most common Sales and Office occupations in Potsdam are Sales & Related (310 | 8.8%), and Office & Administration (251 | 7.1%).
Sales and Office Occupations by Sex
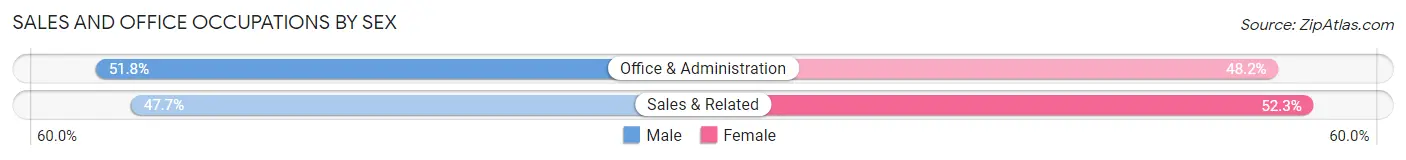
| Occupation | Male | Female |
| Sales & Related | 148 (47.7%) | 162 (52.3%) |
| Office & Administration | 130 (51.8%) | 121 (48.2%) |
| Total (Category) | 278 (49.5%) | 283 (50.4%) |
| Total (Overall) | 2,040 (58.0%) | 1,478 (42.0%) |
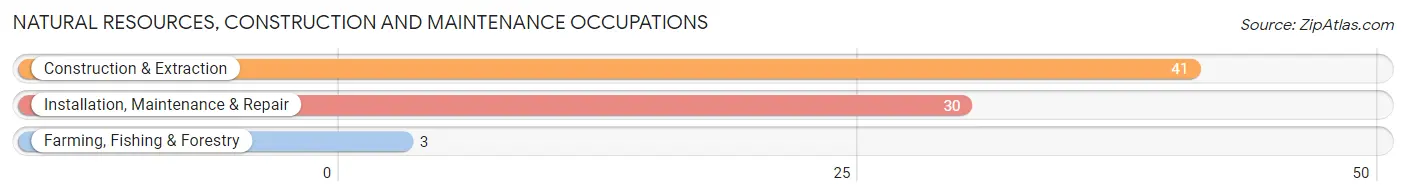
Natural Resources, Construction and Maintenance Occupations
The most common Natural Resources, Construction and Maintenance occupations in Potsdam are Construction & Extraction (41 | 1.2%), Installation, Maintenance & Repair (30 | 0.9%), and Farming, Fishing & Forestry (3 | 0.1%).
Natural Resources, Construction and Maintenance Occupations by Sex
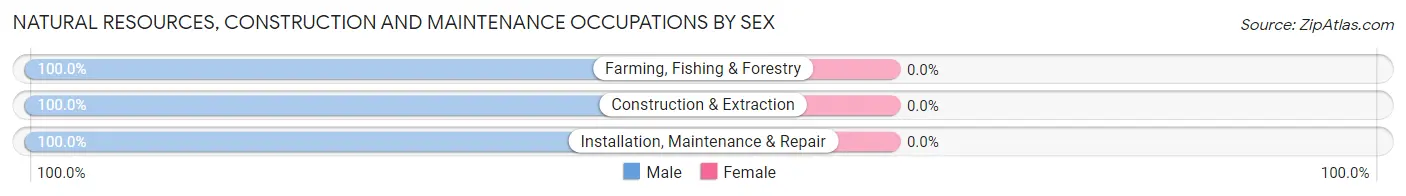
| Occupation | Male | Female |
| Farming, Fishing & Forestry | 3 (100.0%) | 0 (0.0%) |
| Construction & Extraction | 41 (100.0%) | 0 (0.0%) |
| Installation, Maintenance & Repair | 30 (100.0%) | 0 (0.0%) |
| Total (Category) | 74 (100.0%) | 0 (0.0%) |
| Total (Overall) | 2,040 (58.0%) | 1,478 (42.0%) |
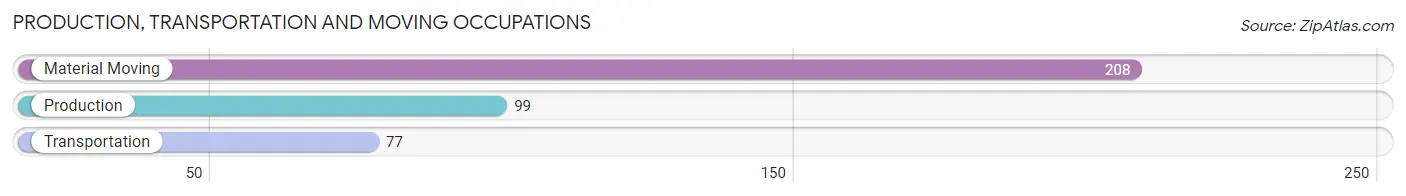
Production, Transportation and Moving Occupations
The most common Production, Transportation and Moving occupations in Potsdam are Material Moving (208 | 5.9%), Production (99 | 2.8%), and Transportation (77 | 2.2%).
Production, Transportation and Moving Occupations by Sex
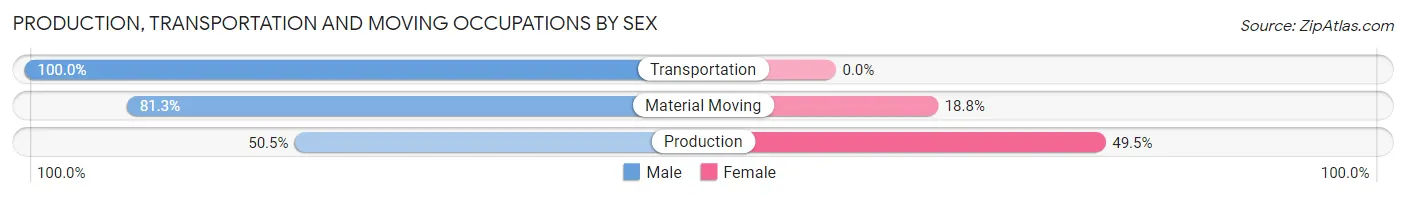
| Occupation | Male | Female |
| Production | 50 (50.5%) | 49 (49.5%) |
| Transportation | 77 (100.0%) | 0 (0.0%) |
| Material Moving | 169 (81.2%) | 39 (18.8%) |
| Total (Category) | 296 (77.1%) | 88 (22.9%) |
| Total (Overall) | 2,040 (58.0%) | 1,478 (42.0%) |
Employment Industries by Sex in Potsdam
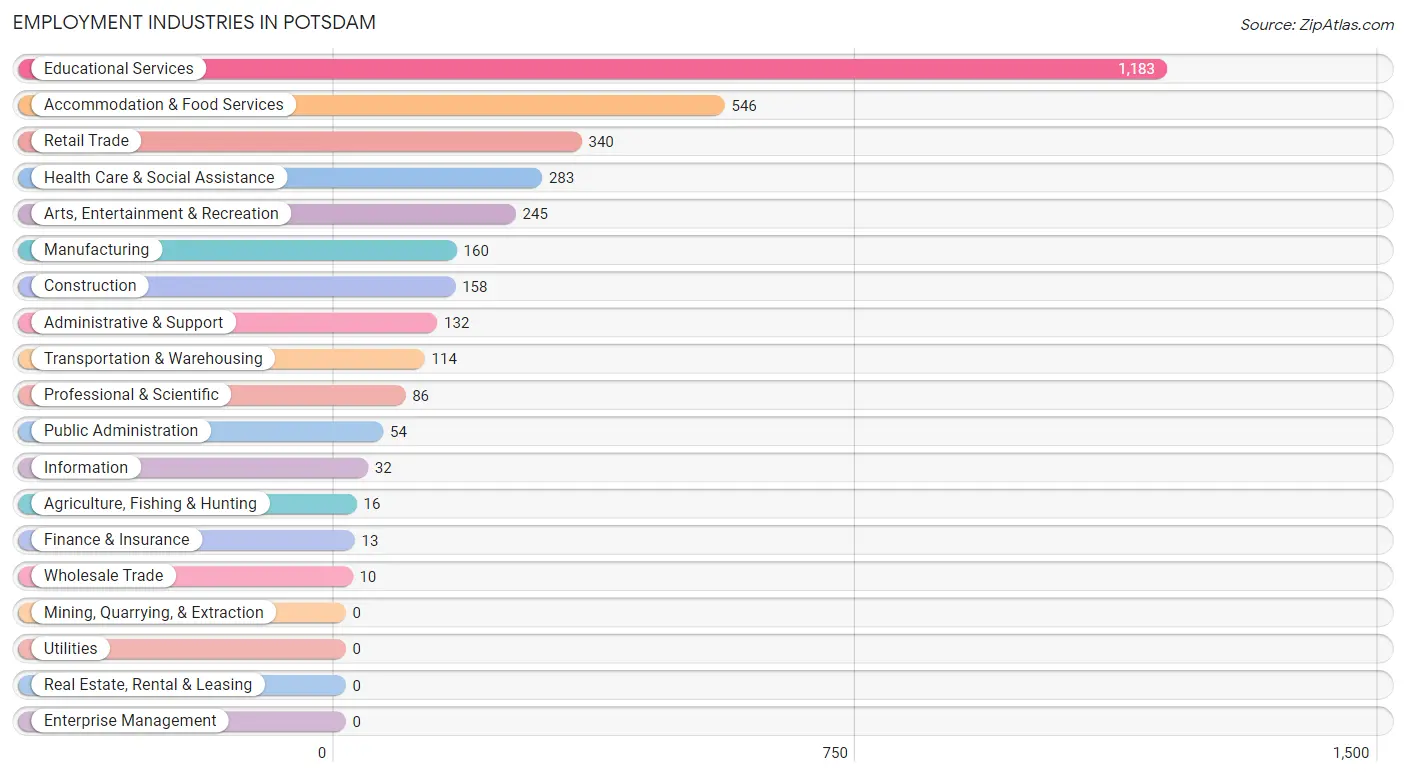
Employment Industries in Potsdam
The major employment industries in Potsdam include Educational Services (1,183 | 33.6%), Accommodation & Food Services (546 | 15.5%), Retail Trade (340 | 9.7%), Health Care & Social Assistance (283 | 8.0%), and Arts, Entertainment & Recreation (245 | 7.0%).
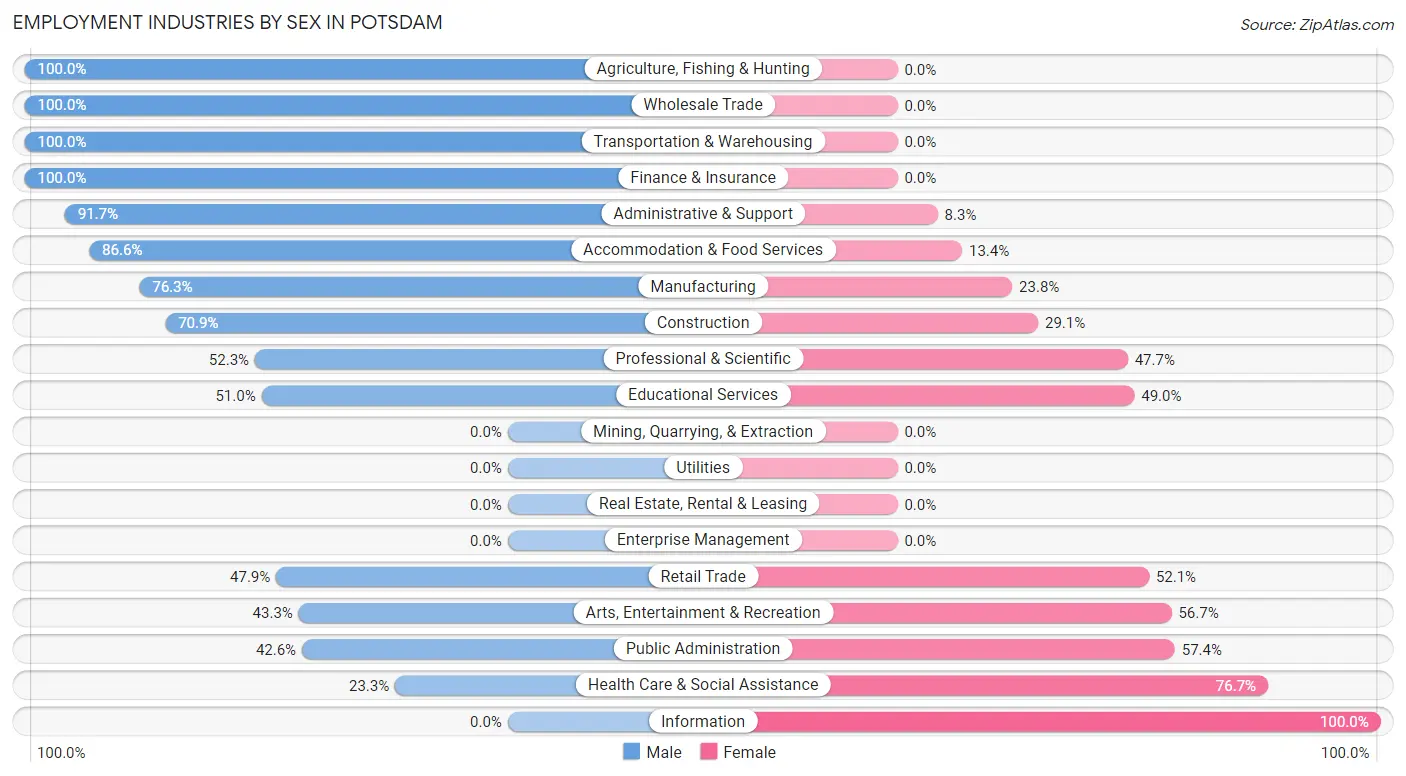
Employment Industries by Sex in Potsdam
The Potsdam industries that see more men than women are Agriculture, Fishing & Hunting (100.0%), Wholesale Trade (100.0%), and Transportation & Warehousing (100.0%), whereas the industries that tend to have a higher number of women are Information (100.0%), Health Care & Social Assistance (76.7%), and Public Administration (57.4%).
| Industry | Male | Female |
| Agriculture, Fishing & Hunting | 16 (100.0%) | 0 (0.0%) |
| Mining, Quarrying, & Extraction | 0 (0.0%) | 0 (0.0%) |
| Construction | 112 (70.9%) | 46 (29.1%) |
| Manufacturing | 122 (76.2%) | 38 (23.7%) |
| Wholesale Trade | 10 (100.0%) | 0 (0.0%) |
| Retail Trade | 163 (47.9%) | 177 (52.1%) |
| Transportation & Warehousing | 114 (100.0%) | 0 (0.0%) |
| Utilities | 0 (0.0%) | 0 (0.0%) |
| Information | 0 (0.0%) | 32 (100.0%) |
| Finance & Insurance | 13 (100.0%) | 0 (0.0%) |
| Real Estate, Rental & Leasing | 0 (0.0%) | 0 (0.0%) |
| Professional & Scientific | 45 (52.3%) | 41 (47.7%) |
| Enterprise Management | 0 (0.0%) | 0 (0.0%) |
| Administrative & Support | 121 (91.7%) | 11 (8.3%) |
| Educational Services | 603 (51.0%) | 580 (49.0%) |
| Health Care & Social Assistance | 66 (23.3%) | 217 (76.7%) |
| Arts, Entertainment & Recreation | 106 (43.3%) | 139 (56.7%) |
| Accommodation & Food Services | 473 (86.6%) | 73 (13.4%) |
| Public Administration | 23 (42.6%) | 31 (57.4%) |
| Total | 2,040 (58.0%) | 1,478 (42.0%) |
Education in Potsdam
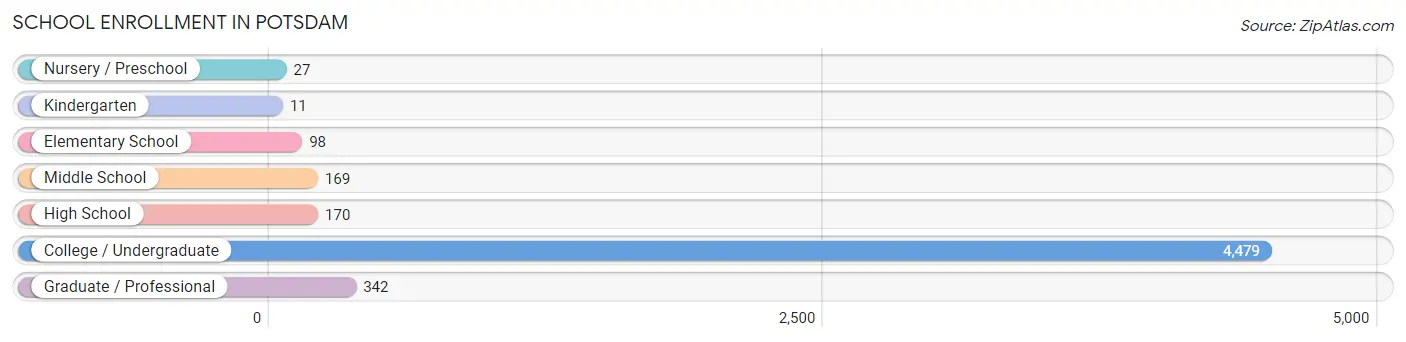
School Enrollment in Potsdam
The most common levels of schooling among the 5,296 students in Potsdam are college / undergraduate (4,479 | 84.6%), graduate / professional (342 | 6.5%), and high school (170 | 3.2%).
| School Level | # Students | % Students |
| Nursery / Preschool | 27 | 0.5% |
| Kindergarten | 11 | 0.2% |
| Elementary School | 98 | 1.8% |
| Middle School | 169 | 3.2% |
| High School | 170 | 3.2% |
| College / Undergraduate | 4,479 | 84.6% |
| Graduate / Professional | 342 | 6.5% |
| Total | 5,296 | 100.0% |
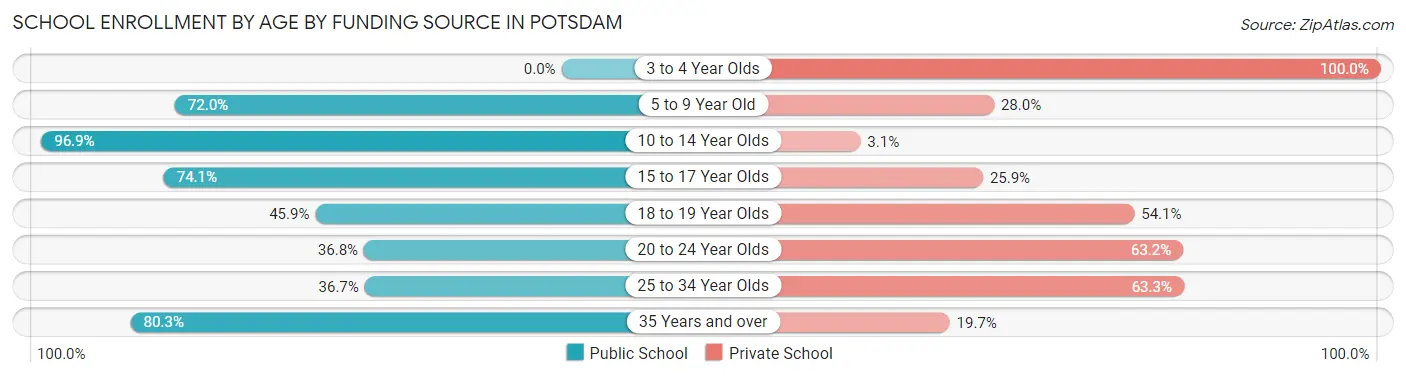
School Enrollment by Age by Funding Source in Potsdam
Out of a total of 5,296 students who are enrolled in schools in Potsdam, 2,892 (54.6%) attend a private institution, while the remaining 2,404 (45.4%) are enrolled in public schools. The age group of 3 to 4 year olds has the highest likelihood of being enrolled in private schools, with 27 (100.0% in the age bracket) enrolled. Conversely, the age group of 10 to 14 year olds has the lowest likelihood of being enrolled in a private school, with 186 (96.9% in the age bracket) attending a public institution.
| Age Bracket | Public School | Private School |
| 3 to 4 Year Olds | 0 (0.0%) | 27 (100.0%) |
| 5 to 9 Year Old | 72 (72.0%) | 28 (28.0%) |
| 10 to 14 Year Olds | 186 (96.9%) | 6 (3.1%) |
| 15 to 17 Year Olds | 177 (74.1%) | 62 (25.9%) |
| 18 to 19 Year Olds | 965 (45.9%) | 1,139 (54.1%) |
| 20 to 24 Year Olds | 853 (36.8%) | 1,465 (63.2%) |
| 25 to 34 Year Olds | 88 (36.7%) | 152 (63.3%) |
| 35 Years and over | 61 (80.3%) | 15 (19.7%) |
| Total | 2,404 (45.4%) | 2,892 (54.6%) |
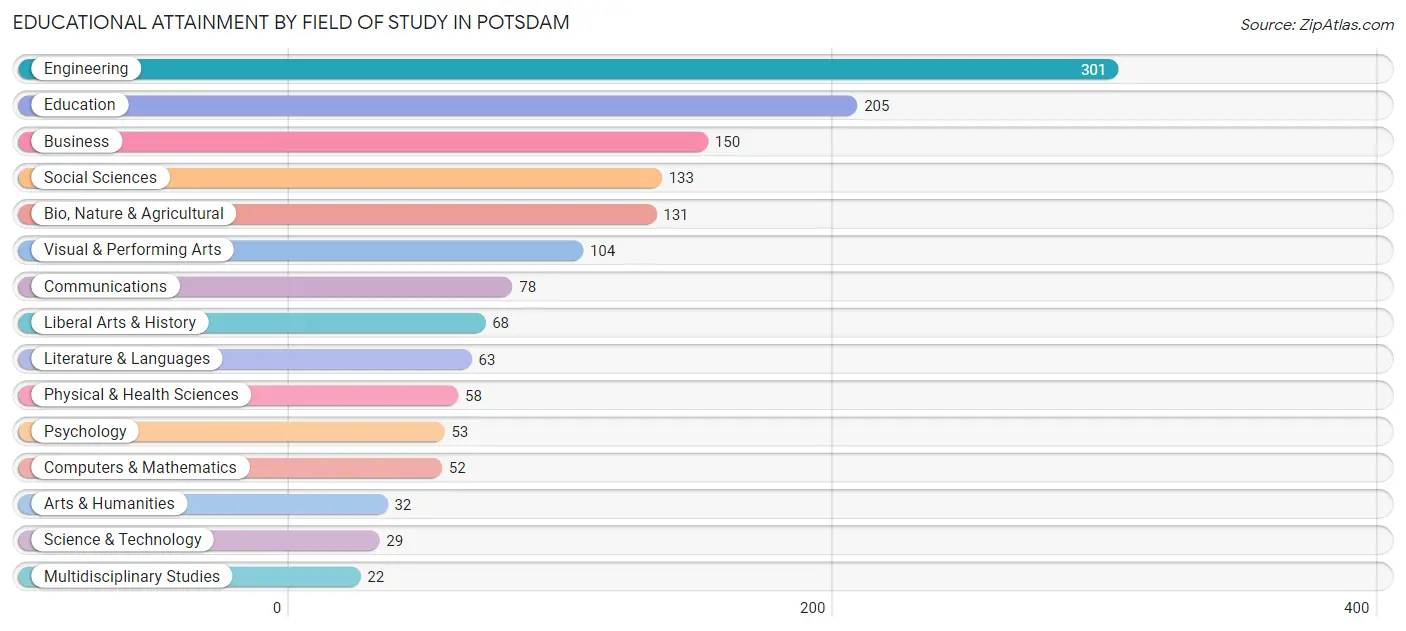
Educational Attainment by Field of Study in Potsdam
Engineering (301 | 20.3%), education (205 | 13.9%), business (150 | 10.1%), social sciences (133 | 9.0%), and bio, nature & agricultural (131 | 8.9%) are the most common fields of study among 1,479 individuals in Potsdam who have obtained a bachelor's degree or higher.
| Field of Study | # Graduates | % Graduates |
| Computers & Mathematics | 52 | 3.5% |
| Bio, Nature & Agricultural | 131 | 8.9% |
| Physical & Health Sciences | 58 | 3.9% |
| Psychology | 53 | 3.6% |
| Social Sciences | 133 | 9.0% |
| Engineering | 301 | 20.3% |
| Multidisciplinary Studies | 22 | 1.5% |
| Science & Technology | 29 | 2.0% |
| Business | 150 | 10.1% |
| Education | 205 | 13.9% |
| Literature & Languages | 63 | 4.3% |
| Liberal Arts & History | 68 | 4.6% |
| Visual & Performing Arts | 104 | 7.0% |
| Communications | 78 | 5.3% |
| Arts & Humanities | 32 | 2.2% |
| Total | 1,479 | 100.0% |
Transportation & Commute in Potsdam
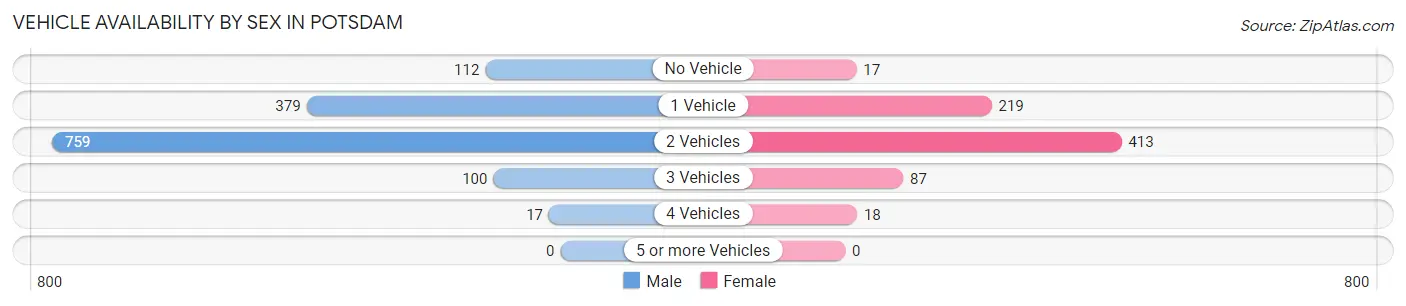
Vehicle Availability by Sex in Potsdam
The most prevalent vehicle ownership categories in Potsdam are males with 2 vehicles (759, accounting for 55.5%) and females with 2 vehicles (413, making up 100.7%).
| Vehicles Available | Male | Female |
| No Vehicle | 112 (8.2%) | 17 (2.2%) |
| 1 Vehicle | 379 (27.7%) | 219 (29.0%) |
| 2 Vehicles | 759 (55.5%) | 413 (54.8%) |
| 3 Vehicles | 100 (7.3%) | 87 (11.5%) |
| 4 Vehicles | 17 (1.2%) | 18 (2.4%) |
| 5 or more Vehicles | 0 (0.0%) | 0 (0.0%) |
| Total | 1,367 (100.0%) | 754 (100.0%) |
Commute Time in Potsdam
The most frequently occuring commute durations in Potsdam are 5 to 9 minutes (873 commuters, 29.1%), 10 to 14 minutes (644 commuters, 21.5%), and 15 to 19 minutes (541 commuters, 18.0%).
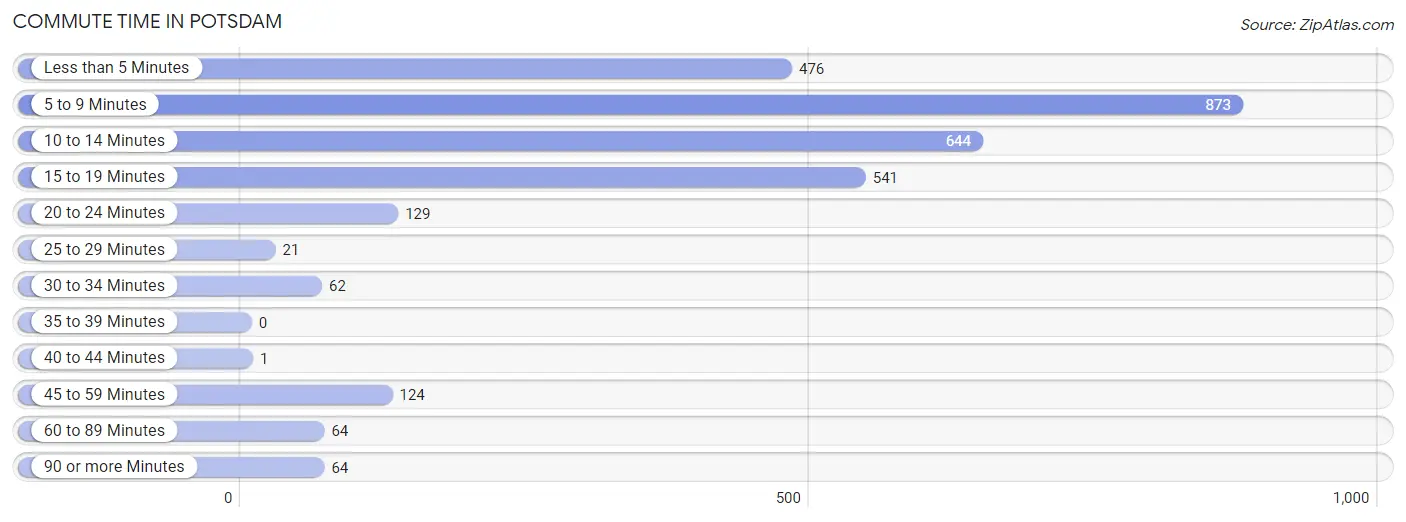
| Commute Time | # Commuters | % Commuters |
| Less than 5 Minutes | 476 | 15.9% |
| 5 to 9 Minutes | 873 | 29.1% |
| 10 to 14 Minutes | 644 | 21.5% |
| 15 to 19 Minutes | 541 | 18.0% |
| 20 to 24 Minutes | 129 | 4.3% |
| 25 to 29 Minutes | 21 | 0.7% |
| 30 to 34 Minutes | 62 | 2.1% |
| 35 to 39 Minutes | 0 | 0.0% |
| 40 to 44 Minutes | 1 | 0.0% |
| 45 to 59 Minutes | 124 | 4.1% |
| 60 to 89 Minutes | 64 | 2.1% |
| 90 or more Minutes | 64 | 2.1% |
Commute Time by Sex in Potsdam
The most common commute times in Potsdam are 5 to 9 minutes (455 commuters, 26.0%) for males and 5 to 9 minutes (418 commuters, 33.4%) for females.
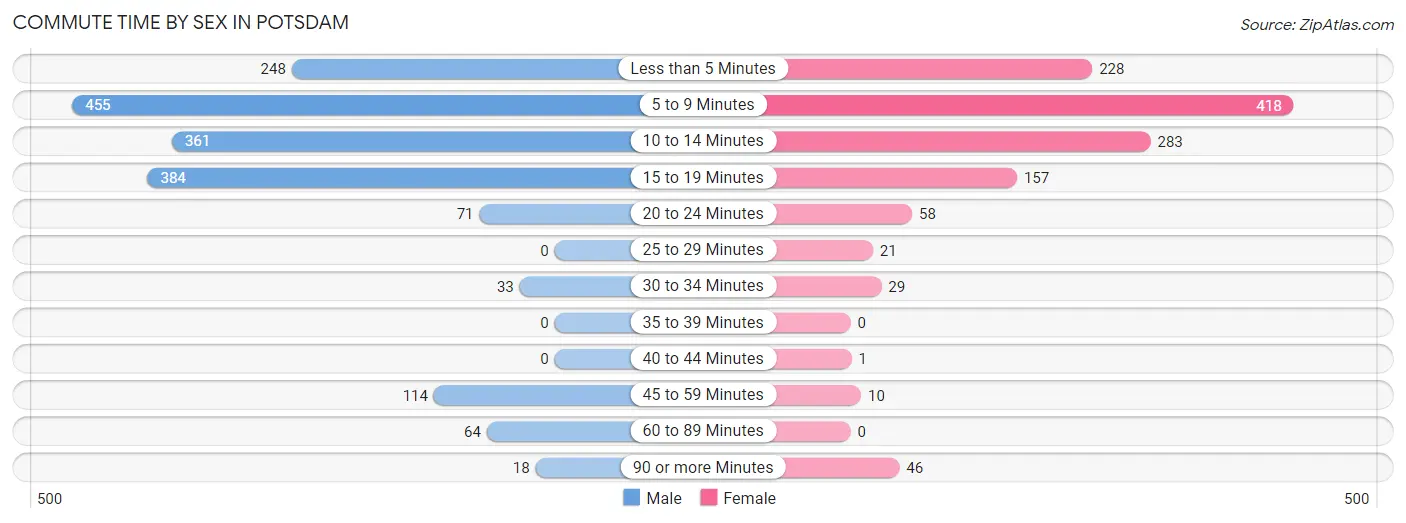
| Commute Time | Male | Female |
| Less than 5 Minutes | 248 (14.2%) | 228 (18.2%) |
| 5 to 9 Minutes | 455 (26.0%) | 418 (33.4%) |
| 10 to 14 Minutes | 361 (20.6%) | 283 (22.6%) |
| 15 to 19 Minutes | 384 (22.0%) | 157 (12.6%) |
| 20 to 24 Minutes | 71 (4.1%) | 58 (4.6%) |
| 25 to 29 Minutes | 0 (0.0%) | 21 (1.7%) |
| 30 to 34 Minutes | 33 (1.9%) | 29 (2.3%) |
| 35 to 39 Minutes | 0 (0.0%) | 0 (0.0%) |
| 40 to 44 Minutes | 0 (0.0%) | 1 (0.1%) |
| 45 to 59 Minutes | 114 (6.5%) | 10 (0.8%) |
| 60 to 89 Minutes | 64 (3.7%) | 0 (0.0%) |
| 90 or more Minutes | 18 (1.0%) | 46 (3.7%) |
Time of Departure to Work by Sex in Potsdam
The most frequent times of departure to work in Potsdam are 12:00 PM to 3:59 PM (358, 20.5%) for males and 9:00 AM to 9:59 AM (257, 20.5%) for females.
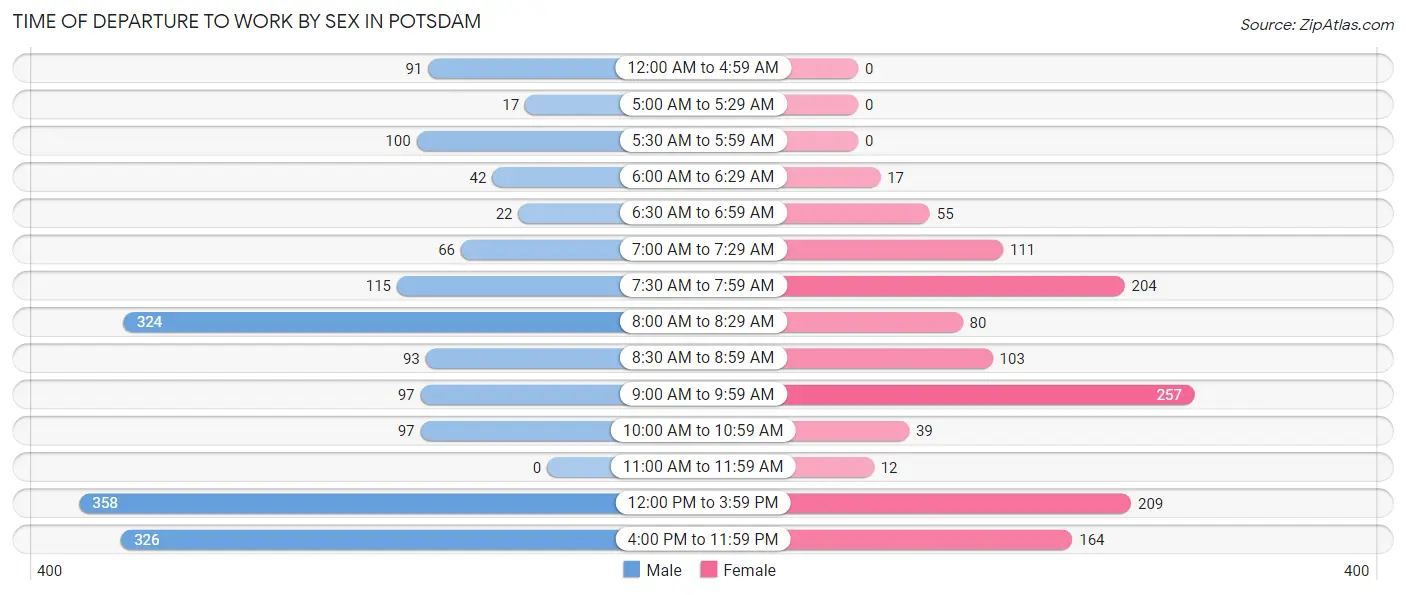
| Time of Departure | Male | Female |
| 12:00 AM to 4:59 AM | 91 (5.2%) | 0 (0.0%) |
| 5:00 AM to 5:29 AM | 17 (1.0%) | 0 (0.0%) |
| 5:30 AM to 5:59 AM | 100 (5.7%) | 0 (0.0%) |
| 6:00 AM to 6:29 AM | 42 (2.4%) | 17 (1.4%) |
| 6:30 AM to 6:59 AM | 22 (1.3%) | 55 (4.4%) |
| 7:00 AM to 7:29 AM | 66 (3.8%) | 111 (8.9%) |
| 7:30 AM to 7:59 AM | 115 (6.6%) | 204 (16.3%) |
| 8:00 AM to 8:29 AM | 324 (18.5%) | 80 (6.4%) |
| 8:30 AM to 8:59 AM | 93 (5.3%) | 103 (8.2%) |
| 9:00 AM to 9:59 AM | 97 (5.6%) | 257 (20.5%) |
| 10:00 AM to 10:59 AM | 97 (5.6%) | 39 (3.1%) |
| 11:00 AM to 11:59 AM | 0 (0.0%) | 12 (1.0%) |
| 12:00 PM to 3:59 PM | 358 (20.5%) | 209 (16.7%) |
| 4:00 PM to 11:59 PM | 326 (18.6%) | 164 (13.1%) |
| Total | 1,748 (100.0%) | 1,251 (100.0%) |
Housing Occupancy in Potsdam
Occupancy by Ownership in Potsdam
Of the total 2,575 dwellings in Potsdam, owner-occupied units account for 938 (36.4%), while renter-occupied units make up 1,637 (63.6%).
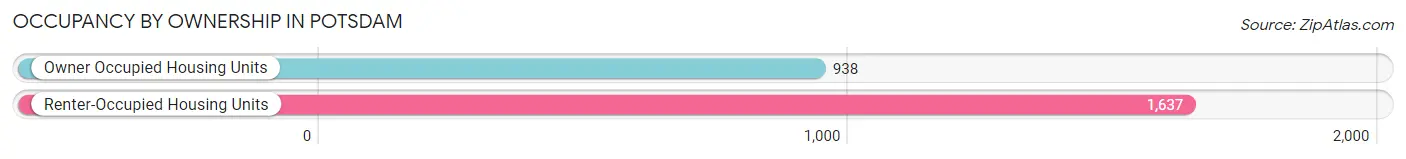
| Occupancy | # Housing Units | % Housing Units |
| Owner Occupied Housing Units | 938 | 36.4% |
| Renter-Occupied Housing Units | 1,637 | 63.6% |
| Total Occupied Housing Units | 2,575 | 100.0% |
Occupancy by Household Size in Potsdam
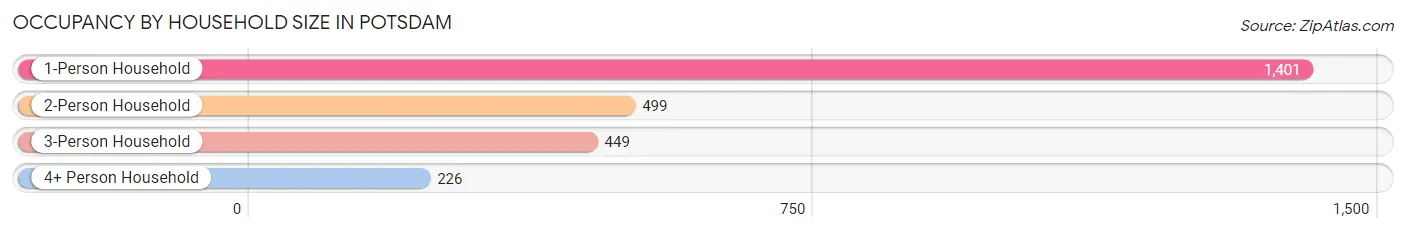
| Household Size | # Housing Units | % Housing Units |
| 1-Person Household | 1,401 | 54.4% |
| 2-Person Household | 499 | 19.4% |
| 3-Person Household | 449 | 17.4% |
| 4+ Person Household | 226 | 8.8% |
| Total Housing Units | 2,575 | 100.0% |
Occupancy by Ownership by Household Size in Potsdam
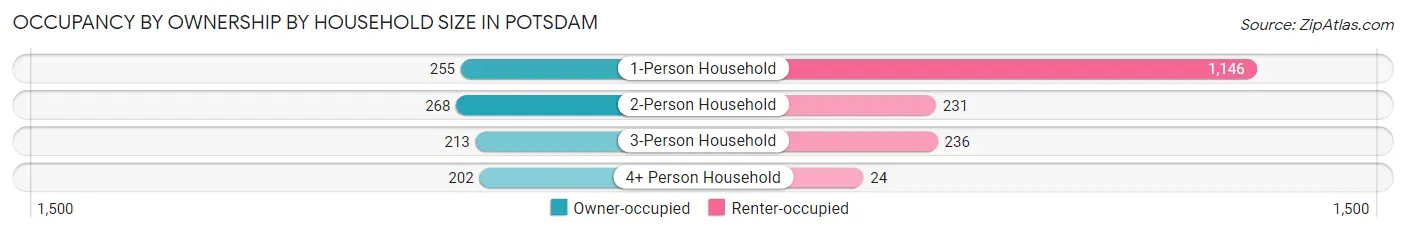
| Household Size | Owner-occupied | Renter-occupied |
| 1-Person Household | 255 (18.2%) | 1,146 (81.8%) |
| 2-Person Household | 268 (53.7%) | 231 (46.3%) |
| 3-Person Household | 213 (47.4%) | 236 (52.6%) |
| 4+ Person Household | 202 (89.4%) | 24 (10.6%) |
| Total Housing Units | 938 (36.4%) | 1,637 (63.6%) |
Occupancy by Educational Attainment in Potsdam
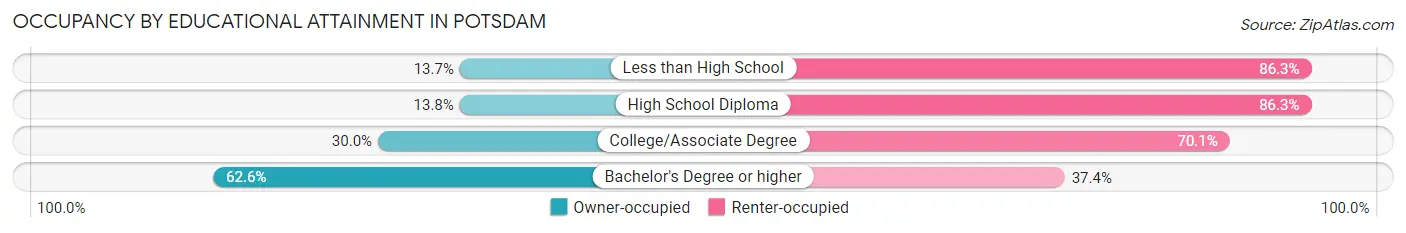
| Household Size | Owner-occupied | Renter-occupied |
| Less than High School | 39 (13.7%) | 245 (86.3%) |
| High School Diploma | 81 (13.8%) | 508 (86.3%) |
| College/Associate Degree | 227 (29.9%) | 531 (70.1%) |
| Bachelor's Degree or higher | 591 (62.6%) | 353 (37.4%) |
Occupancy by Age of Householder in Potsdam
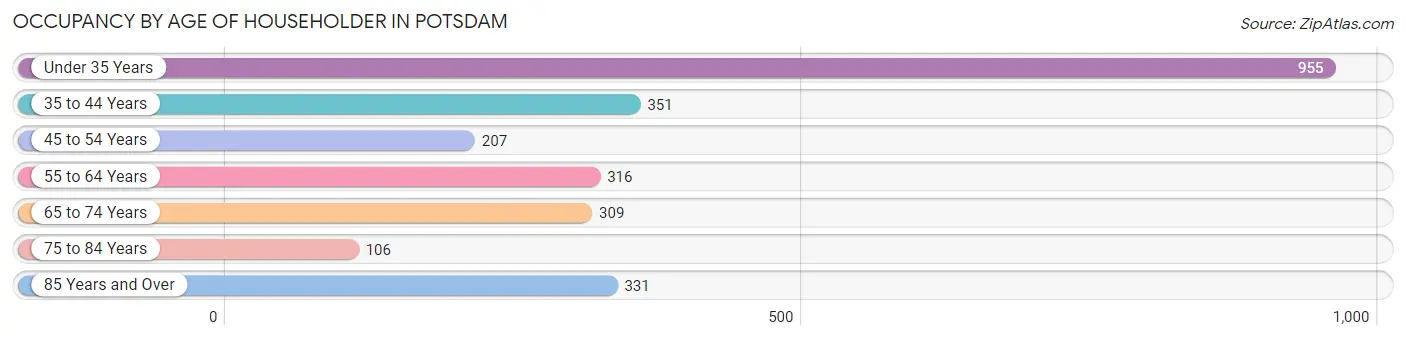
| Age Bracket | # Households | % Households |
| Under 35 Years | 955 | 37.1% |
| 35 to 44 Years | 351 | 13.6% |
| 45 to 54 Years | 207 | 8.0% |
| 55 to 64 Years | 316 | 12.3% |
| 65 to 74 Years | 309 | 12.0% |
| 75 to 84 Years | 106 | 4.1% |
| 85 Years and Over | 331 | 12.9% |
| Total | 2,575 | 100.0% |
Housing Finances in Potsdam
Median Income by Occupancy in Potsdam
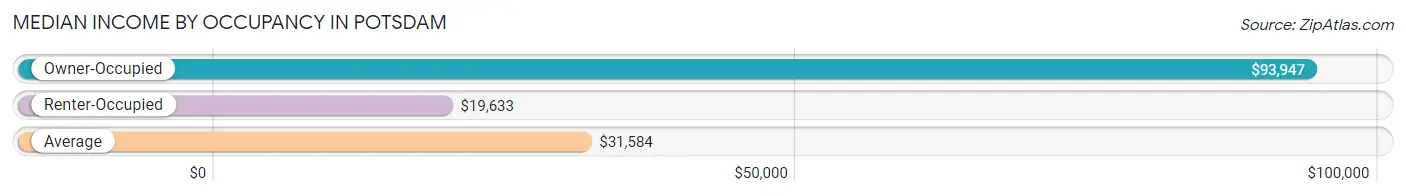
| Occupancy Type | # Households | Median Income |
| Owner-Occupied | 938 (36.4%) | $93,947 |
| Renter-Occupied | 1,637 (63.6%) | $19,633 |
| Average | 2,575 (100.0%) | $31,584 |
Occupancy by Householder Income Bracket in Potsdam
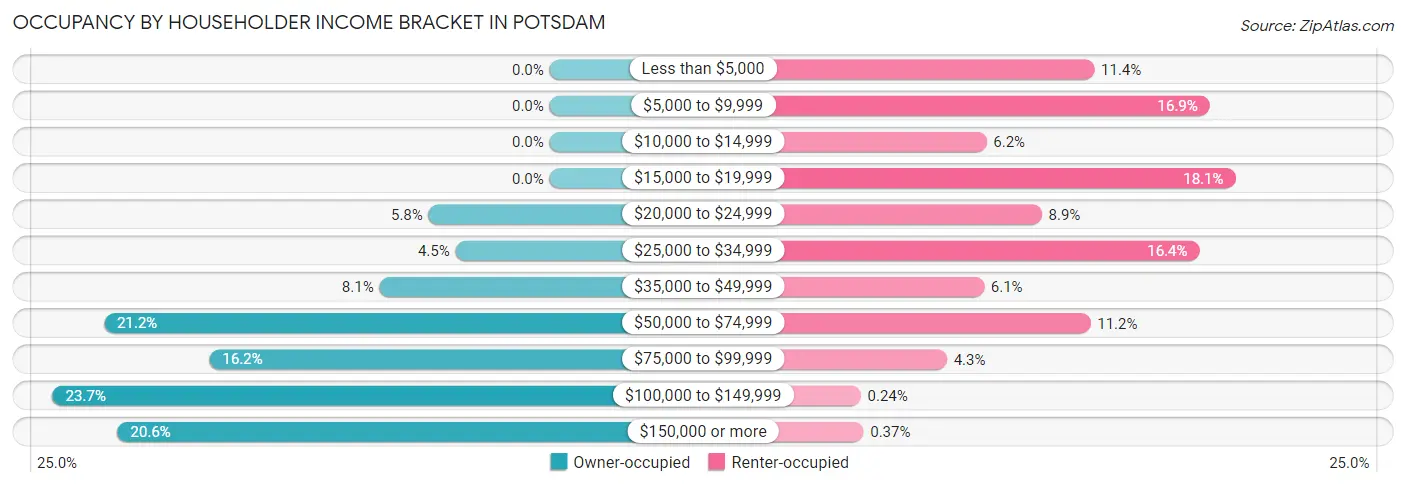
| Income Bracket | Owner-occupied | Renter-occupied |
| Less than $5,000 | 0 (0.0%) | 186 (11.4%) |
| $5,000 to $9,999 | 0 (0.0%) | 276 (16.9%) |
| $10,000 to $14,999 | 0 (0.0%) | 102 (6.2%) |
| $15,000 to $19,999 | 0 (0.0%) | 296 (18.1%) |
| $20,000 to $24,999 | 54 (5.8%) | 145 (8.9%) |
| $25,000 to $34,999 | 42 (4.5%) | 268 (16.4%) |
| $35,000 to $49,999 | 76 (8.1%) | 100 (6.1%) |
| $50,000 to $74,999 | 199 (21.2%) | 183 (11.2%) |
| $75,000 to $99,999 | 152 (16.2%) | 71 (4.3%) |
| $100,000 to $149,999 | 222 (23.7%) | 4 (0.2%) |
| $150,000 or more | 193 (20.6%) | 6 (0.4%) |
| Total | 938 (100.0%) | 1,637 (100.0%) |
Monthly Housing Cost Tiers in Potsdam
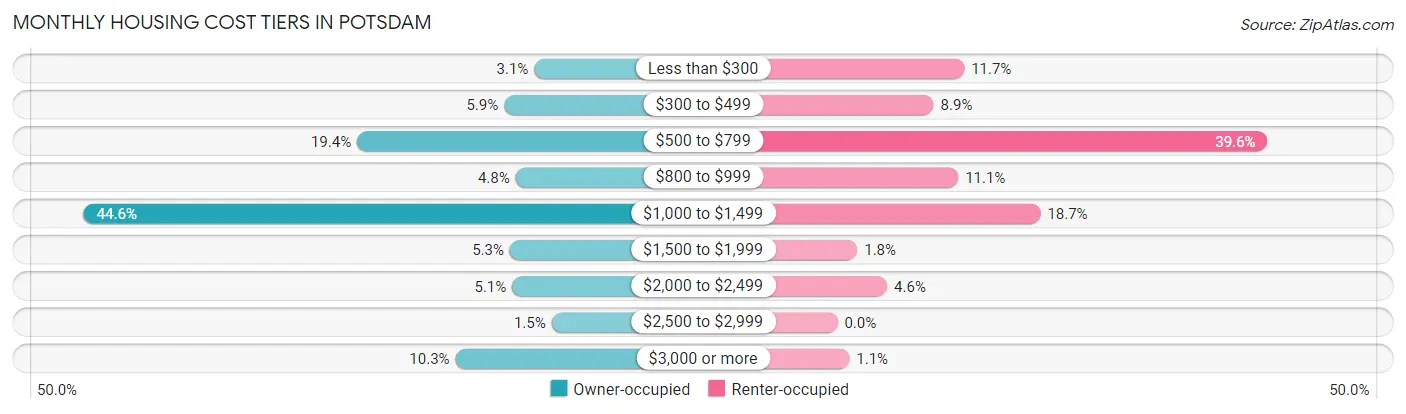
| Monthly Cost | Owner-occupied | Renter-occupied |
| Less than $300 | 29 (3.1%) | 191 (11.7%) |
| $300 to $499 | 55 (5.9%) | 145 (8.9%) |
| $500 to $799 | 182 (19.4%) | 648 (39.6%) |
| $800 to $999 | 45 (4.8%) | 182 (11.1%) |
| $1,000 to $1,499 | 418 (44.6%) | 306 (18.7%) |
| $1,500 to $1,999 | 50 (5.3%) | 30 (1.8%) |
| $2,000 to $2,499 | 48 (5.1%) | 75 (4.6%) |
| $2,500 to $2,999 | 14 (1.5%) | 0 (0.0%) |
| $3,000 or more | 97 (10.3%) | 18 (1.1%) |
| Total | 938 (100.0%) | 1,637 (100.0%) |
Physical Housing Characteristics in Potsdam
Housing Structures in Potsdam
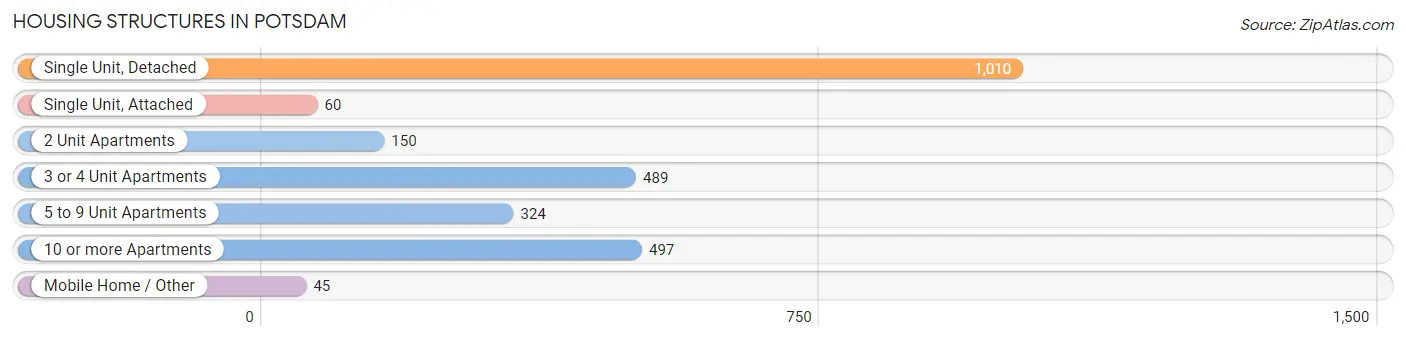
| Structure Type | # Housing Units | % Housing Units |
| Single Unit, Detached | 1,010 | 39.2% |
| Single Unit, Attached | 60 | 2.3% |
| 2 Unit Apartments | 150 | 5.8% |
| 3 or 4 Unit Apartments | 489 | 19.0% |
| 5 to 9 Unit Apartments | 324 | 12.6% |
| 10 or more Apartments | 497 | 19.3% |
| Mobile Home / Other | 45 | 1.8% |
| Total | 2,575 | 100.0% |
Housing Structures by Occupancy in Potsdam
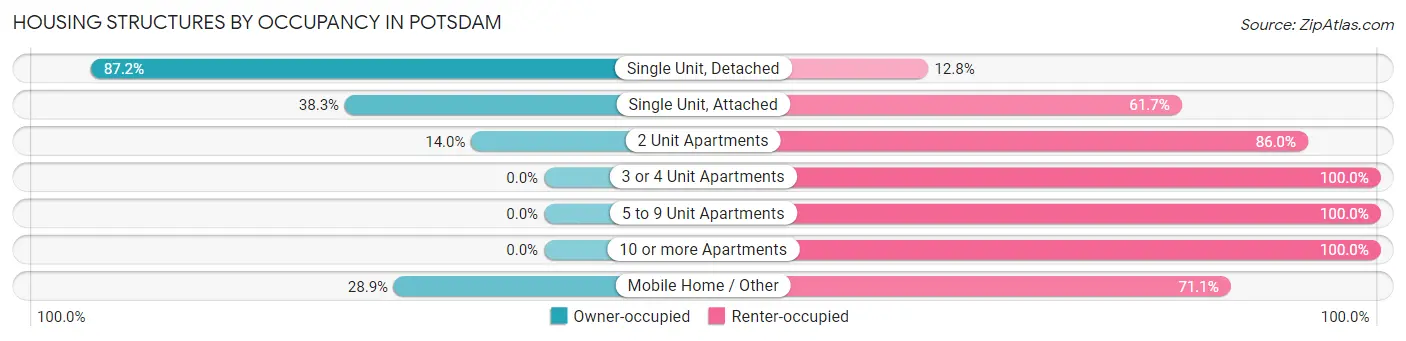
| Structure Type | Owner-occupied | Renter-occupied |
| Single Unit, Detached | 881 (87.2%) | 129 (12.8%) |
| Single Unit, Attached | 23 (38.3%) | 37 (61.7%) |
| 2 Unit Apartments | 21 (14.0%) | 129 (86.0%) |
| 3 or 4 Unit Apartments | 0 (0.0%) | 489 (100.0%) |
| 5 to 9 Unit Apartments | 0 (0.0%) | 324 (100.0%) |
| 10 or more Apartments | 0 (0.0%) | 497 (100.0%) |
| Mobile Home / Other | 13 (28.9%) | 32 (71.1%) |
| Total | 938 (36.4%) | 1,637 (63.6%) |
Housing Structures by Number of Rooms in Potsdam
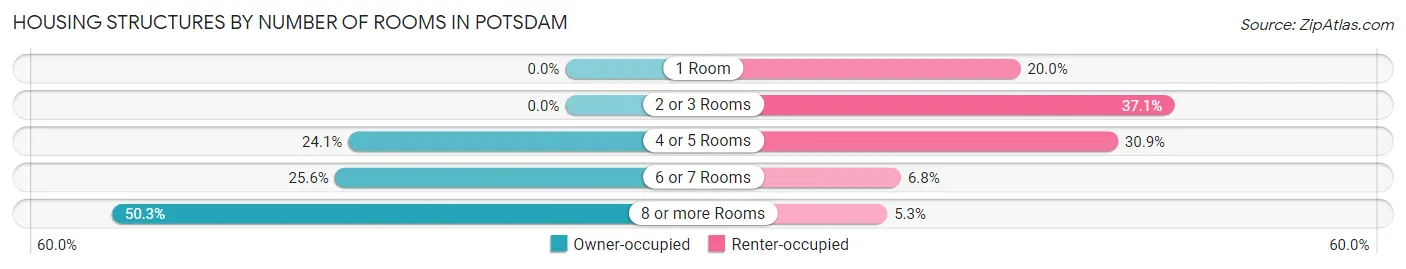
| Number of Rooms | Owner-occupied | Renter-occupied |
| 1 Room | 0 (0.0%) | 328 (20.0%) |
| 2 or 3 Rooms | 0 (0.0%) | 607 (37.1%) |
| 4 or 5 Rooms | 226 (24.1%) | 505 (30.8%) |
| 6 or 7 Rooms | 240 (25.6%) | 111 (6.8%) |
| 8 or more Rooms | 472 (50.3%) | 86 (5.2%) |
| Total | 938 (100.0%) | 1,637 (100.0%) |
Housing Structure by Heating Type in Potsdam
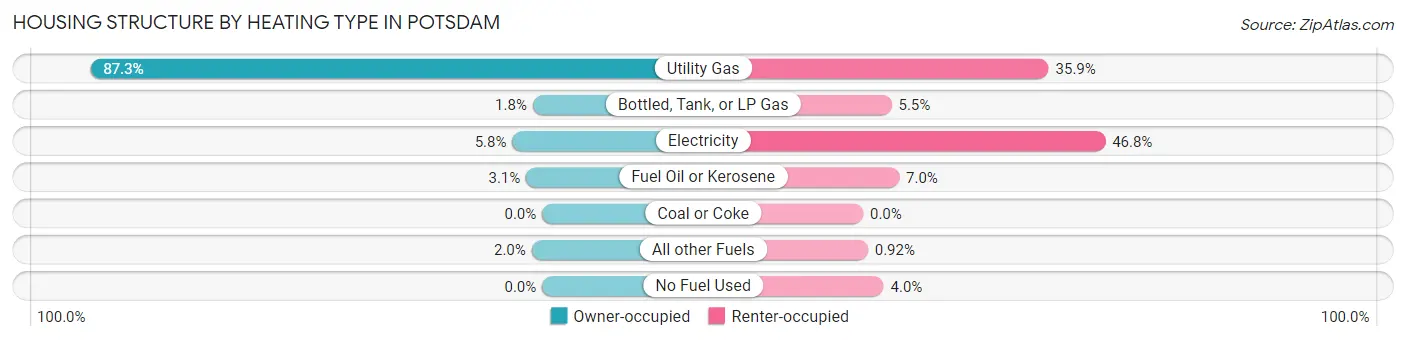
| Heating Type | Owner-occupied | Renter-occupied |
| Utility Gas | 819 (87.3%) | 587 (35.9%) |
| Bottled, Tank, or LP Gas | 17 (1.8%) | 90 (5.5%) |
| Electricity | 54 (5.8%) | 766 (46.8%) |
| Fuel Oil or Kerosene | 29 (3.1%) | 114 (7.0%) |
| Coal or Coke | 0 (0.0%) | 0 (0.0%) |
| All other Fuels | 19 (2.0%) | 15 (0.9%) |
| No Fuel Used | 0 (0.0%) | 65 (4.0%) |
| Total | 938 (100.0%) | 1,637 (100.0%) |
Household Vehicle Usage in Potsdam
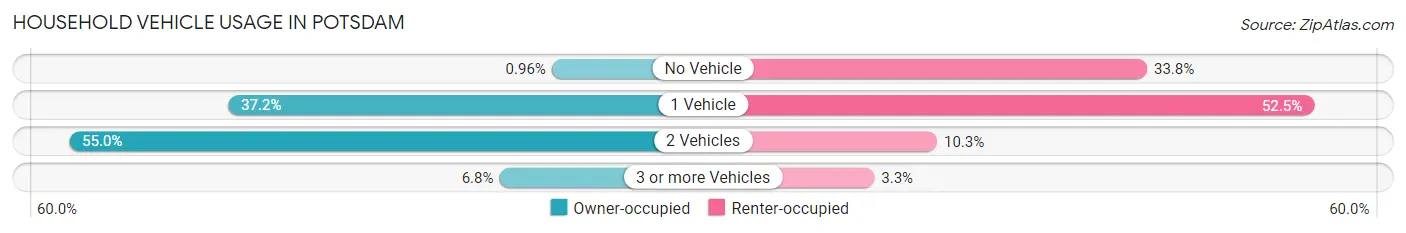
| Vehicles per Household | Owner-occupied | Renter-occupied |
| No Vehicle | 9 (1.0%) | 554 (33.8%) |
| 1 Vehicle | 349 (37.2%) | 860 (52.5%) |
| 2 Vehicles | 516 (55.0%) | 169 (10.3%) |
| 3 or more Vehicles | 64 (6.8%) | 54 (3.3%) |
| Total | 938 (100.0%) | 1,637 (100.0%) |
Real Estate & Mortgages in Potsdam
Real Estate and Mortgage Overview in Potsdam
| Characteristic | Without Mortgage | With Mortgage |
| Housing Units | 454 | 484 |
| Median Property Value | $147,300 | $137,900 |
| Median Household Income | $79,097 | $129 |
| Monthly Housing Costs | $753 | $97 |
| Real Estate Taxes | $5,182 | $4 |
Property Value by Mortgage Status in Potsdam

| Property Value | Without Mortgage | With Mortgage |
| Less than $50,000 | 11 (2.4%) | 0 (0.0%) |
| $50,000 to $99,999 | 85 (18.7%) | 142 (29.3%) |
| $100,000 to $299,999 | 307 (67.6%) | 287 (59.3%) |
| $300,000 to $499,999 | 11 (2.4%) | 24 (5.0%) |
| $500,000 to $749,999 | 11 (2.4%) | 3 (0.6%) |
| $750,000 to $999,999 | 0 (0.0%) | 12 (2.5%) |
| $1,000,000 or more | 29 (6.4%) | 16 (3.3%) |
| Total | 454 (100.0%) | 484 (100.0%) |
Household Income by Mortgage Status in Potsdam
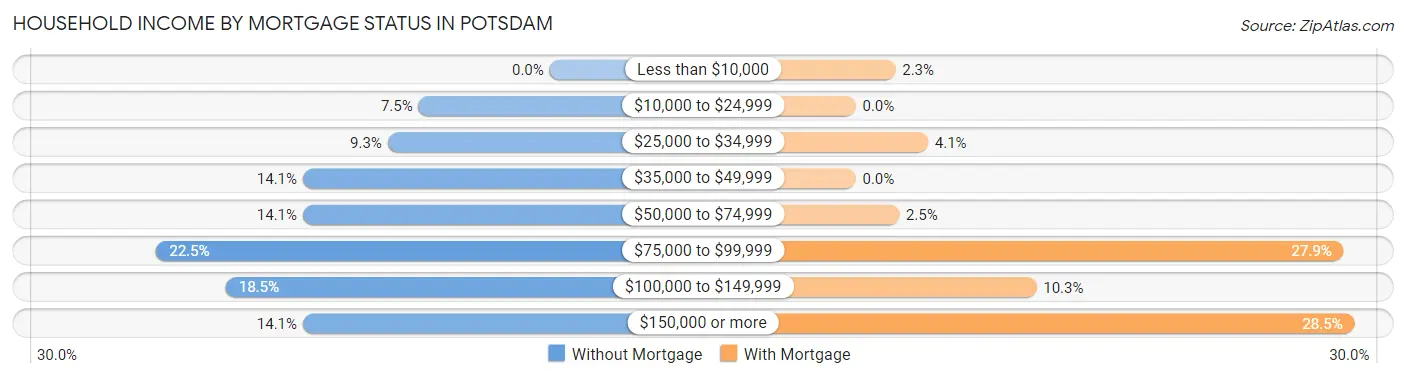
| Household Income | Without Mortgage | With Mortgage |
| Less than $10,000 | 0 (0.0%) | 11 (2.3%) |
| $10,000 to $24,999 | 34 (7.5%) | 0 (0.0%) |
| $25,000 to $34,999 | 42 (9.2%) | 20 (4.1%) |
| $35,000 to $49,999 | 64 (14.1%) | 0 (0.0%) |
| $50,000 to $74,999 | 64 (14.1%) | 12 (2.5%) |
| $75,000 to $99,999 | 102 (22.5%) | 135 (27.9%) |
| $100,000 to $149,999 | 84 (18.5%) | 50 (10.3%) |
| $150,000 or more | 64 (14.1%) | 138 (28.5%) |
| Total | 454 (100.0%) | 484 (100.0%) |
Property Value to Household Income Ratio in Potsdam
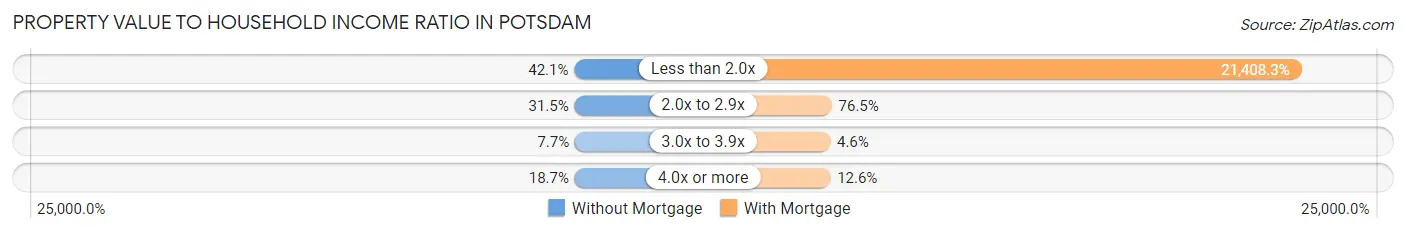
| Value-to-Income Ratio | Without Mortgage | With Mortgage |
| Less than 2.0x | 191 (42.1%) | 103,616 (21,408.3%) |
| 2.0x to 2.9x | 143 (31.5%) | 370 (76.4%) |
| 3.0x to 3.9x | 35 (7.7%) | 22 (4.5%) |
| 4.0x or more | 85 (18.7%) | 61 (12.6%) |
| Total | 454 (100.0%) | 484 (100.0%) |
Real Estate Taxes by Mortgage Status in Potsdam
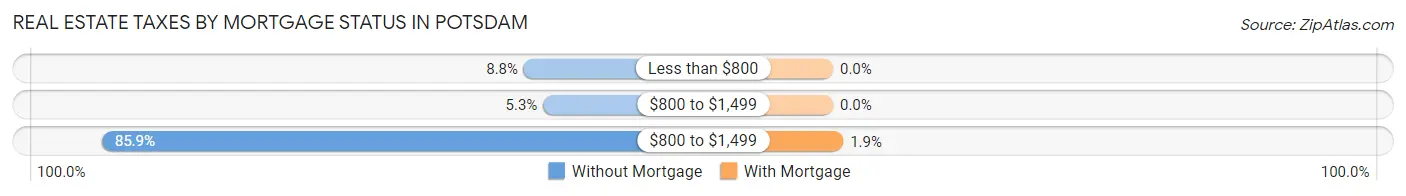
| Property Taxes | Without Mortgage | With Mortgage |
| Less than $800 | 40 (8.8%) | 0 (0.0%) |
| $800 to $1,499 | 24 (5.3%) | 0 (0.0%) |
| $800 to $1,499 | 390 (85.9%) | 9 (1.9%) |
| Total | 454 (100.0%) | 484 (100.0%) |
Health & Disability in Potsdam
Health Insurance Coverage by Age in Potsdam
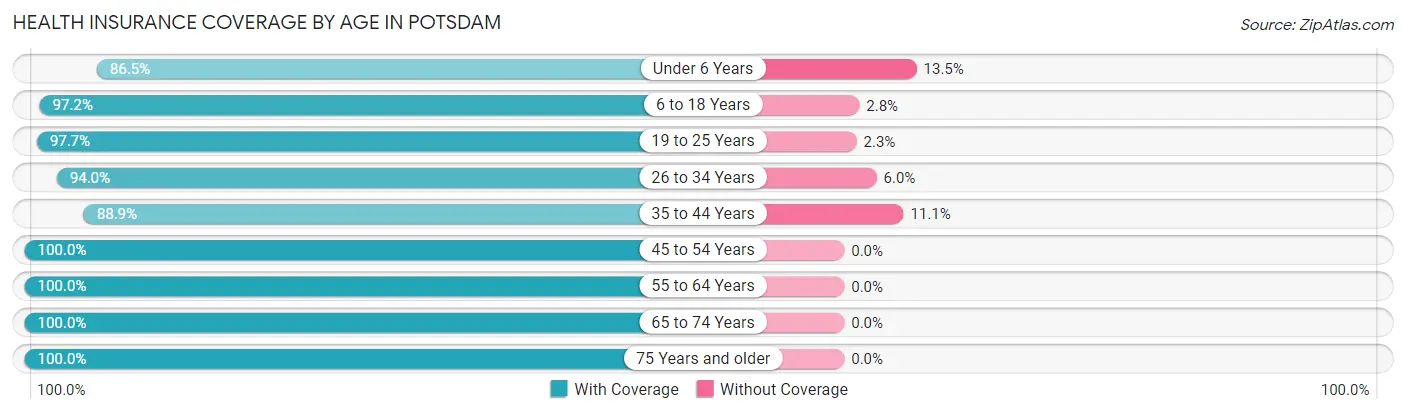
| Age Bracket | With Coverage | Without Coverage |
| Under 6 Years | 122 (86.5%) | 19 (13.5%) |
| 6 to 18 Years | 1,282 (97.2%) | 37 (2.8%) |
| 19 to 25 Years | 4,049 (97.7%) | 95 (2.3%) |
| 26 to 34 Years | 531 (94.0%) | 34 (6.0%) |
| 35 to 44 Years | 563 (88.9%) | 70 (11.1%) |
| 45 to 54 Years | 427 (100.0%) | 0 (0.0%) |
| 55 to 64 Years | 477 (100.0%) | 0 (0.0%) |
| 65 to 74 Years | 397 (100.0%) | 0 (0.0%) |
| 75 Years and older | 464 (100.0%) | 0 (0.0%) |
| Total | 8,312 (97.0%) | 255 (3.0%) |
Health Insurance Coverage by Citizenship Status in Potsdam
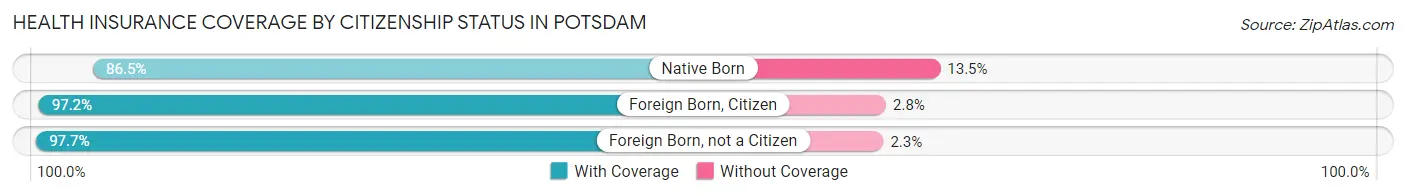
| Citizenship Status | With Coverage | Without Coverage |
| Native Born | 122 (86.5%) | 19 (13.5%) |
| Foreign Born, Citizen | 1,282 (97.2%) | 37 (2.8%) |
| Foreign Born, not a Citizen | 4,049 (97.7%) | 95 (2.3%) |
Health Insurance Coverage by Household Income in Potsdam
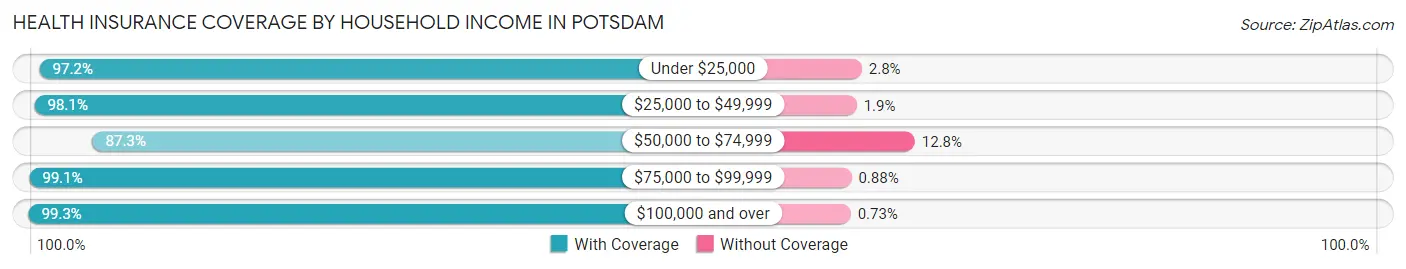
| Household Income | With Coverage | Without Coverage |
| Under $25,000 | 1,204 (97.2%) | 35 (2.8%) |
| $25,000 to $49,999 | 842 (98.1%) | 16 (1.9%) |
| $50,000 to $74,999 | 705 (87.3%) | 103 (12.8%) |
| $75,000 to $99,999 | 453 (99.1%) | 4 (0.9%) |
| $100,000 and over | 1,231 (99.3%) | 9 (0.7%) |
Public vs Private Health Insurance Coverage by Age in Potsdam
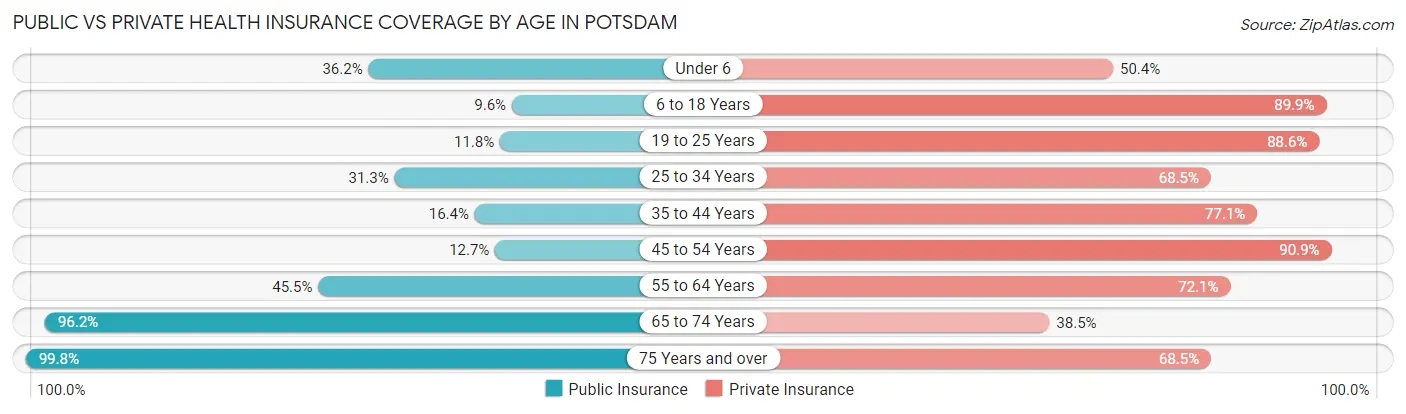
| Age Bracket | Public Insurance | Private Insurance |
| Under 6 | 51 (36.2%) | 71 (50.3%) |
| 6 to 18 Years | 126 (9.6%) | 1,186 (89.9%) |
| 19 to 25 Years | 487 (11.7%) | 3,672 (88.6%) |
| 25 to 34 Years | 177 (31.3%) | 387 (68.5%) |
| 35 to 44 Years | 104 (16.4%) | 488 (77.1%) |
| 45 to 54 Years | 54 (12.7%) | 388 (90.9%) |
| 55 to 64 Years | 217 (45.5%) | 344 (72.1%) |
| 65 to 74 Years | 382 (96.2%) | 153 (38.5%) |
| 75 Years and over | 463 (99.8%) | 318 (68.5%) |
| Total | 2,061 (24.1%) | 7,007 (81.8%) |
Disability Status by Sex by Age in Potsdam
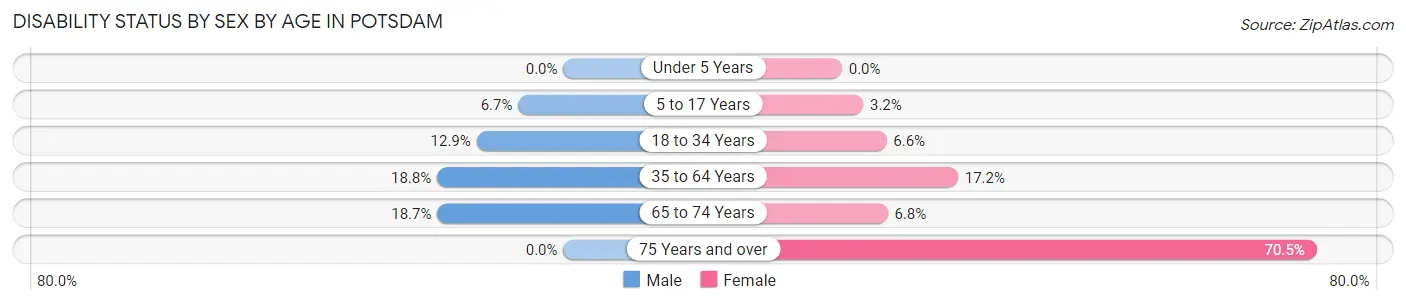
| Age Bracket | Male | Female |
| Under 5 Years | 0 (0.0%) | 0 (0.0%) |
| 5 to 17 Years | 17 (6.7%) | 9 (3.2%) |
| 18 to 34 Years | 412 (12.9%) | 152 (6.6%) |
| 35 to 64 Years | 161 (18.8%) | 117 (17.2%) |
| 65 to 74 Years | 44 (18.7%) | 11 (6.8%) |
| 75 Years and over | 0 (0.0%) | 306 (70.5%) |
Disability Class by Sex by Age in Potsdam
Disability Class: Hearing Difficulty
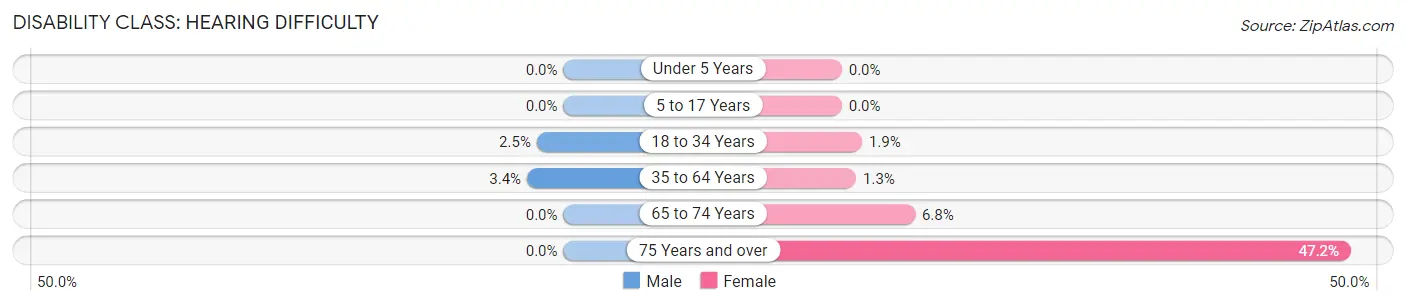
| Age Bracket | Male | Female |
| Under 5 Years | 0 (0.0%) | 0 (0.0%) |
| 5 to 17 Years | 0 (0.0%) | 0 (0.0%) |
| 18 to 34 Years | 79 (2.5%) | 43 (1.9%) |
| 35 to 64 Years | 29 (3.4%) | 9 (1.3%) |
| 65 to 74 Years | 0 (0.0%) | 11 (6.8%) |
| 75 Years and over | 0 (0.0%) | 205 (47.2%) |
Disability Class: Vision Difficulty
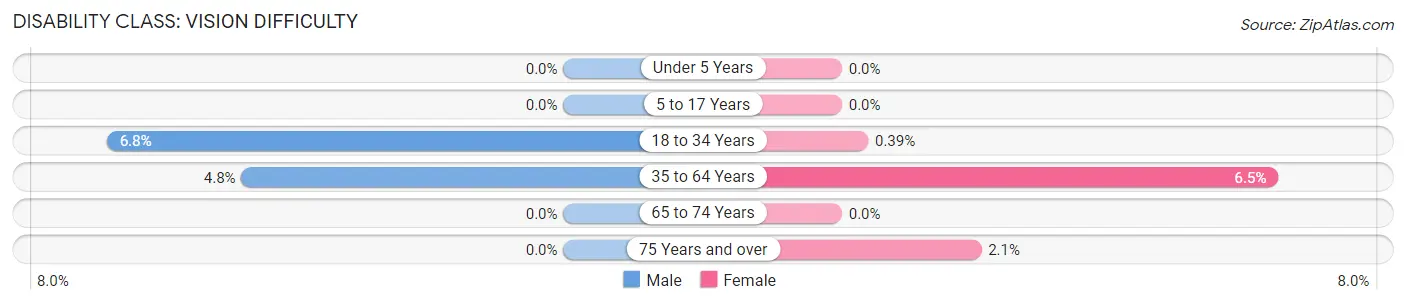
| Age Bracket | Male | Female |
| Under 5 Years | 0 (0.0%) | 0 (0.0%) |
| 5 to 17 Years | 0 (0.0%) | 0 (0.0%) |
| 18 to 34 Years | 217 (6.8%) | 9 (0.4%) |
| 35 to 64 Years | 41 (4.8%) | 44 (6.5%) |
| 65 to 74 Years | 0 (0.0%) | 0 (0.0%) |
| 75 Years and over | 0 (0.0%) | 9 (2.1%) |
Disability Class: Cognitive Difficulty
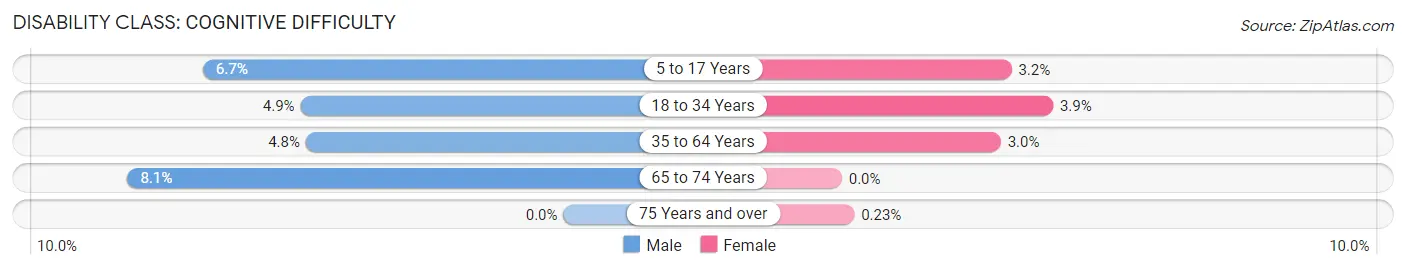
| Age Bracket | Male | Female |
| 5 to 17 Years | 17 (6.7%) | 9 (3.2%) |
| 18 to 34 Years | 156 (4.9%) | 90 (3.9%) |
| 35 to 64 Years | 41 (4.8%) | 20 (2.9%) |
| 65 to 74 Years | 19 (8.1%) | 0 (0.0%) |
| 75 Years and over | 0 (0.0%) | 1 (0.2%) |
Disability Class: Ambulatory Difficulty
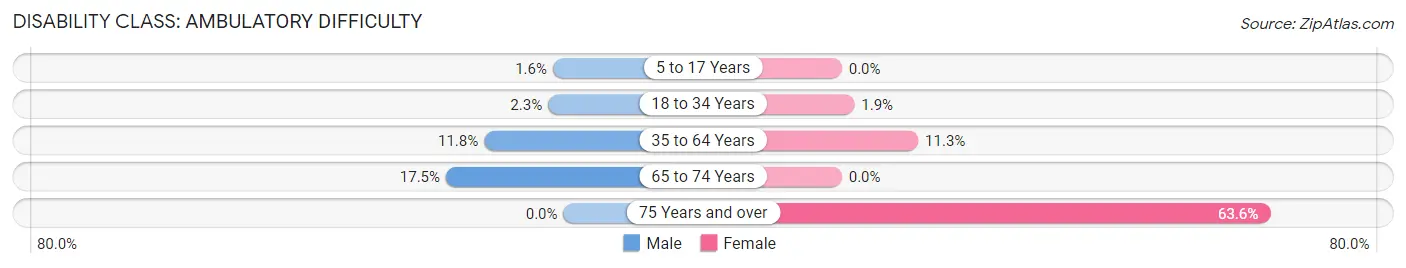
| Age Bracket | Male | Female |
| 5 to 17 Years | 4 (1.6%) | 0 (0.0%) |
| 18 to 34 Years | 73 (2.3%) | 43 (1.9%) |
| 35 to 64 Years | 101 (11.8%) | 77 (11.3%) |
| 65 to 74 Years | 41 (17.4%) | 0 (0.0%) |
| 75 Years and over | 0 (0.0%) | 276 (63.6%) |
Disability Class: Self-Care Difficulty
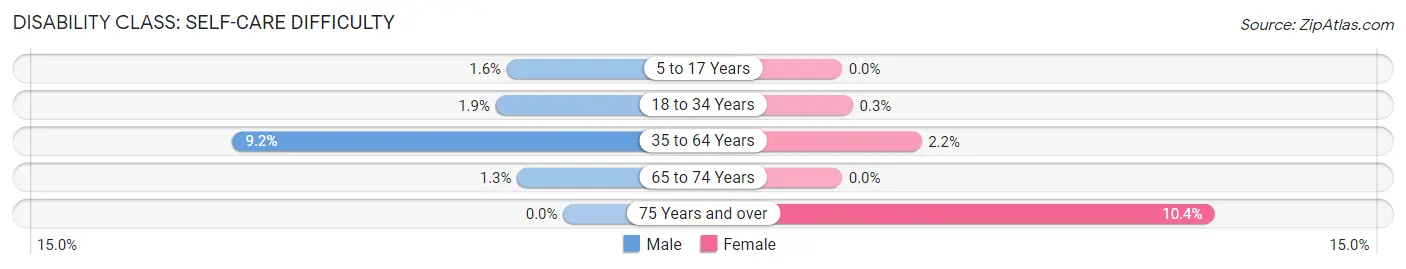
| Age Bracket | Male | Female |
| 5 to 17 Years | 4 (1.6%) | 0 (0.0%) |
| 18 to 34 Years | 60 (1.9%) | 7 (0.3%) |
| 35 to 64 Years | 79 (9.2%) | 15 (2.2%) |
| 65 to 74 Years | 3 (1.3%) | 0 (0.0%) |
| 75 Years and over | 0 (0.0%) | 45 (10.4%) |
Technology Access in Potsdam
Computing Device Access in Potsdam
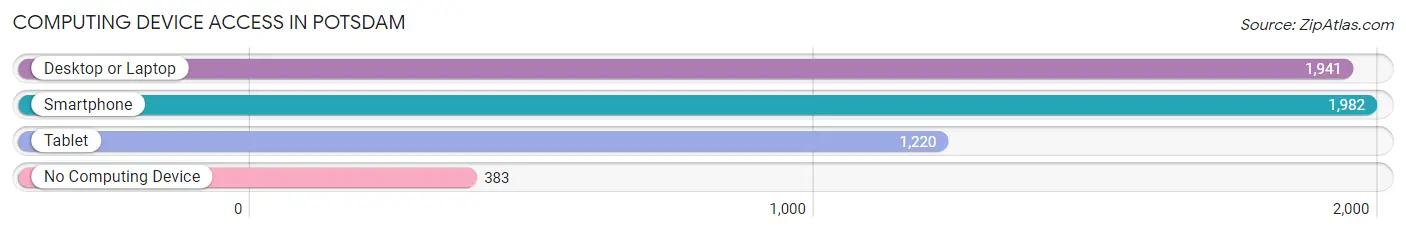
| Device Type | # Households | % Households |
| Desktop or Laptop | 1,941 | 75.4% |
| Smartphone | 1,982 | 77.0% |
| Tablet | 1,220 | 47.4% |
| No Computing Device | 383 | 14.9% |
| Total | 2,575 | 100.0% |
Internet Access in Potsdam
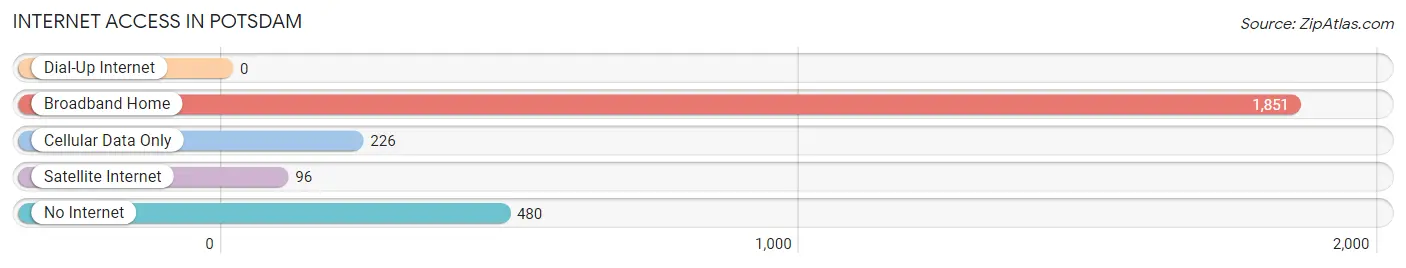
| Internet Type | # Households | % Households |
| Dial-Up Internet | 0 | 0.0% |
| Broadband Home | 1,851 | 71.9% |
| Cellular Data Only | 226 | 8.8% |
| Satellite Internet | 96 | 3.7% |
| No Internet | 480 | 18.6% |
| Total | 2,575 | 100.0% |
Potsdam Summary
Potsdam is a town located in St. Lawrence County, New York, United States. The population was 11,817 at the 2010 census. It is the home of Clarkson University and the State University of New York at Potsdam. The town is named after the city of Potsdam in Germany.
History
The area that is now Potsdam was first settled in 1772 by Zephaniah and Abigail Platt. The Platts were from Connecticut and were among the first settlers in the area. The town of Potsdam was established in 1806 from part of the town of Madrid. The town was named after the city of Potsdam in Germany.
In 1812, the first sawmill was built in the town. This was followed by a gristmill in 1817 and a woolen mill in 1820. The first schoolhouse was built in 1820 and the first church was built in 1825.
In 1844, the first railroad was built in the town. This was followed by the opening of the Potsdam and Norwood Railroad in 1851. The railroad allowed for the transportation of goods and people to and from the town.
In 1853, the first college in the town was established. This was Clarkson University, which was founded by Thomas S. Clarkson. The college was named after his father, Thomas C. Clarkson.
In 1856 the first newspaper in the town was established This was the Potsdam Courier
In 1864 the first bank in the town was established This was the Potsdam Bank
In 1871 the first hospital in the town was established This was the Potsdam Hospital
In 1875 the first public library in the town was established This was the Potsdam Public Library
In 1876, the first fire department in the town was established. This was the Potsdam Fire Department.
In 1877, the first telephone exchange in the town was established. This was the Potsdam Telephone Exchange.
In 1878, the first electric light plant in the town was established. This was the Potsdam Electric Light Plant.
In 1879 the first waterworks in the town was established This was the Potsdam Waterworks
In 1881 the first post office in the town was established This was the Potsdam Post Office
Geography
Potsdam is located in the northern part of St. Lawrence County. It is bordered by the towns of Canton to the north, Madrid to the east, Parishville to the south, and Colton to the west.
The town is located in the Adirondack Mountains and is home to several lakes, including Raquette Lake, Little Tupper Lake, and Big Tupper Lake. The Raquette River flows through the town.
Economy
The economy of Potsdam is largely based on education manufacturing and tourism
Clarkson University is the largest employer in the town. The university has an enrollment of over 4,000 students and employs over 1,000 faculty and staff.
The town is also home to several manufacturing companies, including Potsdam Specialty Paper, Potsdam Plastics, and Potsdam Wood Products.
Tourism is also an important part of the economy. The town is home to several attractions, including the Potsdam Public Museum, the Potsdam Sandstone Quarries, and the Potsdam Summer Festival.
Demographics
As of the 2010 census, there were 11,817 people, 4,717 households, and 2,717 families residing in the town. The population density was 517.3 people per square mile (199.7/km2). There were 5,093 housing units at an average density of 224.3 per square mile (86.6/km2). The racial makeup of the town was 94.2% White, 1.7% African American, 0.4% Native American, 1.7% Asian, 0.1% Pacific Islander, 0.7% from other races, and 1.3% from two or more races. Hispanic or Latino of any race were 2.3% of the population.
There were 4,717 households, out of which 24.2% had children under the age of 18 living with them, 44.2% were married couples living together, 10.2% had a female householder with no husband present, and 41.3% were non-families. 33.2% of all households were made up of individuals, and 13.2% had someone living alone who was 65 years of age or older. The average household size was 2.25 and the average family size was 2.86.
In the town, the population was spread out, with 19.7% under the age of 18, 24.2% from 18 to 24, 22.2% from 25 to 44, 21.3% from 45 to 64, and 12.6% who were 65 years of age or older. The median age was 33 years. For every 100 females, there were 87.2 males. For every 100 females age 18 and over, there were 83.7 males.
The median income for a household in the town was $37,917, and the median income for a family was $50,917. Males had a median income of $35,917 versus $27,917 for females. The per capita income for the town was $20,917. About 8.2% of families and 14.2% of the population were below the poverty line, including 15.2% of those under age 18 and 8.2% of those age 65 or over.
Common Questions
What is Per Capita Income in Potsdam?
Per Capita income in Potsdam is $21,008.
What is the Median Family Income in Potsdam?
Median Family Income in Potsdam is $79,097.
What is the Median Household income in Potsdam?
Median Household Income in Potsdam is $31,584.
What is Income or Wage Gap in Potsdam?
Income or Wage Gap in Potsdam is 22.4%.
Women in Potsdam earn 77.6 cents for every dollar earned by a man.
What is Family Income Deficit in Potsdam?
Family Income Deficit in Potsdam is $9,763.
Families that are below poverty line in Potsdam earn $9,763 less on average than the poverty threshold level.
What is Inequality or Gini Index in Potsdam?
Inequality or Gini Index in Potsdam is 0.55.
What is the Total Population of Potsdam?
Total Population of Potsdam is 8,570.
What is the Total Male Population of Potsdam?
Total Male Population of Potsdam is 4,674.
What is the Total Female Population of Potsdam?
Total Female Population of Potsdam is 3,896.
What is the Ratio of Males per 100 Females in Potsdam?
There are 119.97 Males per 100 Females in Potsdam.
What is the Ratio of Females per 100 Males in Potsdam?
There are 83.35 Females per 100 Males in Potsdam.
What is the Median Population Age in Potsdam?
Median Population Age in Potsdam is 21.7 Years.
What is the Average Family Size in Potsdam
Average Family Size in Potsdam is 2.7 People.
What is the Average Household Size in Potsdam
Average Household Size in Potsdam is 1.8 People.
How Large is the Labor Force in Potsdam?
There are 3,880 People in the Labor Forcein in Potsdam.
What is the Percentage of People in the Labor Force in Potsdam?
47.9% of People are in the Labor Force in Potsdam.
What is the Unemployment Rate in Potsdam?
Unemployment Rate in Potsdam is 9.3%.