Glen Park, NY Map & Demographics
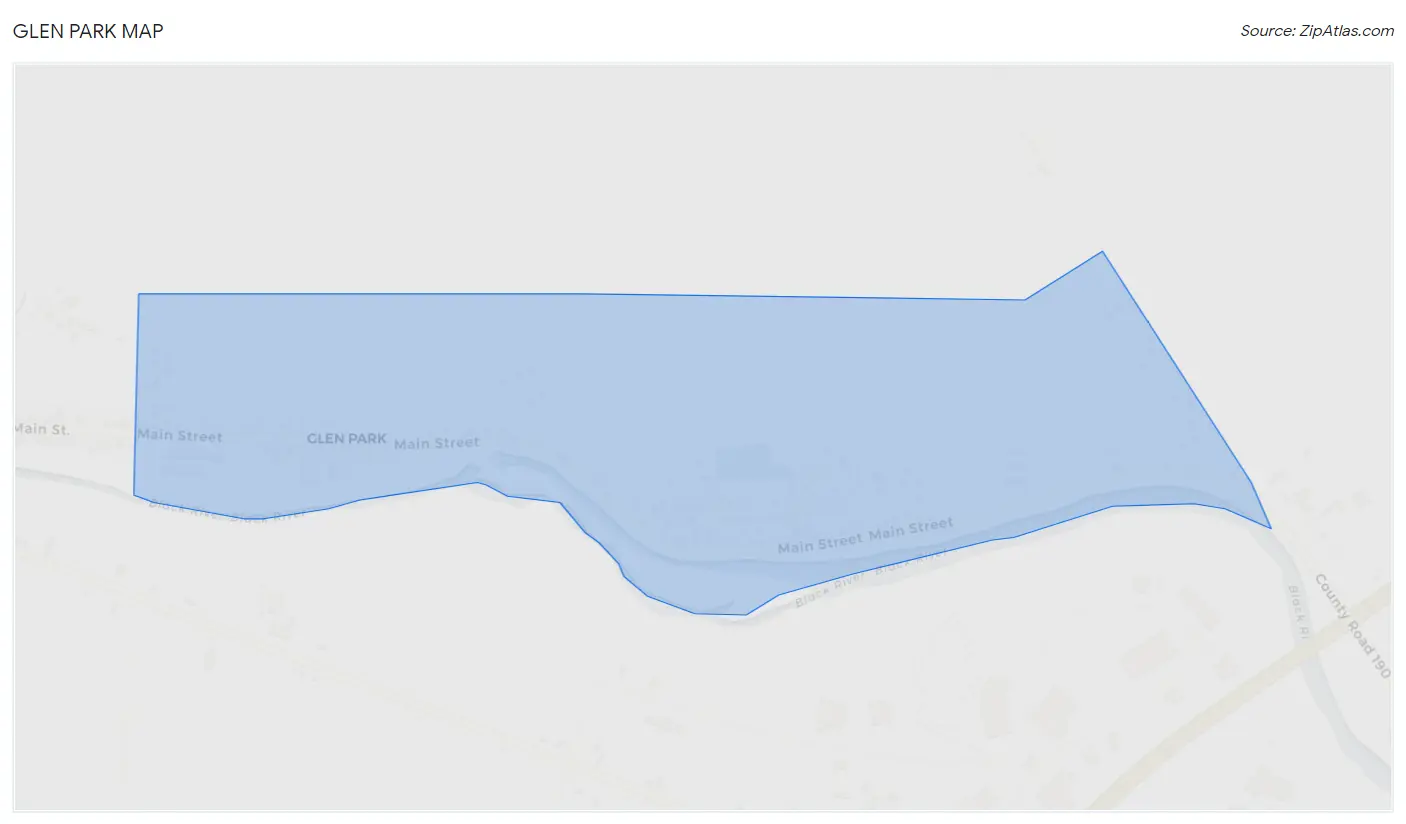
Glen Park Map
Glen Park Overview
$21,951
PER CAPITA INCOME
$35,000
AVG HOUSEHOLD INCOME
0.46
INEQUALITY / GINI INDEX
661
TOTAL POPULATION
349
MALE POPULATION
312
FEMALE POPULATION
111.86
MALES / 100 FEMALES
89.40
FEMALES / 100 MALES
28.4
MEDIAN AGE
3.1
AVG FAMILY SIZE
3.1
AVG HOUSEHOLD SIZE
321
LABOR FORCE [ PEOPLE ]
71.7%
PERCENT IN LABOR FORCE
4.4%
UNEMPLOYMENT RATE
Glen Park Area Codes
Income in Glen Park
Income Overview in Glen Park
| Characteristic | Number | Measure |
| Per Capita Income | 661 | $21,951 |
| Median Family Income | 171 | $0 |
| Mean Family Income | 171 | $57,388 |
| Median Household Income | 216 | $35,000 |
| Mean Household Income | 216 | $59,387 |
| Income Deficit | 171 | $0 |
| Wage / Income Gap (%) | 661 | 0.00% |
| Wage / Income Gap ($) | 661 | 100.00¢ per $1 |
| Gini / Inequality Index | 661 | 0.46 |
Earnings by Sex in Glen Park
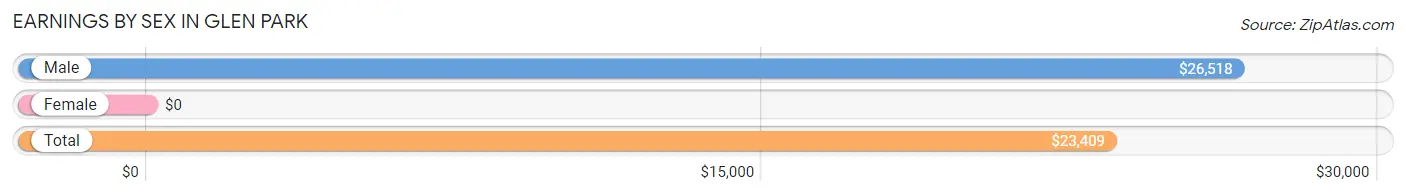
| Sex | Number | Average Earnings |
| Male | 171 (51.8%) | $26,518 |
| Female | 159 (48.2%) | $0 |
| Total | 330 (100.0%) | $23,409 |
Earnings by Sex by Income Bracket in Glen Park
The most common earnings brackets in Glen Park are $25,000 to $29,999 for men (47 | 27.5%) and $5,000 to $7,499 for women (67 | 42.1%).
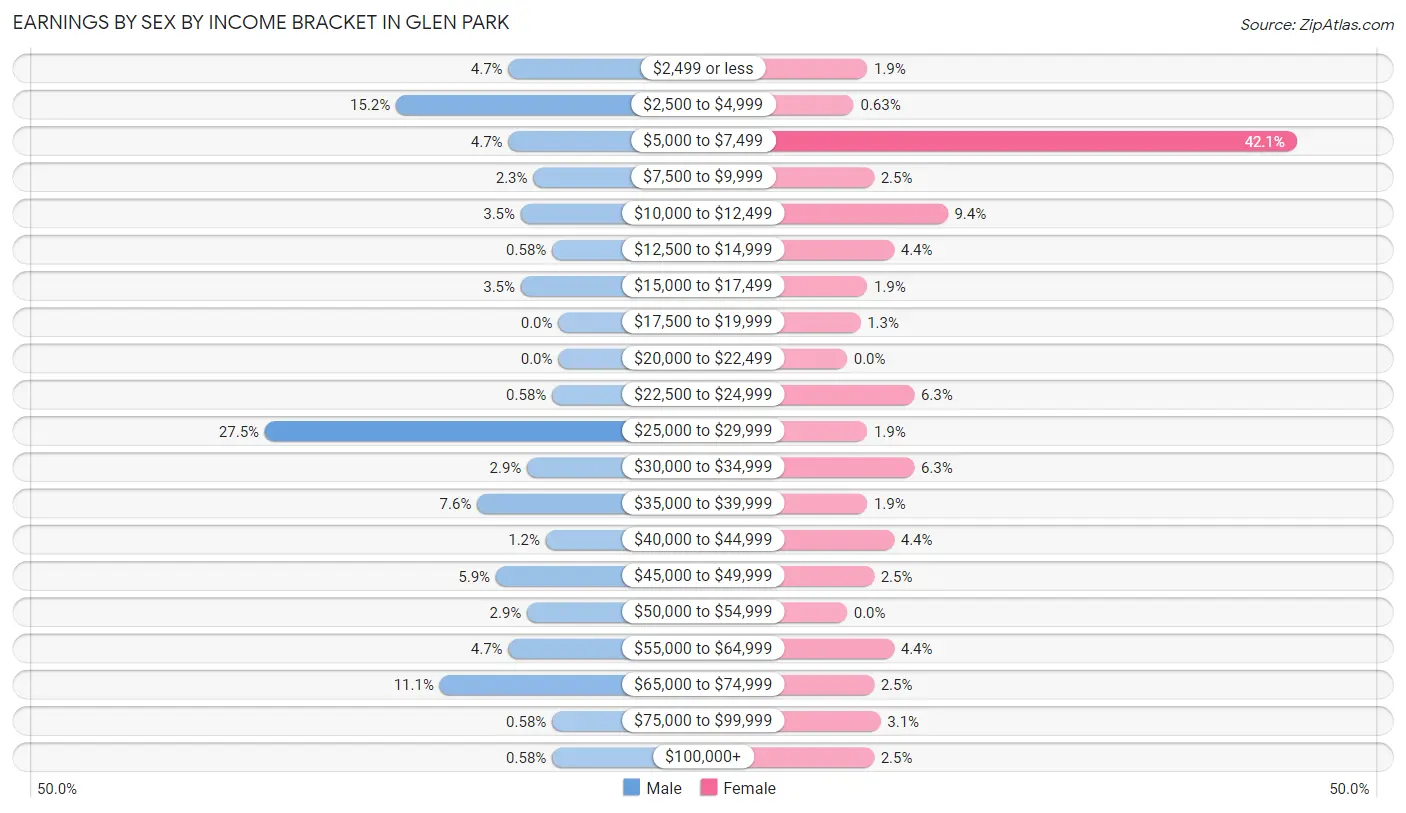
| Income | Male | Female |
| $2,499 or less | 8 (4.7%) | 3 (1.9%) |
| $2,500 to $4,999 | 26 (15.2%) | 1 (0.6%) |
| $5,000 to $7,499 | 8 (4.7%) | 67 (42.1%) |
| $7,500 to $9,999 | 4 (2.3%) | 4 (2.5%) |
| $10,000 to $12,499 | 6 (3.5%) | 15 (9.4%) |
| $12,500 to $14,999 | 1 (0.6%) | 7 (4.4%) |
| $15,000 to $17,499 | 6 (3.5%) | 3 (1.9%) |
| $17,500 to $19,999 | 0 (0.0%) | 2 (1.3%) |
| $20,000 to $22,499 | 0 (0.0%) | 0 (0.0%) |
| $22,500 to $24,999 | 1 (0.6%) | 10 (6.3%) |
| $25,000 to $29,999 | 47 (27.5%) | 3 (1.9%) |
| $30,000 to $34,999 | 5 (2.9%) | 10 (6.3%) |
| $35,000 to $39,999 | 13 (7.6%) | 3 (1.9%) |
| $40,000 to $44,999 | 2 (1.2%) | 7 (4.4%) |
| $45,000 to $49,999 | 10 (5.9%) | 4 (2.5%) |
| $50,000 to $54,999 | 5 (2.9%) | 0 (0.0%) |
| $55,000 to $64,999 | 8 (4.7%) | 7 (4.4%) |
| $65,000 to $74,999 | 19 (11.1%) | 4 (2.5%) |
| $75,000 to $99,999 | 1 (0.6%) | 5 (3.1%) |
| $100,000+ | 1 (0.6%) | 4 (2.5%) |
| Total | 171 (100.0%) | 159 (100.0%) |
Earnings by Sex by Educational Attainment in Glen Park
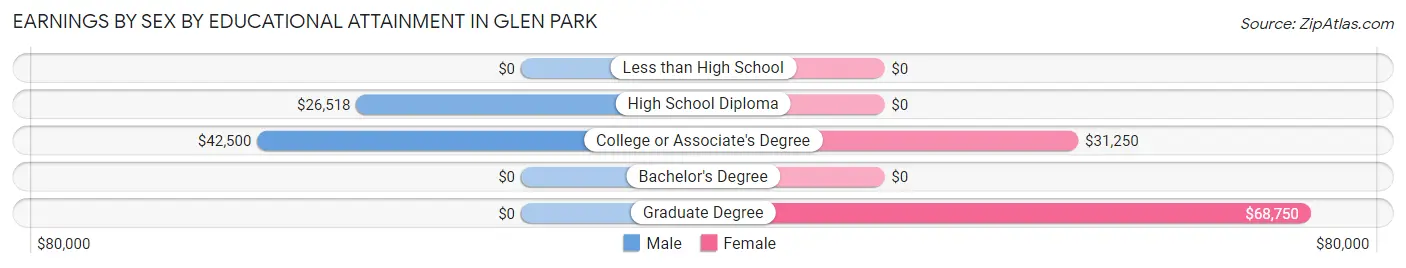
| Educational Attainment | Male Income | Female Income |
| Less than High School | - | - |
| High School Diploma | $26,518 | $0 |
| College or Associate's Degree | $42,500 | $31,250 |
| Bachelor's Degree | - | - |
| Graduate Degree | - | - |
| Total | $27,232 | $0 |
Family Income in Glen Park
Family Income Brackets in Glen Park
According to the Glen Park family income data, there are 48 families falling into the $25,000 to $34,999 income range, which is the most common income bracket and makes up 28.1% of all families.
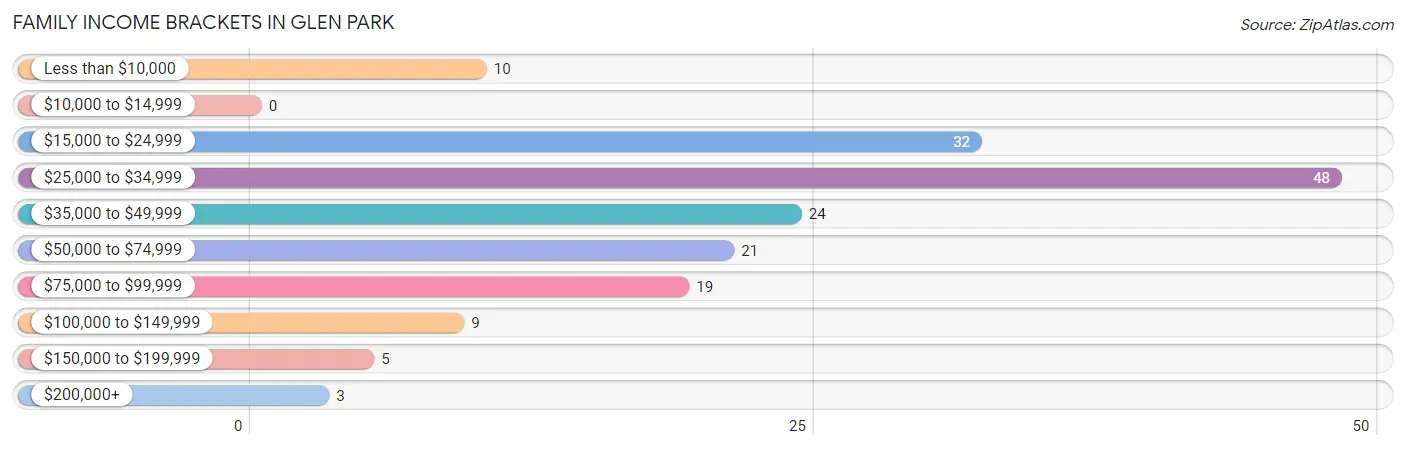
| Income Bracket | # Families | % Families |
| Less than $10,000 | 10 | 5.8% |
| $10,000 to $14,999 | 0 | 0.0% |
| $15,000 to $24,999 | 32 | 18.7% |
| $25,000 to $34,999 | 48 | 28.1% |
| $35,000 to $49,999 | 24 | 14.0% |
| $50,000 to $74,999 | 21 | 12.3% |
| $75,000 to $99,999 | 19 | 11.1% |
| $100,000 to $149,999 | 9 | 5.3% |
| $150,000 to $199,999 | 5 | 2.9% |
| $200,000+ | 3 | 1.8% |
Family Income by Famaliy Size in Glen Park
3-person families (26 | 15.2%) account for the highest median family income in Glen Park with $56,500 per family, while 3-person families (26 | 15.2%) have the highest median income of $18,833 per family member.
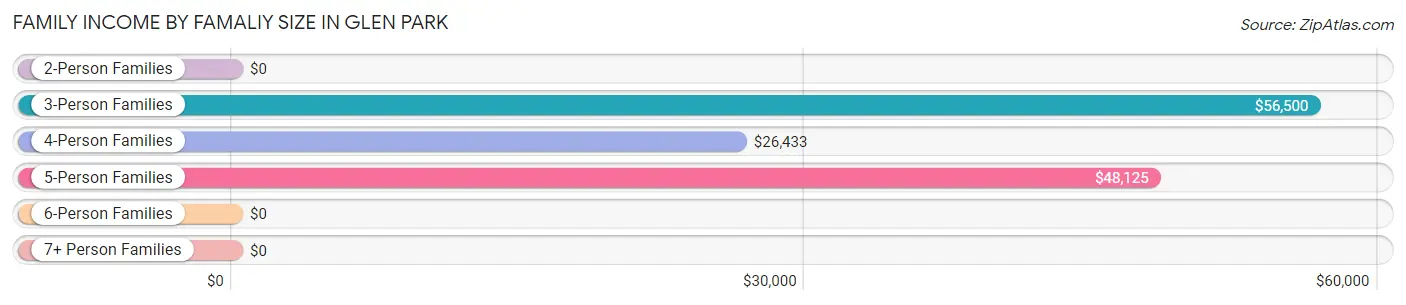
| Income Bracket | # Families | Median Income |
| 2-Person Families | 65 (38.0%) | $0 |
| 3-Person Families | 26 (15.2%) | $56,500 |
| 4-Person Families | 61 (35.7%) | $26,433 |
| 5-Person Families | 15 (8.8%) | $48,125 |
| 6-Person Families | 4 (2.3%) | $0 |
| 7+ Person Families | 0 (0.0%) | $0 |
| Total | 171 (100.0%) | $0 |
Family Income by Number of Earners in Glen Park
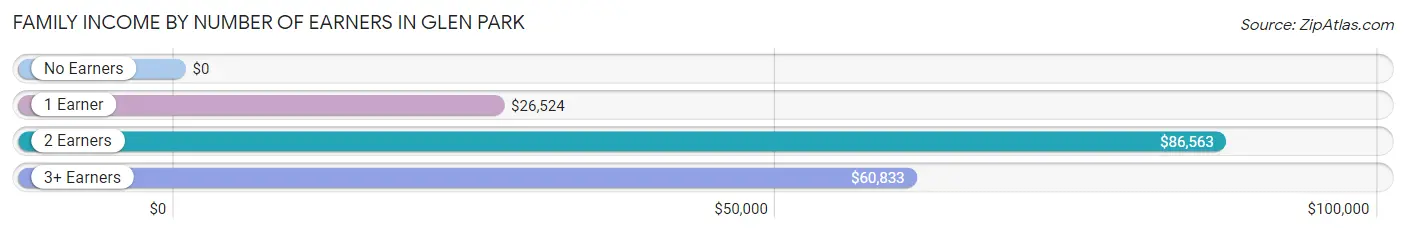
| Number of Earners | # Families | Median Income |
| No Earners | 8 (4.7%) | $0 |
| 1 Earner | 120 (70.2%) | $26,524 |
| 2 Earners | 29 (17.0%) | $86,563 |
| 3+ Earners | 14 (8.2%) | $60,833 |
| Total | 171 (100.0%) | $0 |
Household Income in Glen Park
Household Income Brackets in Glen Park
With 60 households falling in the category, the $25,000 to $34,999 income range is the most frequent in Glen Park, accounting for 27.8% of all households. In contrast, only 2 households (0.9%) fall into the $10,000 to $14,999 income bracket, making it the least populous group.
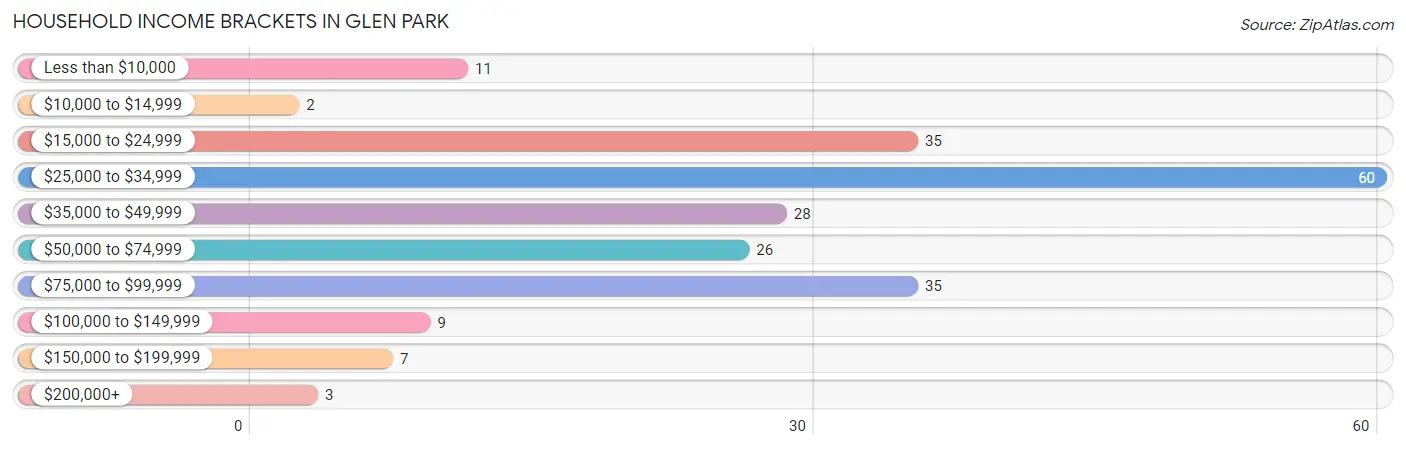
| Income Bracket | # Households | % Households |
| Less than $10,000 | 11 | 5.1% |
| $10,000 to $14,999 | 2 | 0.9% |
| $15,000 to $24,999 | 35 | 16.2% |
| $25,000 to $34,999 | 60 | 27.8% |
| $35,000 to $49,999 | 28 | 13.0% |
| $50,000 to $74,999 | 26 | 12.0% |
| $75,000 to $99,999 | 35 | 16.2% |
| $100,000 to $149,999 | 9 | 4.2% |
| $150,000 to $199,999 | 7 | 3.2% |
| $200,000+ | 3 | 1.4% |
Household Income by Householder Age in Glen Park
The median household income in Glen Park is $35,000, with the highest median household income of $75,417 found in the 45 to 64 years age bracket for the primary householder. A total of 49 households (22.7%) fall into this category. Meanwhile, the 15 to 24 years age bracket for the primary householder has the lowest median household income of $0, with 13 households (6.0%) in this group.
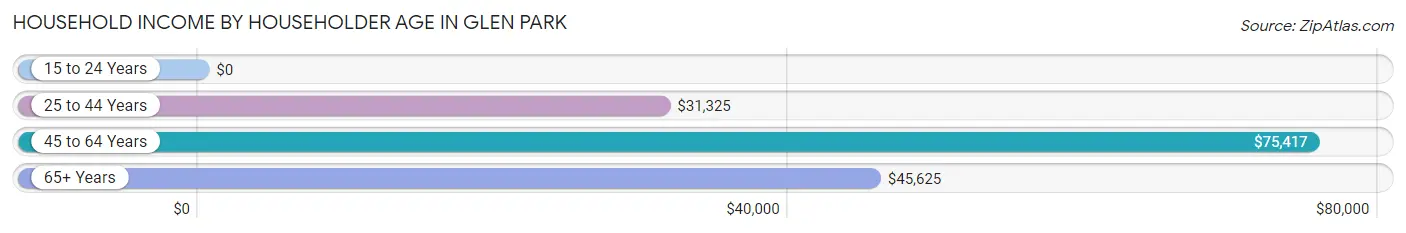
| Income Bracket | # Households | Median Income |
| 15 to 24 Years | 13 (6.0%) | $0 |
| 25 to 44 Years | 121 (56.0%) | $31,325 |
| 45 to 64 Years | 49 (22.7%) | $75,417 |
| 65+ Years | 33 (15.3%) | $45,625 |
| Total | 216 (100.0%) | $35,000 |
Poverty in Glen Park
Income Below Poverty by Sex and Age in Glen Park
With 45.9% poverty level for males and 34.9% for females among the residents of Glen Park, 15 year old males and 25 to 34 year old females are the most vulnerable to poverty, with 3 males (100.0%) and 84 females (84.9%) in their respective age groups living below the poverty level.
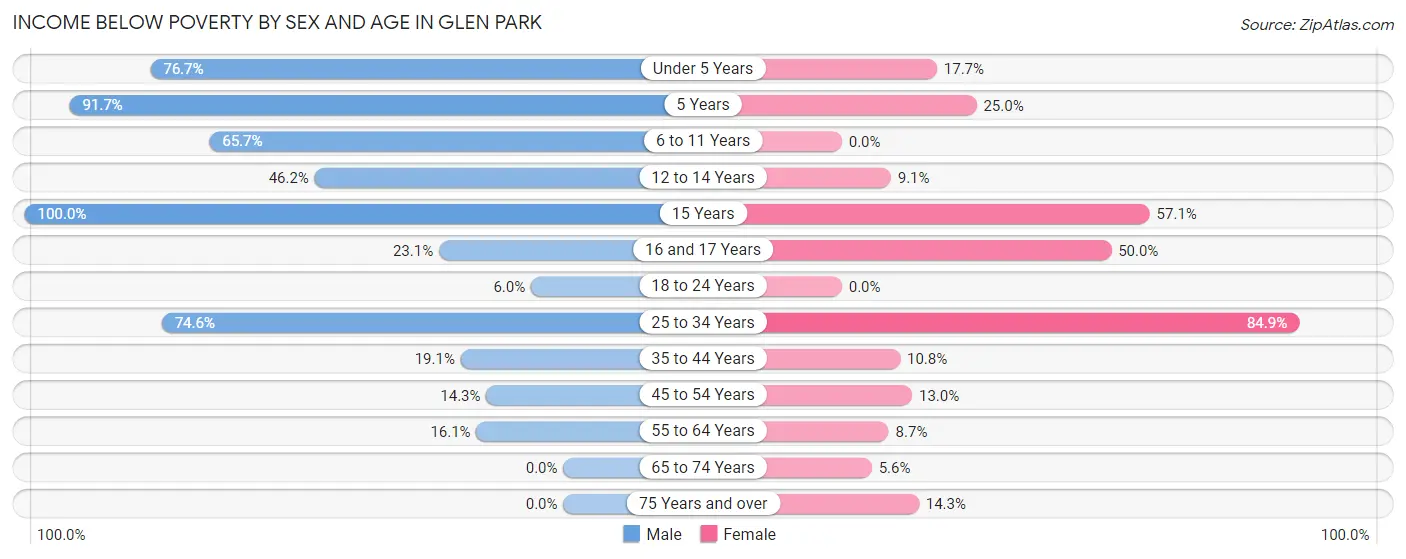
| Age Bracket | Male | Female |
| Under 5 Years | 46 (76.7%) | 3 (17.6%) |
| 5 Years | 22 (91.7%) | 2 (25.0%) |
| 6 to 11 Years | 23 (65.7%) | 0 (0.0%) |
| 12 to 14 Years | 6 (46.2%) | 2 (9.1%) |
| 15 Years | 3 (100.0%) | 4 (57.1%) |
| 16 and 17 Years | 3 (23.1%) | 2 (50.0%) |
| 18 to 24 Years | 3 (6.0%) | 0 (0.0%) |
| 25 to 34 Years | 41 (74.6%) | 84 (84.9%) |
| 35 to 44 Years | 4 (19.1%) | 4 (10.8%) |
| 45 to 54 Years | 4 (14.3%) | 3 (13.0%) |
| 55 to 64 Years | 5 (16.1%) | 2 (8.7%) |
| 65 to 74 Years | 0 (0.0%) | 1 (5.6%) |
| 75 Years and over | 0 (0.0%) | 2 (14.3%) |
| Total | 160 (45.9%) | 109 (34.9%) |
Income Above Poverty by Sex and Age in Glen Park
According to the poverty statistics in Glen Park, males aged 65 to 74 years and females aged 6 to 11 years are the age groups that are most secure financially, with 100.0% of males and 100.0% of females in these age groups living above the poverty line.
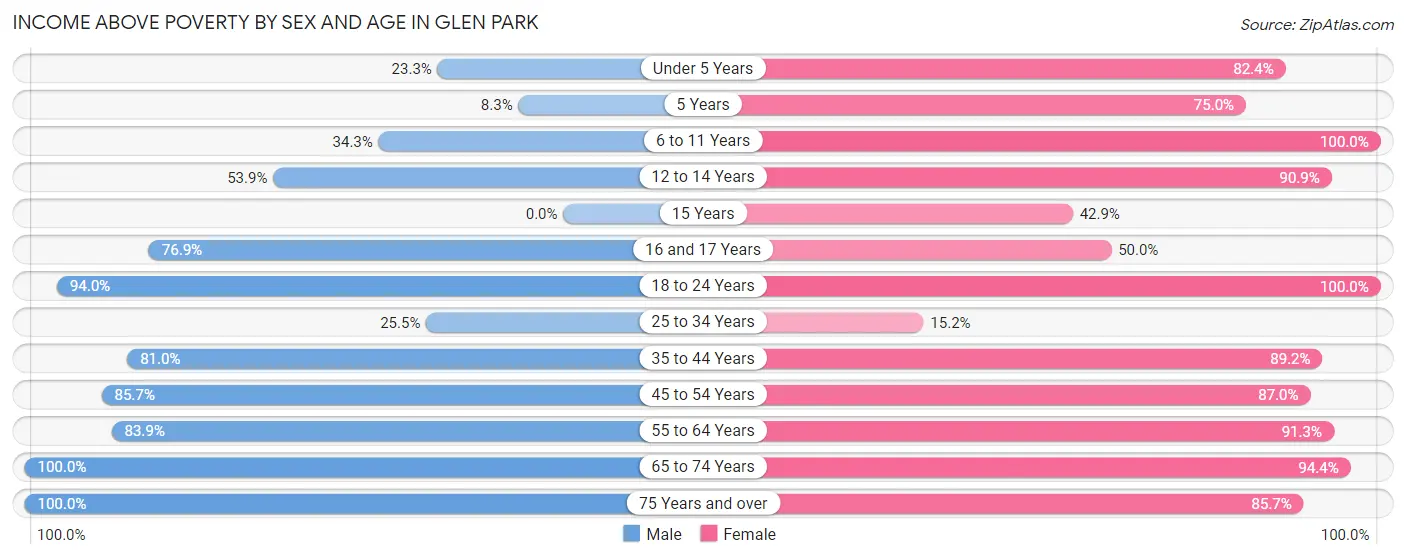
| Age Bracket | Male | Female |
| Under 5 Years | 14 (23.3%) | 14 (82.4%) |
| 5 Years | 2 (8.3%) | 6 (75.0%) |
| 6 to 11 Years | 12 (34.3%) | 24 (100.0%) |
| 12 to 14 Years | 7 (53.8%) | 20 (90.9%) |
| 15 Years | 0 (0.0%) | 3 (42.9%) |
| 16 and 17 Years | 10 (76.9%) | 2 (50.0%) |
| 18 to 24 Years | 47 (94.0%) | 16 (100.0%) |
| 25 to 34 Years | 14 (25.5%) | 15 (15.1%) |
| 35 to 44 Years | 17 (80.9%) | 33 (89.2%) |
| 45 to 54 Years | 24 (85.7%) | 20 (87.0%) |
| 55 to 64 Years | 26 (83.9%) | 21 (91.3%) |
| 65 to 74 Years | 15 (100.0%) | 17 (94.4%) |
| 75 Years and over | 1 (100.0%) | 12 (85.7%) |
| Total | 189 (54.1%) | 203 (65.1%) |
Income Below Poverty Among Married-Couple Families in Glen Park
The poverty statistics for married-couple families in Glen Park show that 4.5% or 3 of the total 67 families live below the poverty line. Families with 3 or 4 children have the highest poverty rate of 25.0%, comprising of 2 families. On the other hand, families with 1 or 2 children have the lowest poverty rate of 0.0%, which includes 0 families.
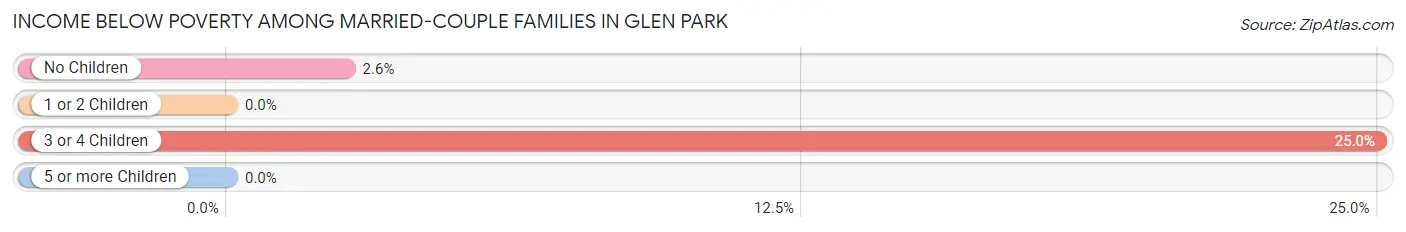
| Children | Above Poverty | Below Poverty |
| No Children | 38 (97.4%) | 1 (2.6%) |
| 1 or 2 Children | 20 (100.0%) | 0 (0.0%) |
| 3 or 4 Children | 6 (75.0%) | 2 (25.0%) |
| 5 or more Children | 0 (0.0%) | 0 (0.0%) |
| Total | 64 (95.5%) | 3 (4.5%) |
Income Below Poverty Among Single-Parent Households in Glen Park
According to the poverty data in Glen Park, 83.3% or 45 single-father households and 68.0% or 34 single-mother households are living below the poverty line. Among single-father households, those with 3 or 4 children have the highest poverty rate, with 45 households (100.0%) experiencing poverty. Likewise, among single-mother households, those with 3 or 4 children have the highest poverty rate, with 3 households (100.0%) falling below the poverty line.
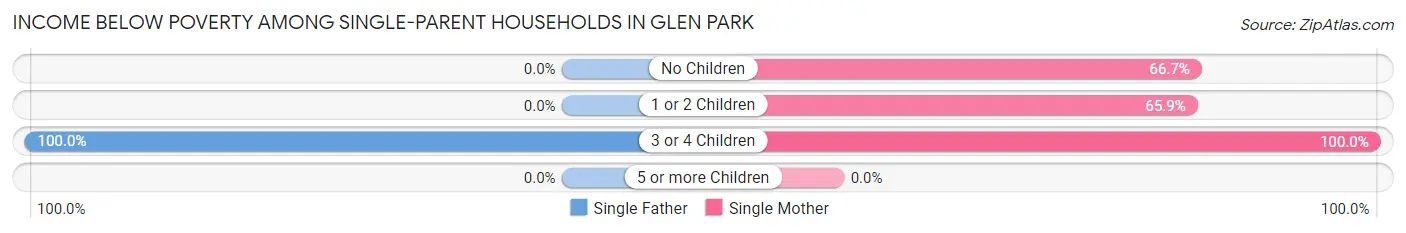
| Children | Single Father | Single Mother |
| No Children | 0 (0.0%) | 2 (66.7%) |
| 1 or 2 Children | 0 (0.0%) | 29 (65.9%) |
| 3 or 4 Children | 45 (100.0%) | 3 (100.0%) |
| 5 or more Children | 0 (0.0%) | 0 (0.0%) |
| Total | 45 (83.3%) | 34 (68.0%) |
Income Below Poverty Among Married-Couple vs Single-Parent Households in Glen Park
The poverty data for Glen Park shows that 3 of the married-couple family households (4.5%) and 79 of the single-parent households (76.0%) are living below the poverty level. Within the married-couple family households, those with 3 or 4 children have the highest poverty rate, with 2 households (25.0%) falling below the poverty line. Among the single-parent households, those with 3 or 4 children have the highest poverty rate, with 48 household (100.0%) living below poverty.
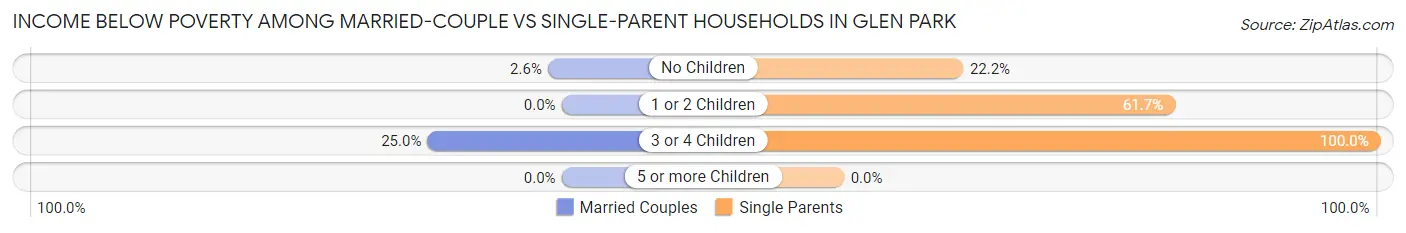
| Children | Married-Couple Families | Single-Parent Households |
| No Children | 1 (2.6%) | 2 (22.2%) |
| 1 or 2 Children | 0 (0.0%) | 29 (61.7%) |
| 3 or 4 Children | 2 (25.0%) | 48 (100.0%) |
| 5 or more Children | 0 (0.0%) | 0 (0.0%) |
| Total | 3 (4.5%) | 79 (76.0%) |
Race in Glen Park
The most populous races in Glen Park are White / Caucasian (571 | 86.4%), Two or more Races (49 | 7.4%), and Asian (31 | 4.7%).
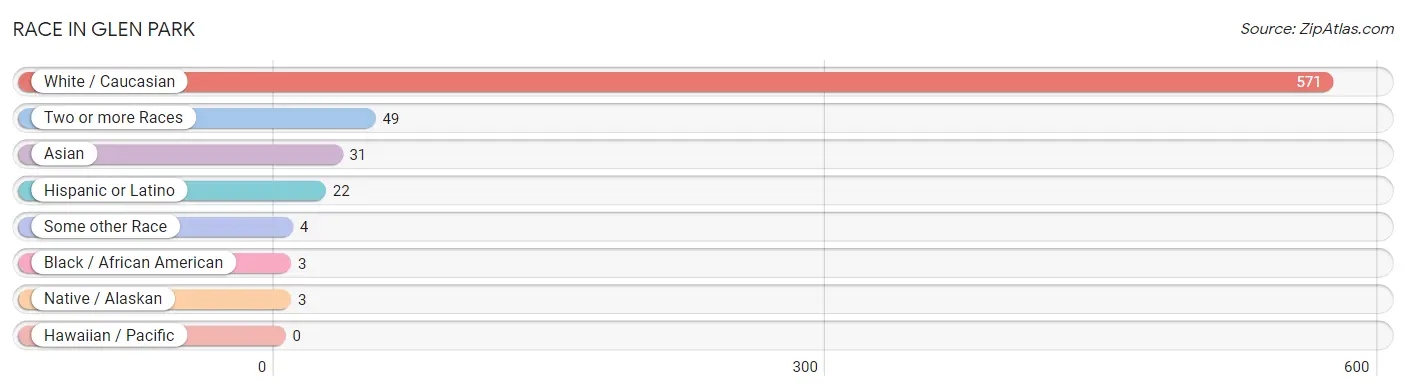
| Race | # Population | % Population |
| Asian | 31 | 4.7% |
| Black / African American | 3 | 0.4% |
| Hawaiian / Pacific | 0 | 0.0% |
| Hispanic or Latino | 22 | 3.3% |
| Native / Alaskan | 3 | 0.4% |
| White / Caucasian | 571 | 86.4% |
| Two or more Races | 49 | 7.4% |
| Some other Race | 4 | 0.6% |
| Total | 661 | 100.0% |
Ancestry in Glen Park
The most populous ancestries reported in Glen Park are Irish (171 | 25.9%), Italian (124 | 18.8%), German (98 | 14.8%), English (67 | 10.1%), and French (44 | 6.7%), together accounting for 76.3% of all Glen Park residents.
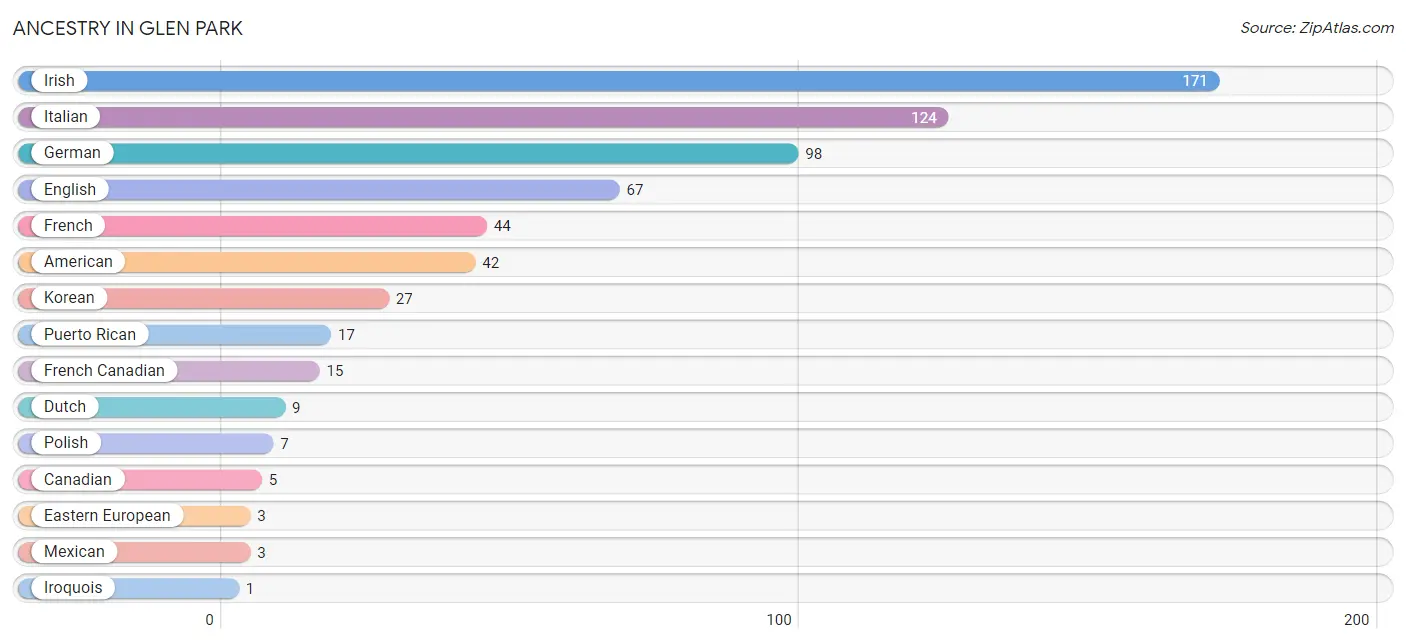
| Ancestry | # Population | % Population |
| American | 42 | 6.4% |
| Canadian | 5 | 0.8% |
| Dutch | 9 | 1.4% |
| Eastern European | 3 | 0.4% |
| English | 67 | 10.1% |
| French | 44 | 6.7% |
| French Canadian | 15 | 2.3% |
| German | 98 | 14.8% |
| Irish | 171 | 25.9% |
| Iroquois | 1 | 0.2% |
| Italian | 124 | 18.8% |
| Korean | 27 | 4.1% |
| Mexican | 3 | 0.4% |
| Polish | 7 | 1.1% |
| Portuguese | 1 | 0.2% |
| Puerto Rican | 17 | 2.6% |
| Scandinavian | 1 | 0.2% |
| Scottish | 1 | 0.2% |
| Welsh | 1 | 0.2% | View All 19 Rows |
Immigrants in Glen Park
The most numerous immigrant groups reported in Glen Park came from Asia (16 | 2.4%), Philippines (16 | 2.4%), South Eastern Asia (16 | 2.4%), Canada (2 | 0.3%), and Central America (1 | 0.2%), together accounting for 7.7% of all Glen Park residents.
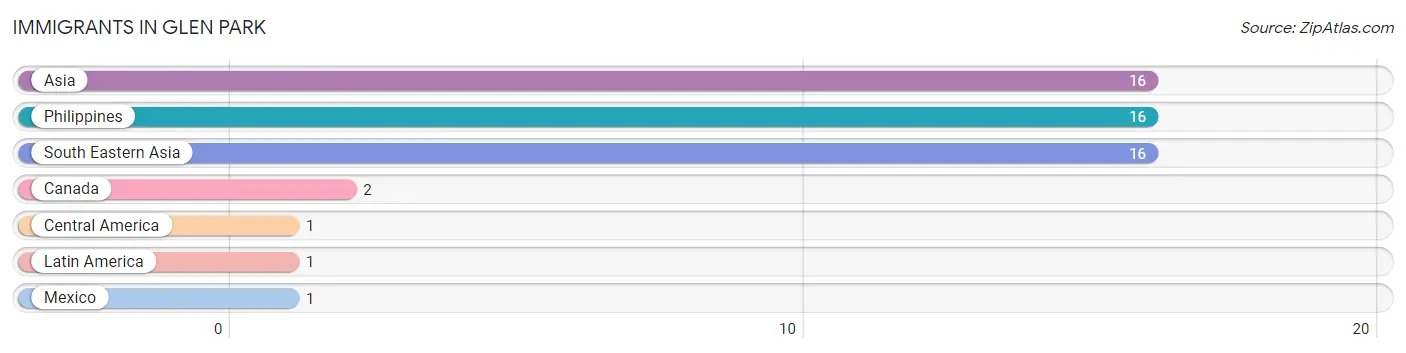
| Immigration Origin | # Population | % Population |
| Asia | 16 | 2.4% |
| Canada | 2 | 0.3% |
| Central America | 1 | 0.2% |
| Latin America | 1 | 0.2% |
| Mexico | 1 | 0.2% |
| Philippines | 16 | 2.4% |
| South Eastern Asia | 16 | 2.4% | View All 7 Rows |
Sex and Age in Glen Park
Sex and Age in Glen Park
The most populous age groups in Glen Park are Under 5 Years (60 | 17.2%) for men and 30 to 34 Years (62 | 19.9%) for women.
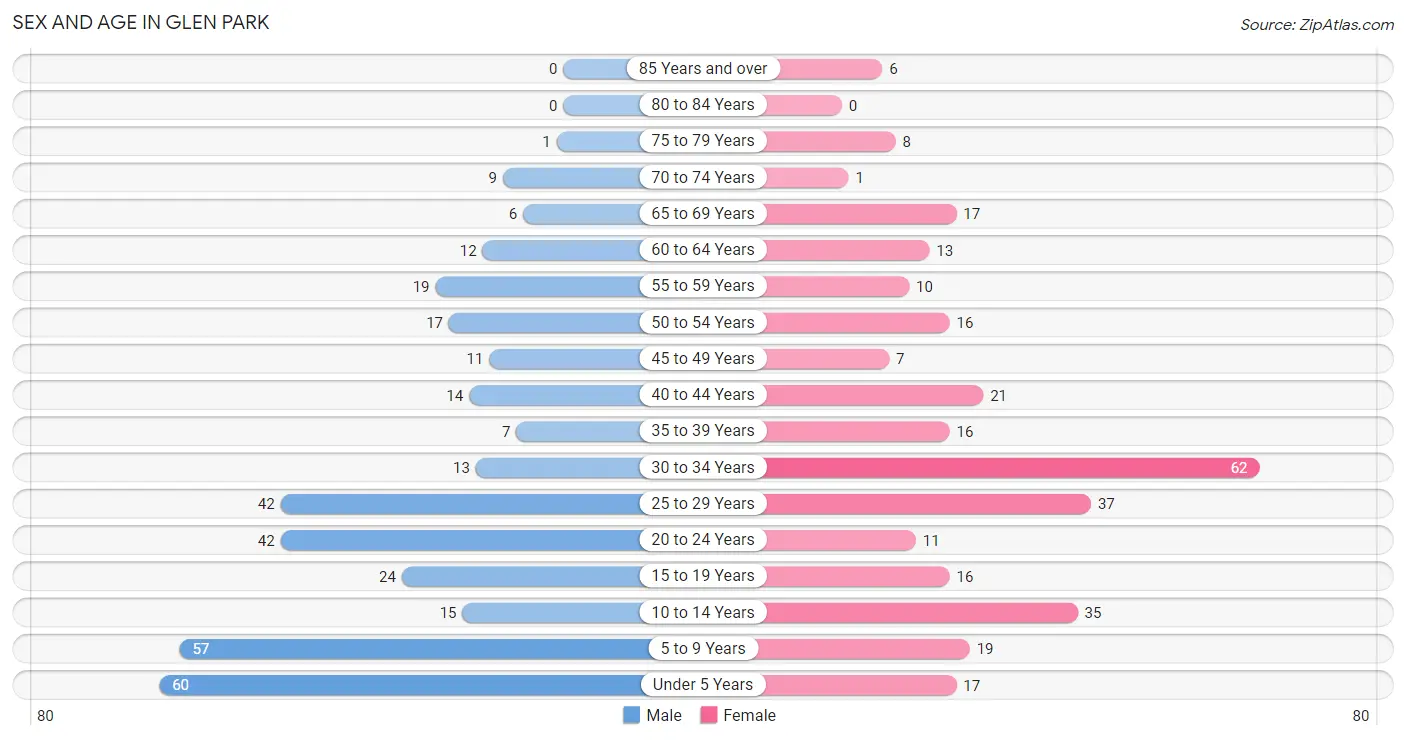
| Age Bracket | Male | Female |
| Under 5 Years | 60 (17.2%) | 17 (5.4%) |
| 5 to 9 Years | 57 (16.3%) | 19 (6.1%) |
| 10 to 14 Years | 15 (4.3%) | 35 (11.2%) |
| 15 to 19 Years | 24 (6.9%) | 16 (5.1%) |
| 20 to 24 Years | 42 (12.0%) | 11 (3.5%) |
| 25 to 29 Years | 42 (12.0%) | 37 (11.9%) |
| 30 to 34 Years | 13 (3.7%) | 62 (19.9%) |
| 35 to 39 Years | 7 (2.0%) | 16 (5.1%) |
| 40 to 44 Years | 14 (4.0%) | 21 (6.7%) |
| 45 to 49 Years | 11 (3.2%) | 7 (2.2%) |
| 50 to 54 Years | 17 (4.9%) | 16 (5.1%) |
| 55 to 59 Years | 19 (5.4%) | 10 (3.2%) |
| 60 to 64 Years | 12 (3.4%) | 13 (4.2%) |
| 65 to 69 Years | 6 (1.7%) | 17 (5.4%) |
| 70 to 74 Years | 9 (2.6%) | 1 (0.3%) |
| 75 to 79 Years | 1 (0.3%) | 8 (2.6%) |
| 80 to 84 Years | 0 (0.0%) | 0 (0.0%) |
| 85 Years and over | 0 (0.0%) | 6 (1.9%) |
| Total | 349 (100.0%) | 312 (100.0%) |
Families and Households in Glen Park
Median Family Size in Glen Park
The median family size in Glen Park is 3.10 persons per family, with married-couple families (67 | 39.2%) accounting for the largest median family size of 3.78 persons per family. On the other hand, single female/mother families (50 | 29.2%) represent the smallest median family size with 2.52 persons per family.
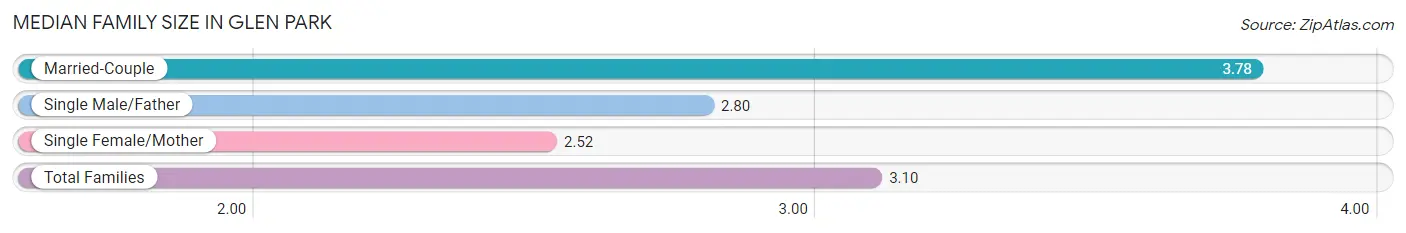
| Family Type | # Families | Family Size |
| Married-Couple | 67 (39.2%) | 3.78 |
| Single Male/Father | 54 (31.6%) | 2.80 |
| Single Female/Mother | 50 (29.2%) | 2.52 |
| Total Families | 171 (100.0%) | 3.10 |
Median Household Size in Glen Park
The median household size in Glen Park is 3.06 persons per household, with married-couple households (67 | 31.0%) accounting for the largest median household size of 3.85 persons per household. non-family households (45 | 20.8%) represent the smallest median household size with 1.36 persons per household.
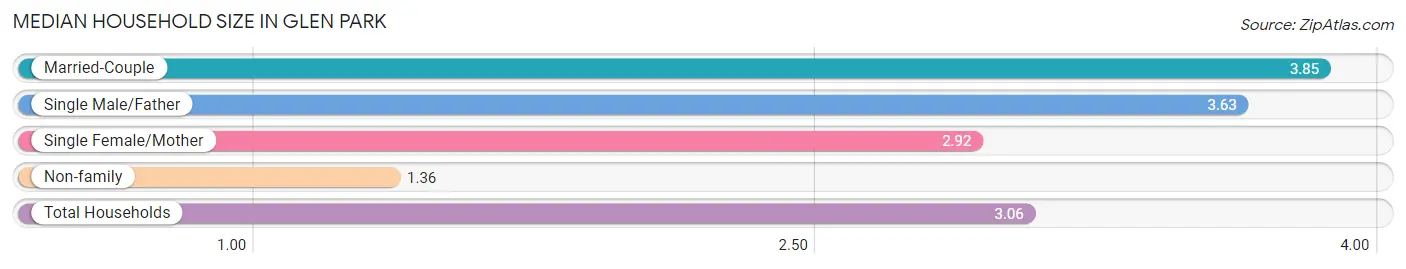
| Household Type | # Households | Household Size |
| Married-Couple | 67 (31.0%) | 3.85 |
| Single Male/Father | 54 (25.0%) | 3.63 |
| Single Female/Mother | 50 (23.2%) | 2.92 |
| Non-family | 45 (20.8%) | 1.36 |
| Total Households | 216 (100.0%) | 3.06 |
Household Size by Marriage Status in Glen Park
Out of a total of 216 households in Glen Park, 171 (79.2%) are family households, while 45 (20.8%) are nonfamily households. The most numerous type of family households are 5-person households, comprising 57, and the most common type of nonfamily households are 1-person households, comprising 30.
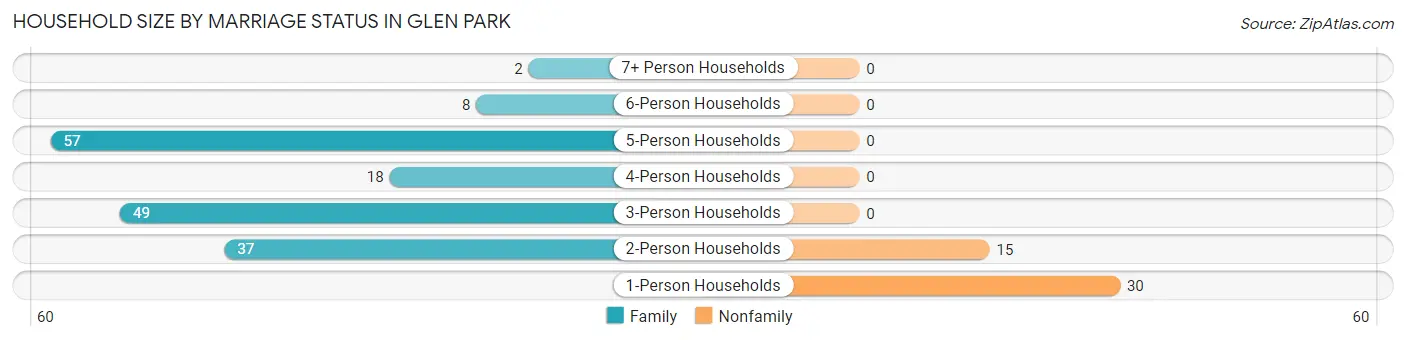
| Household Size | Family Households | Nonfamily Households |
| 1-Person Households | - | 30 (13.9%) |
| 2-Person Households | 37 (17.1%) | 15 (6.9%) |
| 3-Person Households | 49 (22.7%) | 0 (0.0%) |
| 4-Person Households | 18 (8.3%) | 0 (0.0%) |
| 5-Person Households | 57 (26.4%) | 0 (0.0%) |
| 6-Person Households | 8 (3.7%) | 0 (0.0%) |
| 7+ Person Households | 2 (0.9%) | 0 (0.0%) |
| Total | 171 (79.2%) | 45 (20.8%) |
Female Fertility in Glen Park
Fertility by Age in Glen Park
Average fertility rate in Glen Park is 231.0 births per 1,000 women. Women in the age bracket of 20 to 34 years have the highest fertility rate with 345.0 births per 1,000 women. Women in the age bracket of 20 to 34 years acount for 95.0% of all women with births.
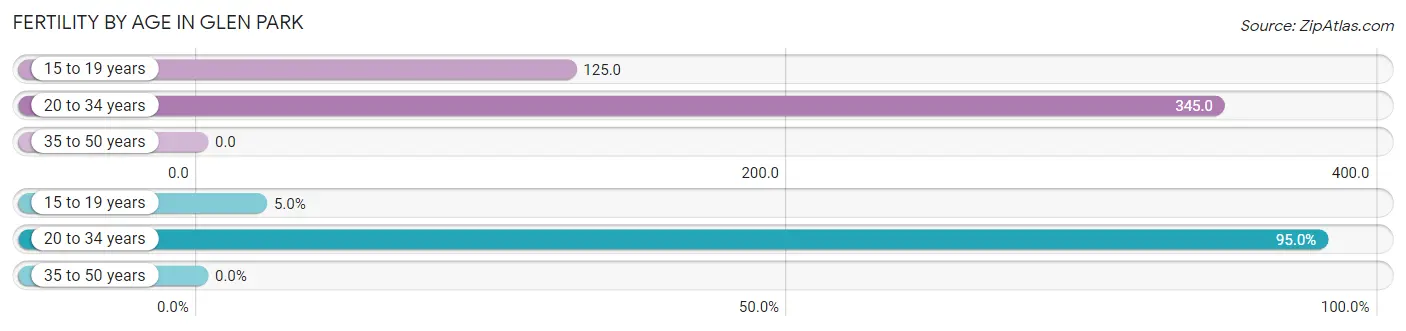
| Age Bracket | Women with Births | Births / 1,000 Women |
| 15 to 19 years | 2 (5.0%) | 125.0 |
| 20 to 34 years | 38 (95.0%) | 345.0 |
| 35 to 50 years | 0 (0.0%) | 0.0 |
| Total | 40 (100.0%) | 231.0 |
Fertility by Age by Marriage Status in Glen Park
85.0% of women with births (40) in Glen Park are married. The highest percentage of unmarried women with births falls into 15 to 19 years age bracket with 100.0% of them unmarried at the time of birth, while the lowest percentage of unmarried women with births belong to 20 to 34 years age bracket with 10.5% of them unmarried.
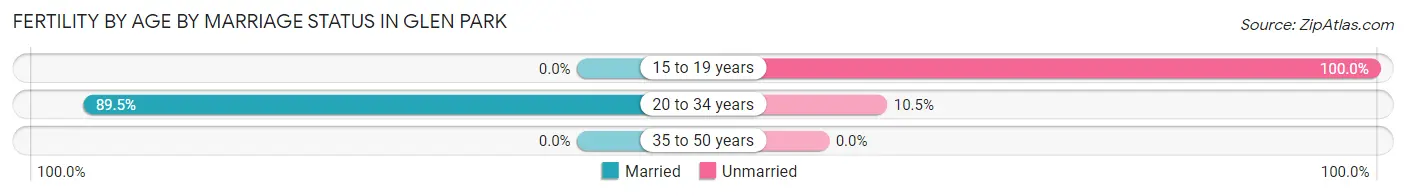
| Age Bracket | Married | Unmarried |
| 15 to 19 years | 0 (0.0%) | 2 (100.0%) |
| 20 to 34 years | 34 (89.5%) | 4 (10.5%) |
| 35 to 50 years | 0 (0.0%) | 0 (0.0%) |
| Total | 34 (85.0%) | 6 (15.0%) |
Fertility by Education in Glen Park
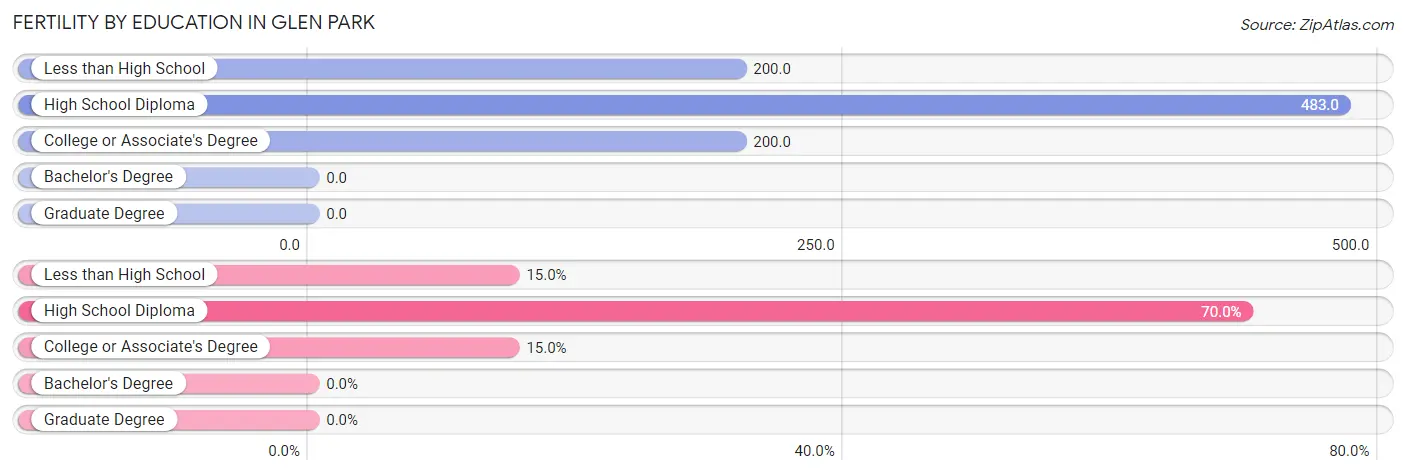
| Educational Attainment | Women with Births | Births / 1,000 Women |
| Less than High School | 6 (15.0%) | 200.0 |
| High School Diploma | 28 (70.0%) | 483.0 |
| College or Associate's Degree | 6 (15.0%) | 200.0 |
| Bachelor's Degree | 0 (0.0%) | 0.0 |
| Graduate Degree | 0 (0.0%) | 0.0 |
| Total | 40 (100.0%) | 231.0 |
Fertility by Education by Marriage Status in Glen Park
15.0% of women with births in Glen Park are unmarried. Women with the educational attainment of high school diploma are most likely to be married with 100.0% of them married at childbirth, while women with the educational attainment of less than high school are least likely to be married with 100.0% of them unmarried at childbirth.
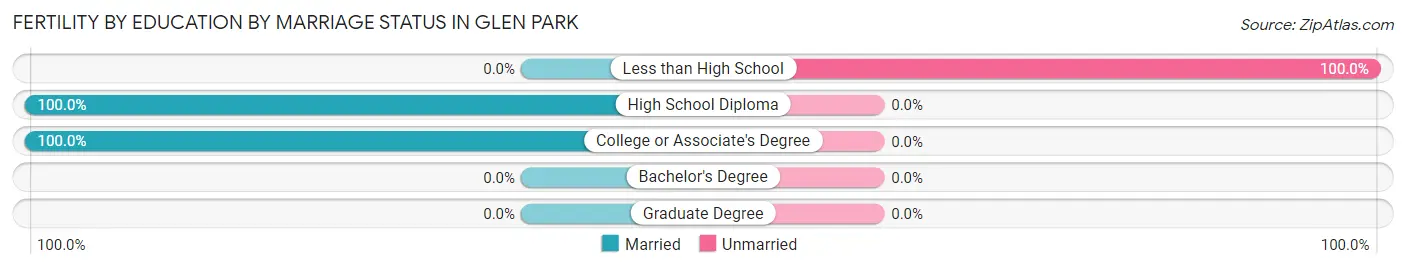
| Educational Attainment | Married | Unmarried |
| Less than High School | 0 (0.0%) | 6 (100.0%) |
| High School Diploma | 28 (100.0%) | 0 (0.0%) |
| College or Associate's Degree | 6 (100.0%) | 0 (0.0%) |
| Bachelor's Degree | 0 (0.0%) | 0 (0.0%) |
| Graduate Degree | 0 (0.0%) | 0 (0.0%) |
| Total | 34 (85.0%) | 6 (15.0%) |
Employment Characteristics in Glen Park
Employment by Class of Employer in Glen Park
Among the 303 employed individuals in Glen Park, private company employees (213 | 70.3%), self-employed (incorporated) (30 | 9.9%), and not-for-profit organizations (30 | 9.9%) make up the most common classes of employment.
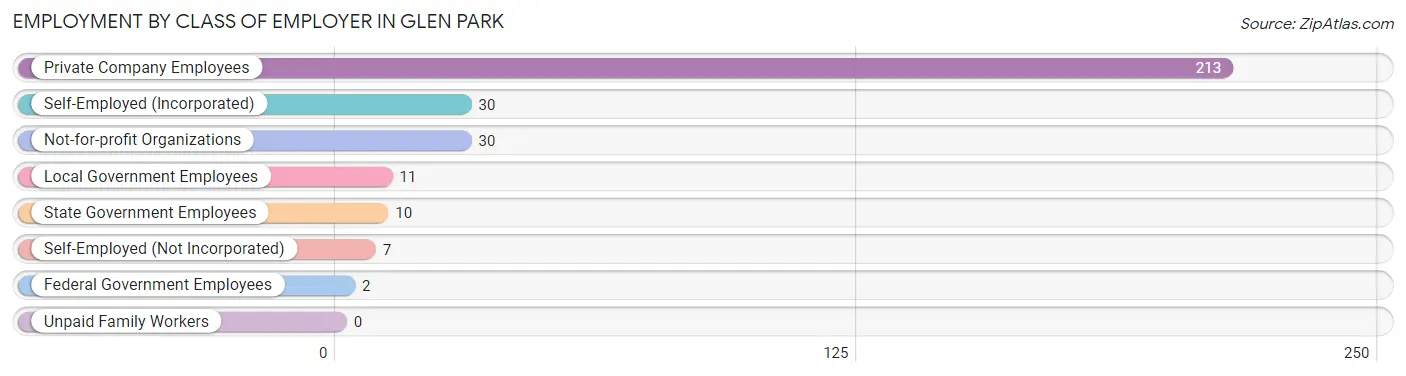
| Employer Class | # Employees | % Employees |
| Private Company Employees | 213 | 70.3% |
| Self-Employed (Incorporated) | 30 | 9.9% |
| Self-Employed (Not Incorporated) | 7 | 2.3% |
| Not-for-profit Organizations | 30 | 9.9% |
| Local Government Employees | 11 | 3.6% |
| State Government Employees | 10 | 3.3% |
| Federal Government Employees | 2 | 0.7% |
| Unpaid Family Workers | 0 | 0.0% |
| Total | 303 | 100.0% |
Employment Status by Age in Glen Park
According to the labor force statistics for Glen Park, out of the total population over 16 years of age (448), 71.7% or 321 individuals are in the labor force, with 4.4% or 14 of them unemployed. The age group with the highest labor force participation rate is 25 to 29 years, with 98.7% or 78 individuals in the labor force. Within the labor force, the 45 to 54 years age range has the highest percentage of unemployed individuals, with 12.5% or 4 of them being unemployed.
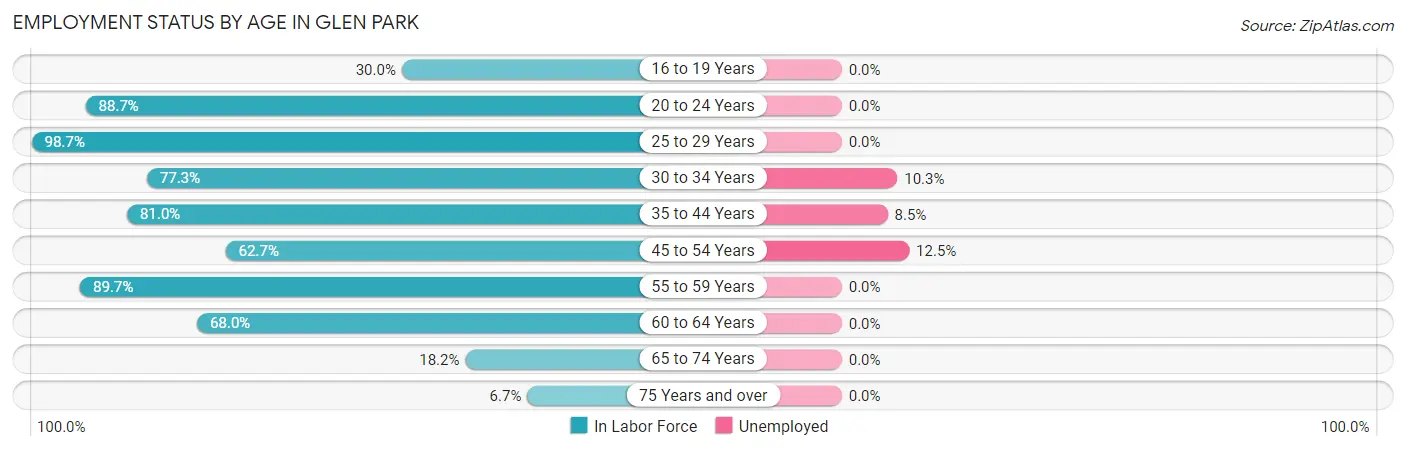
| Age Bracket | In Labor Force | Unemployed |
| 16 to 19 Years | 9 (30.0%) | 0 (0.0%) |
| 20 to 24 Years | 47 (88.7%) | 0 (0.0%) |
| 25 to 29 Years | 78 (98.7%) | 0 (0.0%) |
| 30 to 34 Years | 58 (77.3%) | 6 (10.3%) |
| 35 to 44 Years | 47 (81.0%) | 4 (8.5%) |
| 45 to 54 Years | 32 (62.7%) | 4 (12.5%) |
| 55 to 59 Years | 26 (89.7%) | 0 (0.0%) |
| 60 to 64 Years | 17 (68.0%) | 0 (0.0%) |
| 65 to 74 Years | 6 (18.2%) | 0 (0.0%) |
| 75 Years and over | 1 (6.7%) | 0 (0.0%) |
| Total | 321 (71.7%) | 14 (4.4%) |
Employment Status by Educational Attainment in Glen Park
According to labor force statistics for Glen Park, 81.4% of individuals (258) out of the total population between 25 and 64 years of age (317) are in the labor force, with 5.4% or 14 of them being unemployed. The group with the highest labor force participation rate are those with the educational attainment of bachelor's degree or higher, with 96.7% or 58 individuals in the labor force. Within the labor force, individuals with less than high school education have the highest percentage of unemployment, with 43.8% or 7 of them being unemployed.
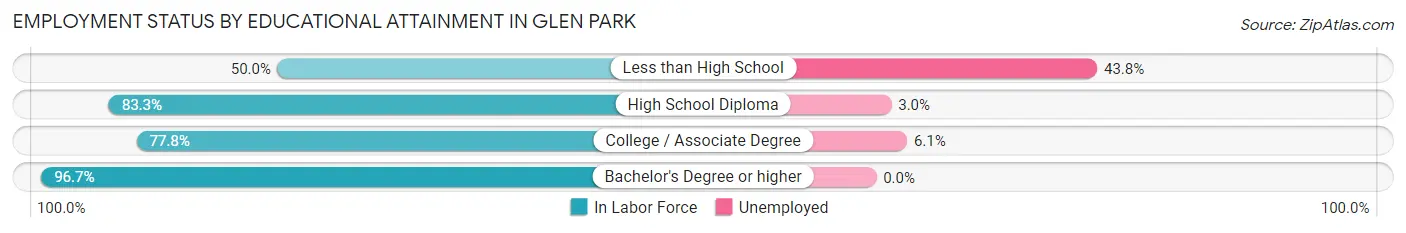
| Educational Attainment | In Labor Force | Unemployed |
| Less than High School | 16 (50.0%) | 14 (43.8%) |
| High School Diploma | 135 (83.3%) | 5 (3.0%) |
| College / Associate Degree | 49 (77.8%) | 4 (6.1%) |
| Bachelor's Degree or higher | 58 (96.7%) | 0 (0.0%) |
| Total | 258 (81.4%) | 17 (5.4%) |
Employment Occupations by Sex in Glen Park
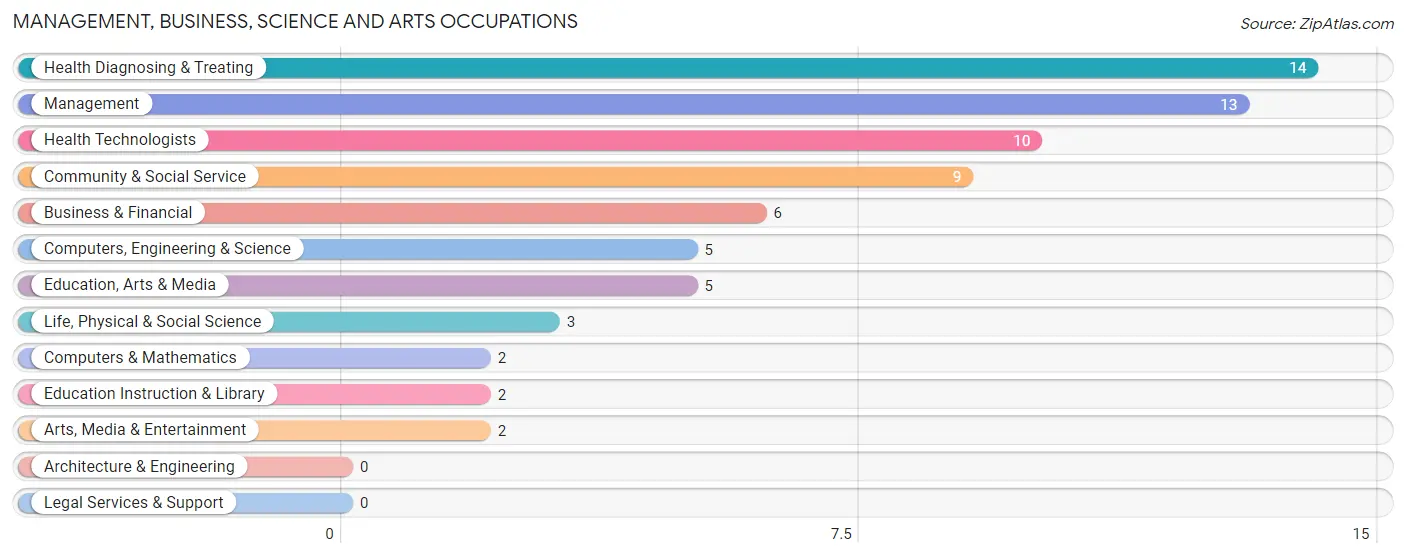
Management, Business, Science and Arts Occupations
The most common Management, Business, Science and Arts occupations in Glen Park are Health Diagnosing & Treating (14 | 4.6%), Management (13 | 4.2%), Health Technologists (10 | 3.3%), Community & Social Service (9 | 2.9%), and Business & Financial (6 | 1.9%).
Management, Business, Science and Arts Occupations by Sex
Within the Management, Business, Science and Arts occupations in Glen Park, the most male-oriented occupations are Life, Physical & Social Science (100.0%), Arts, Media & Entertainment (100.0%), and Computers, Engineering & Science (60.0%), while the most female-oriented occupations are Business & Financial (100.0%), Computers & Mathematics (100.0%), and Education, Arts & Media (100.0%).
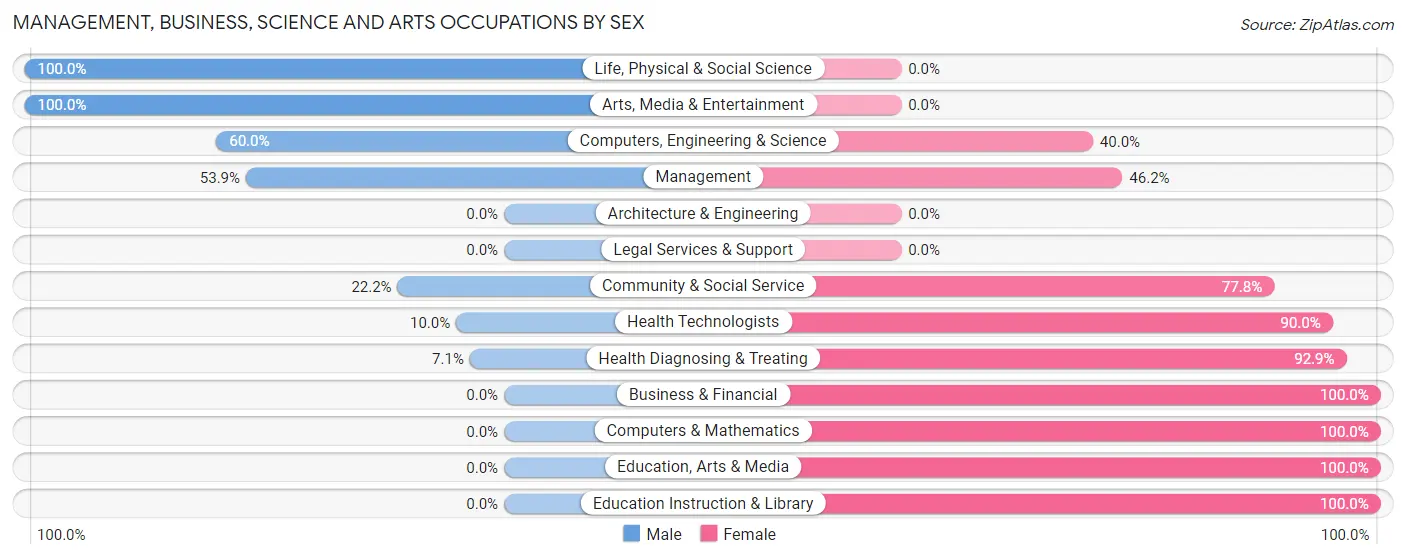
| Occupation | Male | Female |
| Management | 7 (53.8%) | 6 (46.2%) |
| Business & Financial | 0 (0.0%) | 6 (100.0%) |
| Computers, Engineering & Science | 3 (60.0%) | 2 (40.0%) |
| Computers & Mathematics | 0 (0.0%) | 2 (100.0%) |
| Architecture & Engineering | 0 (0.0%) | 0 (0.0%) |
| Life, Physical & Social Science | 3 (100.0%) | 0 (0.0%) |
| Community & Social Service | 2 (22.2%) | 7 (77.8%) |
| Education, Arts & Media | 0 (0.0%) | 5 (100.0%) |
| Legal Services & Support | 0 (0.0%) | 0 (0.0%) |
| Education Instruction & Library | 0 (0.0%) | 2 (100.0%) |
| Arts, Media & Entertainment | 2 (100.0%) | 0 (0.0%) |
| Health Diagnosing & Treating | 1 (7.1%) | 13 (92.9%) |
| Health Technologists | 1 (10.0%) | 9 (90.0%) |
| Total (Category) | 13 (27.7%) | 34 (72.3%) |
| Total (Overall) | 160 (52.1%) | 147 (47.9%) |
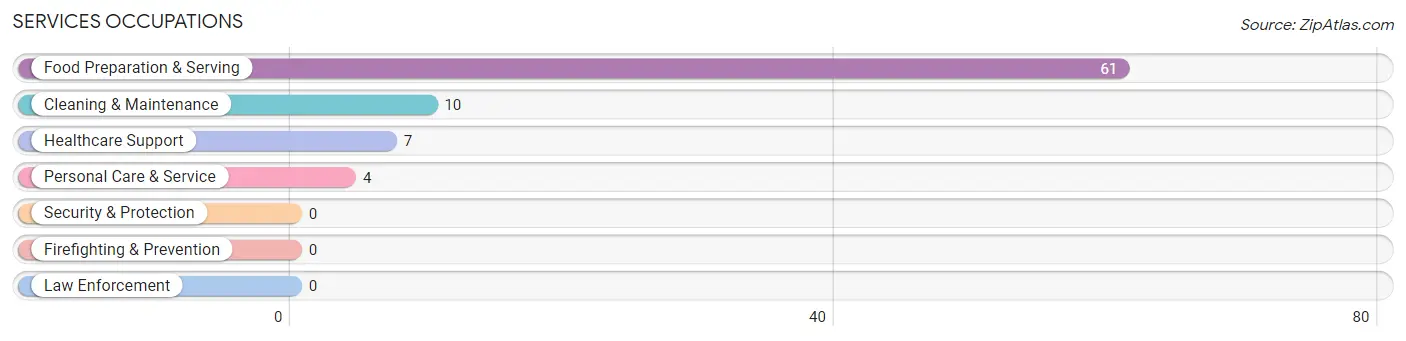
Services Occupations
The most common Services occupations in Glen Park are Food Preparation & Serving (61 | 19.9%), Cleaning & Maintenance (10 | 3.3%), Healthcare Support (7 | 2.3%), and Personal Care & Service (4 | 1.3%).
Services Occupations by Sex
Within the Services occupations in Glen Park, the most male-oriented occupations are Cleaning & Maintenance (80.0%), Personal Care & Service (50.0%), and Food Preparation & Serving (26.2%), while the most female-oriented occupations are Healthcare Support (100.0%), Food Preparation & Serving (73.8%), and Personal Care & Service (50.0%).
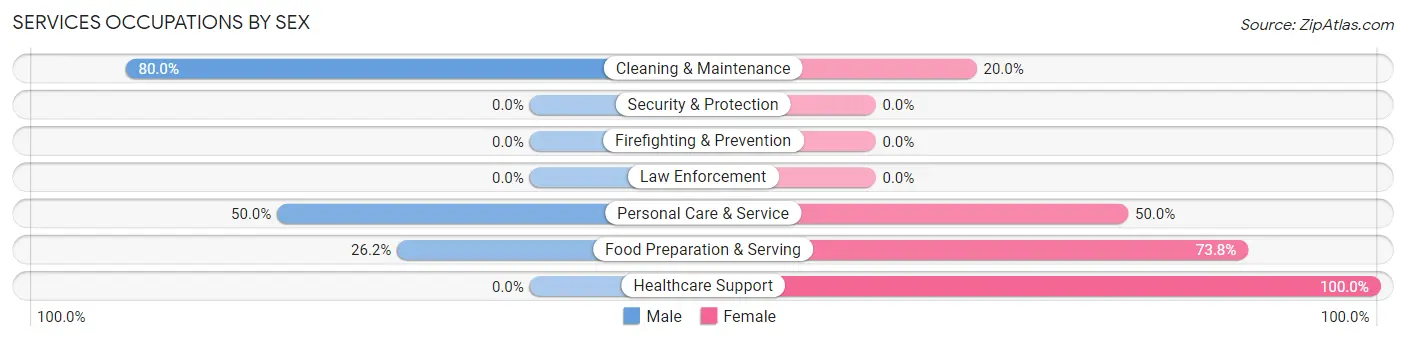
| Occupation | Male | Female |
| Healthcare Support | 0 (0.0%) | 7 (100.0%) |
| Security & Protection | 0 (0.0%) | 0 (0.0%) |
| Firefighting & Prevention | 0 (0.0%) | 0 (0.0%) |
| Law Enforcement | 0 (0.0%) | 0 (0.0%) |
| Food Preparation & Serving | 16 (26.2%) | 45 (73.8%) |
| Cleaning & Maintenance | 8 (80.0%) | 2 (20.0%) |
| Personal Care & Service | 2 (50.0%) | 2 (50.0%) |
| Total (Category) | 26 (31.7%) | 56 (68.3%) |
| Total (Overall) | 160 (52.1%) | 147 (47.9%) |
Sales and Office Occupations
The most common Sales and Office occupations in Glen Park are Sales & Related (72 | 23.4%), and Office & Administration (18 | 5.9%).
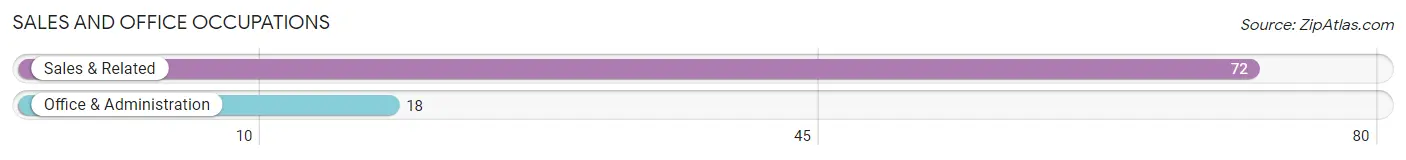
Sales and Office Occupations by Sex
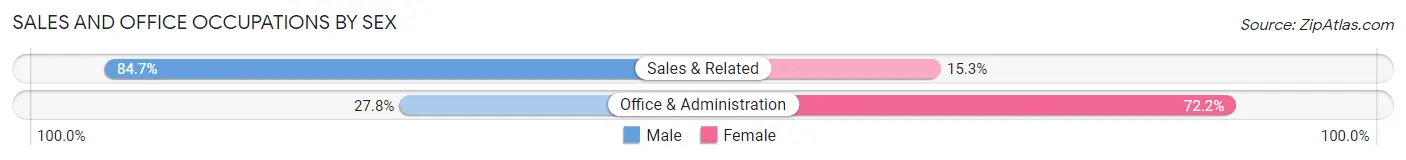
| Occupation | Male | Female |
| Sales & Related | 61 (84.7%) | 11 (15.3%) |
| Office & Administration | 5 (27.8%) | 13 (72.2%) |
| Total (Category) | 66 (73.3%) | 24 (26.7%) |
| Total (Overall) | 160 (52.1%) | 147 (47.9%) |
Natural Resources, Construction and Maintenance Occupations
The most common Natural Resources, Construction and Maintenance occupations in Glen Park are Construction & Extraction (19 | 6.2%), and Installation, Maintenance & Repair (14 | 4.6%).
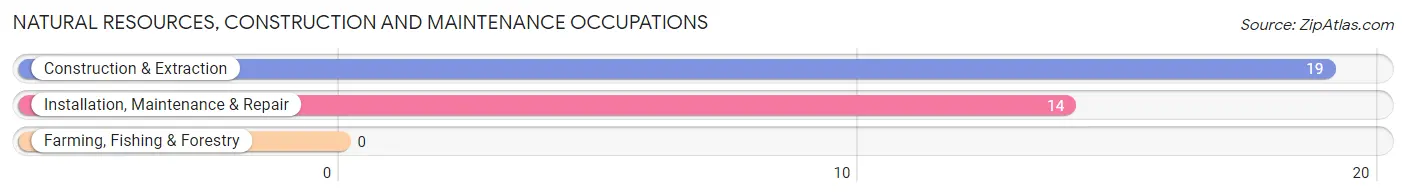
Natural Resources, Construction and Maintenance Occupations by Sex
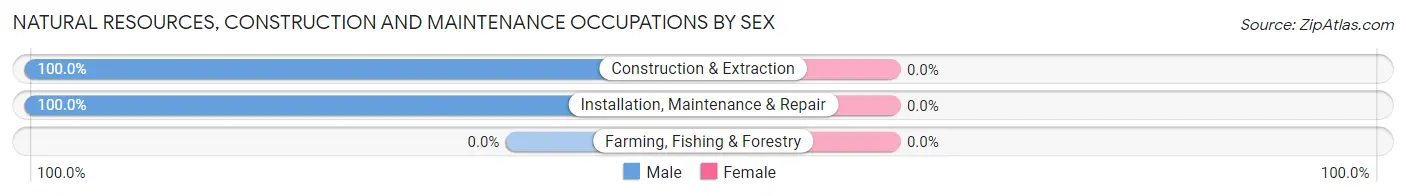
| Occupation | Male | Female |
| Farming, Fishing & Forestry | 0 (0.0%) | 0 (0.0%) |
| Construction & Extraction | 19 (100.0%) | 0 (0.0%) |
| Installation, Maintenance & Repair | 14 (100.0%) | 0 (0.0%) |
| Total (Category) | 33 (100.0%) | 0 (0.0%) |
| Total (Overall) | 160 (52.1%) | 147 (47.9%) |
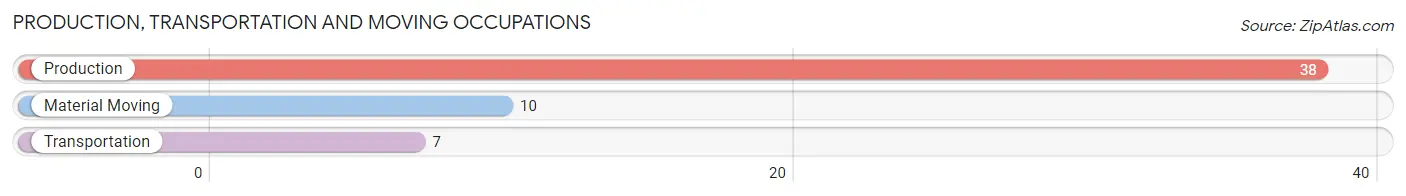
Production, Transportation and Moving Occupations
The most common Production, Transportation and Moving occupations in Glen Park are Production (38 | 12.4%), Material Moving (10 | 3.3%), and Transportation (7 | 2.3%).
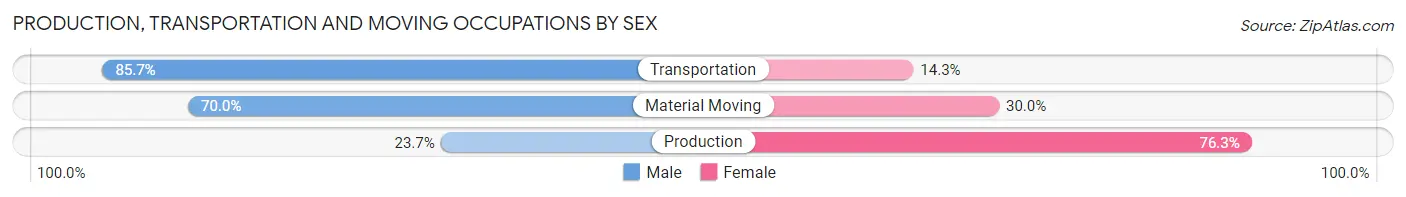
Production, Transportation and Moving Occupations by Sex
| Occupation | Male | Female |
| Production | 9 (23.7%) | 29 (76.3%) |
| Transportation | 6 (85.7%) | 1 (14.3%) |
| Material Moving | 7 (70.0%) | 3 (30.0%) |
| Total (Category) | 22 (40.0%) | 33 (60.0%) |
| Total (Overall) | 160 (52.1%) | 147 (47.9%) |
Employment Industries by Sex in Glen Park
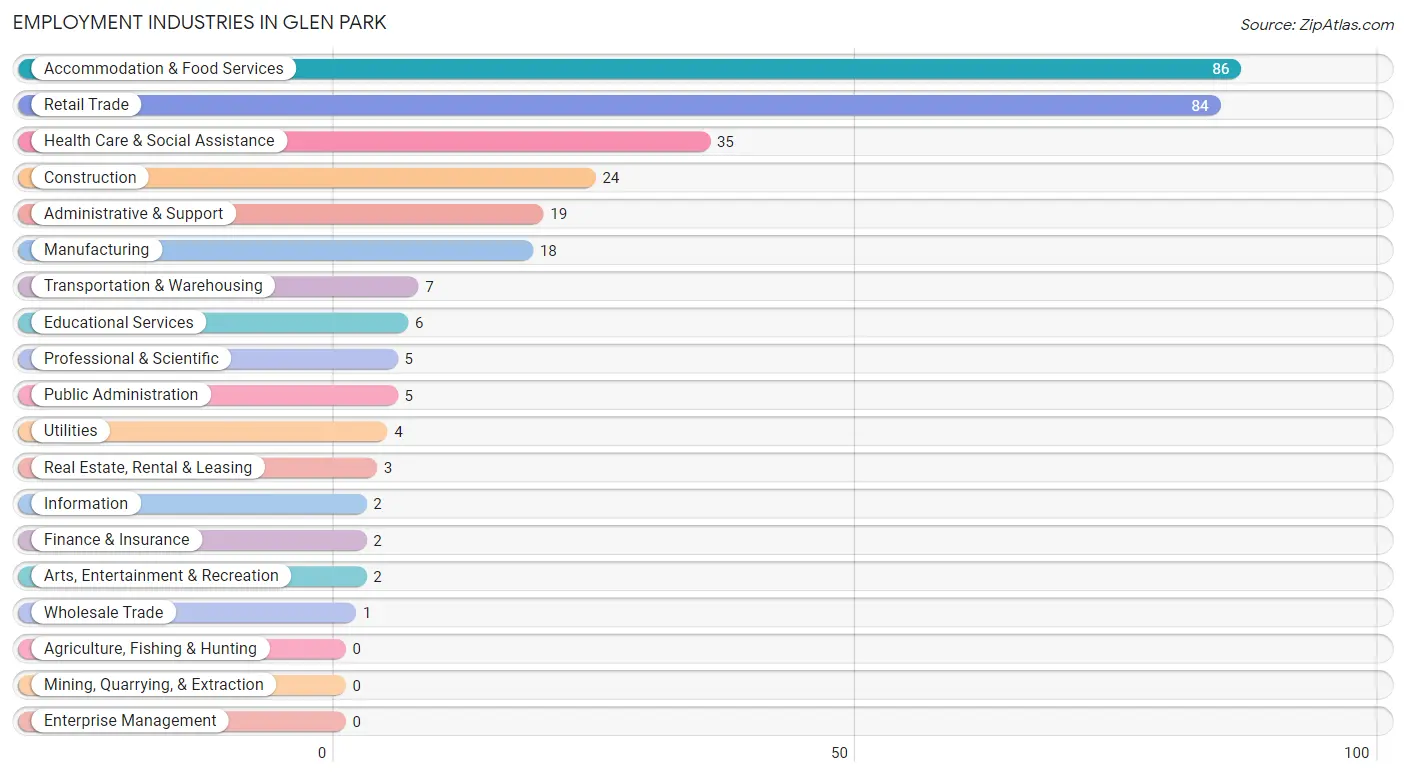
Employment Industries in Glen Park
The major employment industries in Glen Park include Accommodation & Food Services (86 | 28.0%), Retail Trade (84 | 27.4%), Health Care & Social Assistance (35 | 11.4%), Construction (24 | 7.8%), and Administrative & Support (19 | 6.2%).
Employment Industries by Sex in Glen Park
The Glen Park industries that see more men than women are Wholesale Trade (100.0%), Transportation & Warehousing (100.0%), and Utilities (100.0%), whereas the industries that tend to have a higher number of women are Finance & Insurance (100.0%), Professional & Scientific (100.0%), and Health Care & Social Assistance (97.1%).
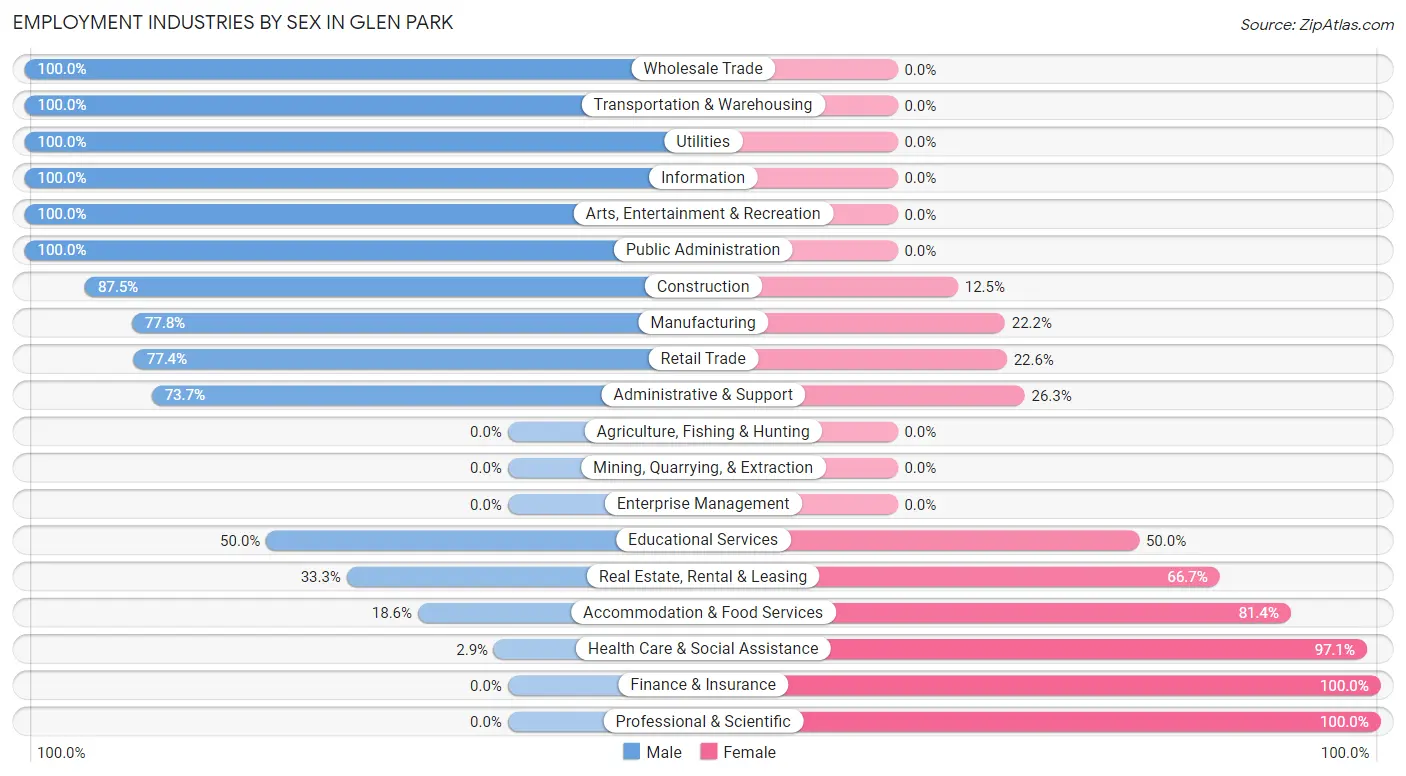
| Industry | Male | Female |
| Agriculture, Fishing & Hunting | 0 (0.0%) | 0 (0.0%) |
| Mining, Quarrying, & Extraction | 0 (0.0%) | 0 (0.0%) |
| Construction | 21 (87.5%) | 3 (12.5%) |
| Manufacturing | 14 (77.8%) | 4 (22.2%) |
| Wholesale Trade | 1 (100.0%) | 0 (0.0%) |
| Retail Trade | 65 (77.4%) | 19 (22.6%) |
| Transportation & Warehousing | 7 (100.0%) | 0 (0.0%) |
| Utilities | 4 (100.0%) | 0 (0.0%) |
| Information | 2 (100.0%) | 0 (0.0%) |
| Finance & Insurance | 0 (0.0%) | 2 (100.0%) |
| Real Estate, Rental & Leasing | 1 (33.3%) | 2 (66.7%) |
| Professional & Scientific | 0 (0.0%) | 5 (100.0%) |
| Enterprise Management | 0 (0.0%) | 0 (0.0%) |
| Administrative & Support | 14 (73.7%) | 5 (26.3%) |
| Educational Services | 3 (50.0%) | 3 (50.0%) |
| Health Care & Social Assistance | 1 (2.9%) | 34 (97.1%) |
| Arts, Entertainment & Recreation | 2 (100.0%) | 0 (0.0%) |
| Accommodation & Food Services | 16 (18.6%) | 70 (81.4%) |
| Public Administration | 5 (100.0%) | 0 (0.0%) |
| Total | 160 (52.1%) | 147 (47.9%) |
Education in Glen Park
School Enrollment in Glen Park
The most common levels of schooling among the 154 students in Glen Park are middle school (43 | 27.9%), high school (37 | 24.0%), and college / undergraduate (23 | 14.9%).
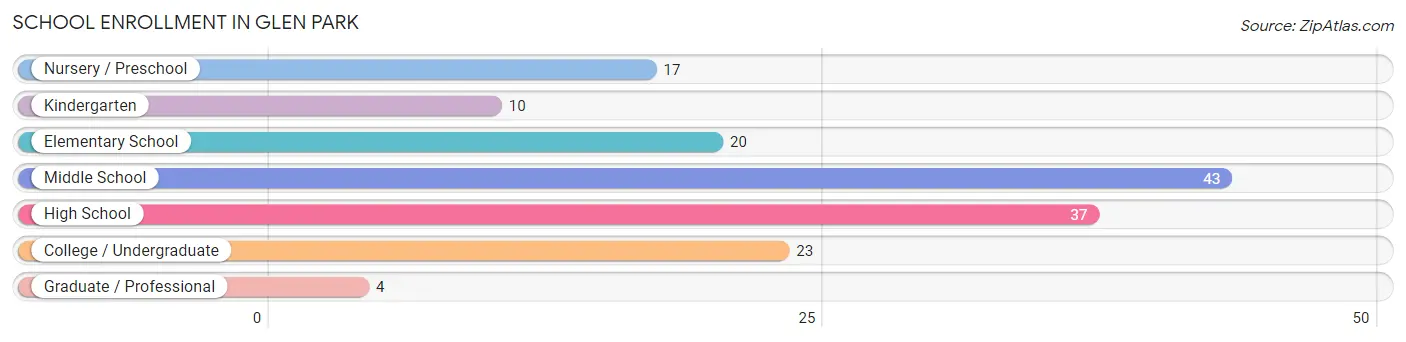
| School Level | # Students | % Students |
| Nursery / Preschool | 17 | 11.0% |
| Kindergarten | 10 | 6.5% |
| Elementary School | 20 | 13.0% |
| Middle School | 43 | 27.9% |
| High School | 37 | 24.0% |
| College / Undergraduate | 23 | 14.9% |
| Graduate / Professional | 4 | 2.6% |
| Total | 154 | 100.0% |
School Enrollment by Age by Funding Source in Glen Park
Out of a total of 154 students who are enrolled in schools in Glen Park, 11 (7.1%) attend a private institution, while the remaining 143 (92.9%) are enrolled in public schools. The age group of 35 years and over has the highest likelihood of being enrolled in private schools, with 3 (33.3% in the age bracket) enrolled. Conversely, the age group of 3 to 4 year olds has the lowest likelihood of being enrolled in a private school, with 17 (100.0% in the age bracket) attending a public institution.
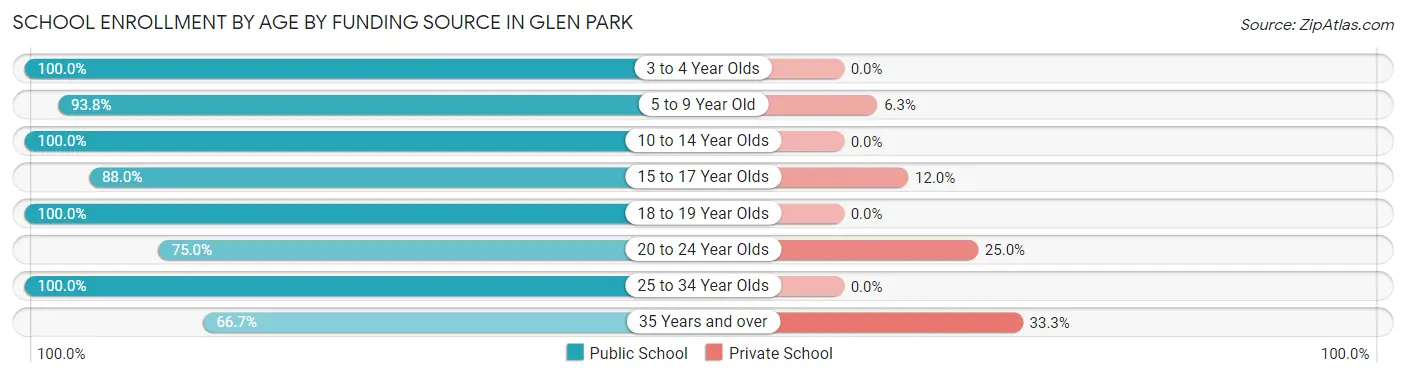
| Age Bracket | Public School | Private School |
| 3 to 4 Year Olds | 17 (100.0%) | 0 (0.0%) |
| 5 to 9 Year Old | 30 (93.8%) | 2 (6.2%) |
| 10 to 14 Year Olds | 49 (100.0%) | 0 (0.0%) |
| 15 to 17 Year Olds | 22 (88.0%) | 3 (12.0%) |
| 18 to 19 Year Olds | 7 (100.0%) | 0 (0.0%) |
| 20 to 24 Year Olds | 9 (75.0%) | 3 (25.0%) |
| 25 to 34 Year Olds | 3 (100.0%) | 0 (0.0%) |
| 35 Years and over | 6 (66.7%) | 3 (33.3%) |
| Total | 143 (92.9%) | 11 (7.1%) |
Educational Attainment by Field of Study in Glen Park
Science & technology (46 | 66.7%), education (6 | 8.7%), social sciences (5 | 7.2%), psychology (3 | 4.3%), and arts & humanities (3 | 4.3%) are the most common fields of study among 69 individuals in Glen Park who have obtained a bachelor's degree or higher.
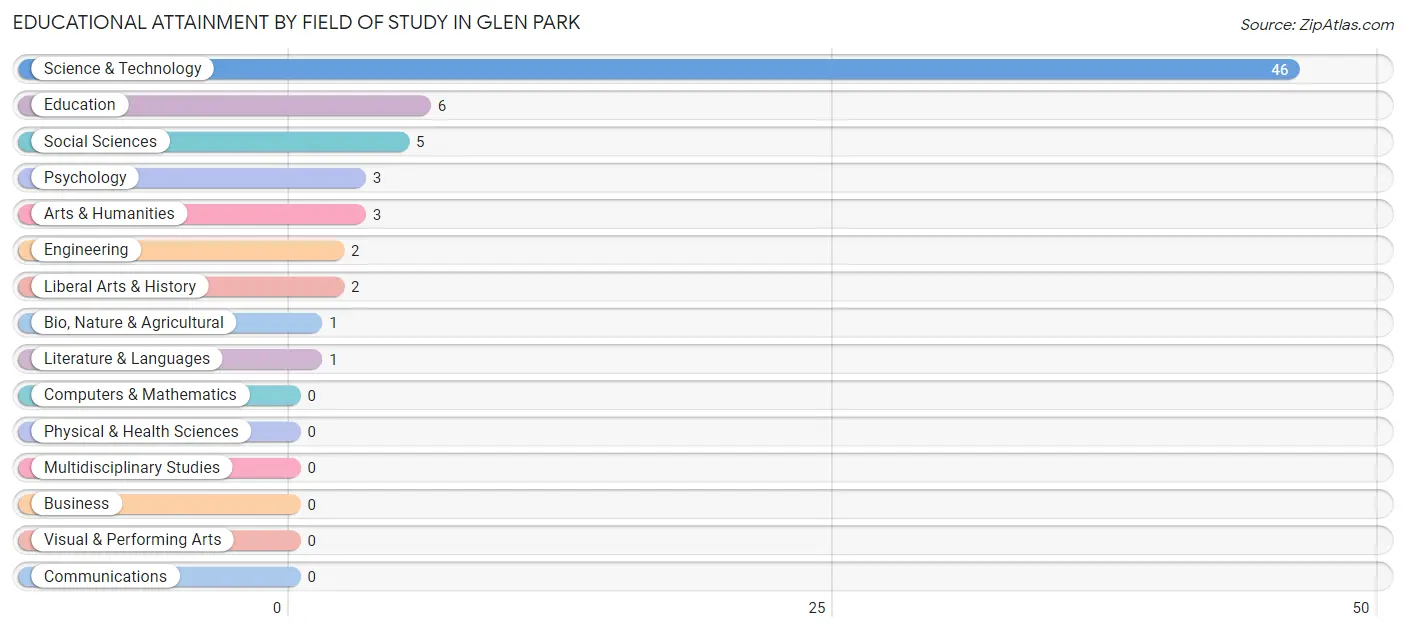
| Field of Study | # Graduates | % Graduates |
| Computers & Mathematics | 0 | 0.0% |
| Bio, Nature & Agricultural | 1 | 1.5% |
| Physical & Health Sciences | 0 | 0.0% |
| Psychology | 3 | 4.3% |
| Social Sciences | 5 | 7.2% |
| Engineering | 2 | 2.9% |
| Multidisciplinary Studies | 0 | 0.0% |
| Science & Technology | 46 | 66.7% |
| Business | 0 | 0.0% |
| Education | 6 | 8.7% |
| Literature & Languages | 1 | 1.5% |
| Liberal Arts & History | 2 | 2.9% |
| Visual & Performing Arts | 0 | 0.0% |
| Communications | 0 | 0.0% |
| Arts & Humanities | 3 | 4.3% |
| Total | 69 | 100.0% |
Transportation & Commute in Glen Park
Vehicle Availability by Sex in Glen Park
The most prevalent vehicle ownership categories in Glen Park are males with 2 vehicles (106, accounting for 67.1%) and females with 2 vehicles (96, making up 73.1%).
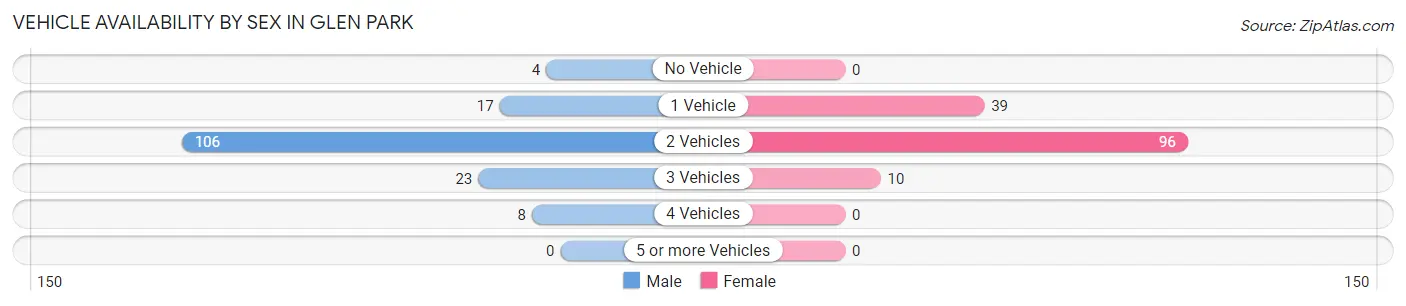
| Vehicles Available | Male | Female |
| No Vehicle | 4 (2.5%) | 0 (0.0%) |
| 1 Vehicle | 17 (10.8%) | 39 (26.9%) |
| 2 Vehicles | 106 (67.1%) | 96 (66.2%) |
| 3 Vehicles | 23 (14.6%) | 10 (6.9%) |
| 4 Vehicles | 8 (5.1%) | 0 (0.0%) |
| 5 or more Vehicles | 0 (0.0%) | 0 (0.0%) |
| Total | 158 (100.0%) | 145 (100.0%) |
Commute Time in Glen Park
The most frequently occuring commute durations in Glen Park are 20 to 24 minutes (84 commuters, 27.8%), 5 to 9 minutes (77 commuters, 25.5%), and 15 to 19 minutes (63 commuters, 20.9%).
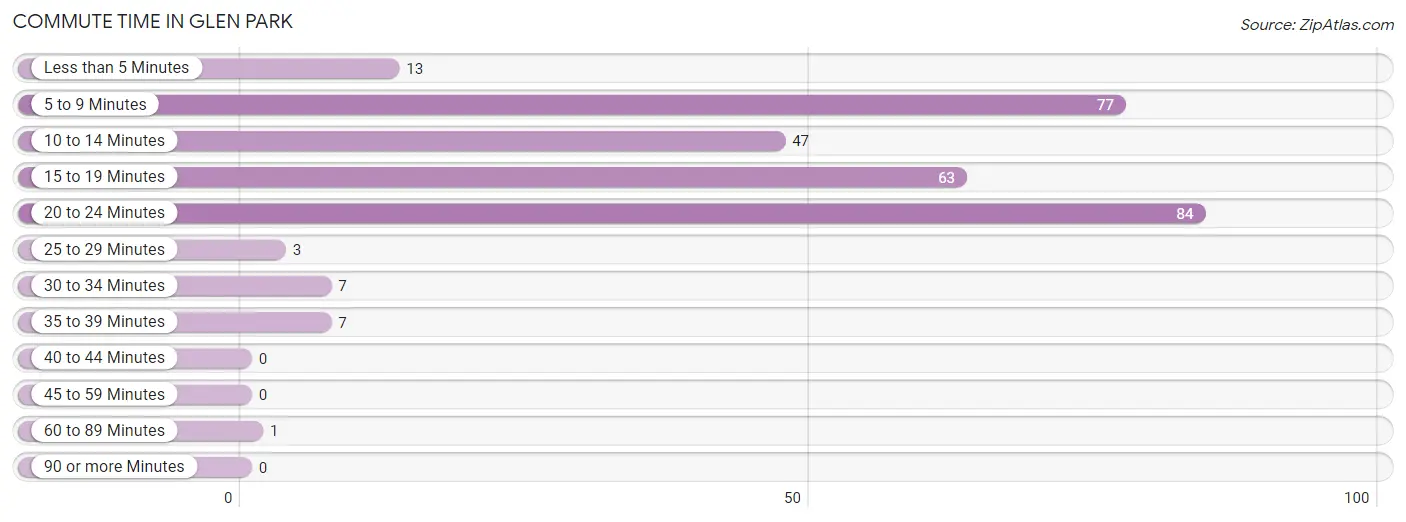
| Commute Time | # Commuters | % Commuters |
| Less than 5 Minutes | 13 | 4.3% |
| 5 to 9 Minutes | 77 | 25.5% |
| 10 to 14 Minutes | 47 | 15.6% |
| 15 to 19 Minutes | 63 | 20.9% |
| 20 to 24 Minutes | 84 | 27.8% |
| 25 to 29 Minutes | 3 | 1.0% |
| 30 to 34 Minutes | 7 | 2.3% |
| 35 to 39 Minutes | 7 | 2.3% |
| 40 to 44 Minutes | 0 | 0.0% |
| 45 to 59 Minutes | 0 | 0.0% |
| 60 to 89 Minutes | 1 | 0.3% |
| 90 or more Minutes | 0 | 0.0% |
Commute Time by Sex in Glen Park
The most common commute times in Glen Park are 20 to 24 minutes (76 commuters, 48.1%) for males and 15 to 19 minutes (56 commuters, 38.9%) for females.
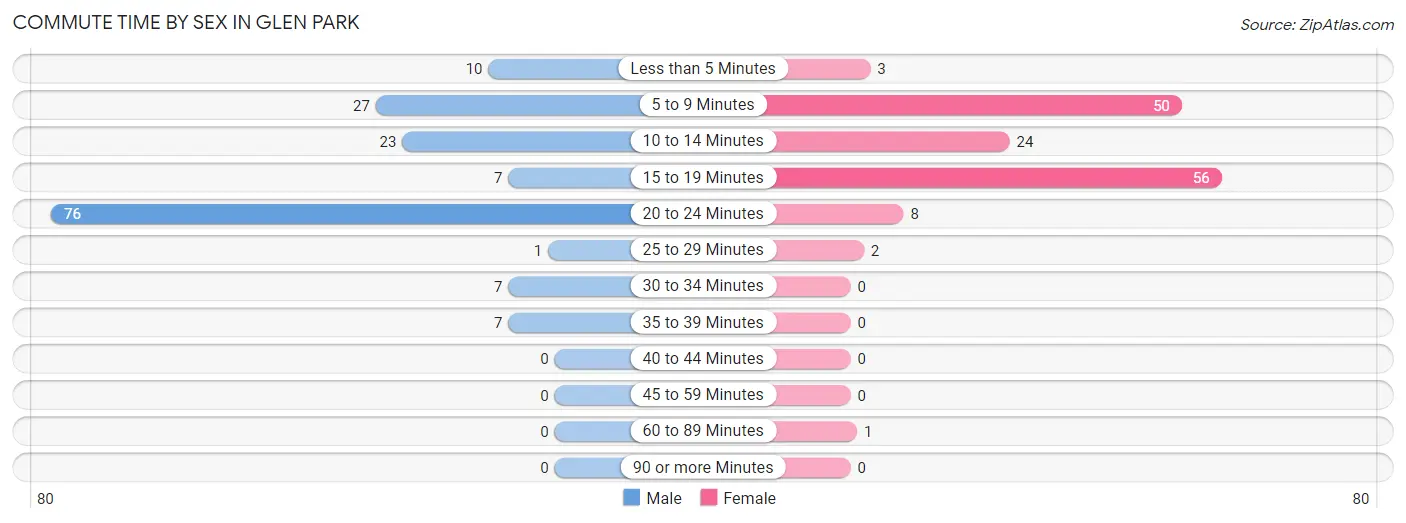
| Commute Time | Male | Female |
| Less than 5 Minutes | 10 (6.3%) | 3 (2.1%) |
| 5 to 9 Minutes | 27 (17.1%) | 50 (34.7%) |
| 10 to 14 Minutes | 23 (14.6%) | 24 (16.7%) |
| 15 to 19 Minutes | 7 (4.4%) | 56 (38.9%) |
| 20 to 24 Minutes | 76 (48.1%) | 8 (5.6%) |
| 25 to 29 Minutes | 1 (0.6%) | 2 (1.4%) |
| 30 to 34 Minutes | 7 (4.4%) | 0 (0.0%) |
| 35 to 39 Minutes | 7 (4.4%) | 0 (0.0%) |
| 40 to 44 Minutes | 0 (0.0%) | 0 (0.0%) |
| 45 to 59 Minutes | 0 (0.0%) | 0 (0.0%) |
| 60 to 89 Minutes | 0 (0.0%) | 1 (0.7%) |
| 90 or more Minutes | 0 (0.0%) | 0 (0.0%) |
Time of Departure to Work by Sex in Glen Park
The most frequent times of departure to work in Glen Park are 8:30 AM to 8:59 AM (45, 28.5%) for males and 6:00 AM to 6:29 AM (43, 29.9%) for females.
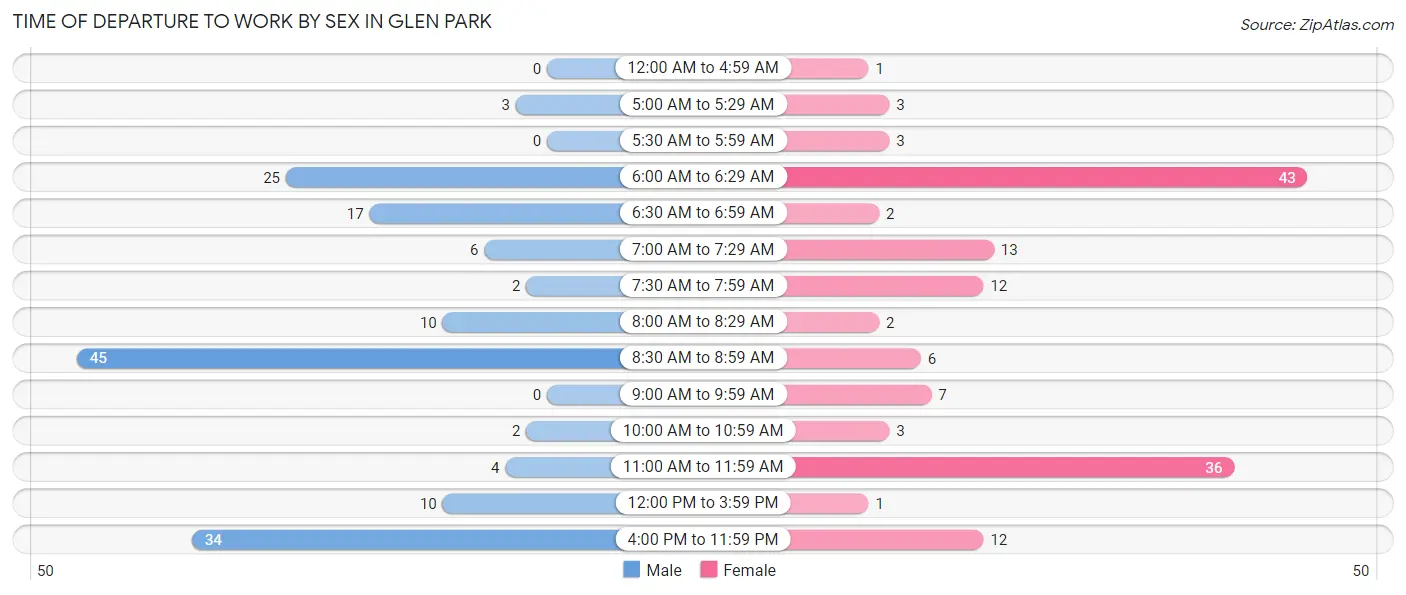
| Time of Departure | Male | Female |
| 12:00 AM to 4:59 AM | 0 (0.0%) | 1 (0.7%) |
| 5:00 AM to 5:29 AM | 3 (1.9%) | 3 (2.1%) |
| 5:30 AM to 5:59 AM | 0 (0.0%) | 3 (2.1%) |
| 6:00 AM to 6:29 AM | 25 (15.8%) | 43 (29.9%) |
| 6:30 AM to 6:59 AM | 17 (10.8%) | 2 (1.4%) |
| 7:00 AM to 7:29 AM | 6 (3.8%) | 13 (9.0%) |
| 7:30 AM to 7:59 AM | 2 (1.3%) | 12 (8.3%) |
| 8:00 AM to 8:29 AM | 10 (6.3%) | 2 (1.4%) |
| 8:30 AM to 8:59 AM | 45 (28.5%) | 6 (4.2%) |
| 9:00 AM to 9:59 AM | 0 (0.0%) | 7 (4.9%) |
| 10:00 AM to 10:59 AM | 2 (1.3%) | 3 (2.1%) |
| 11:00 AM to 11:59 AM | 4 (2.5%) | 36 (25.0%) |
| 12:00 PM to 3:59 PM | 10 (6.3%) | 1 (0.7%) |
| 4:00 PM to 11:59 PM | 34 (21.5%) | 12 (8.3%) |
| Total | 158 (100.0%) | 144 (100.0%) |
Housing Occupancy in Glen Park
Occupancy by Ownership in Glen Park
Of the total 216 dwellings in Glen Park, owner-occupied units account for 148 (68.5%), while renter-occupied units make up 68 (31.5%).
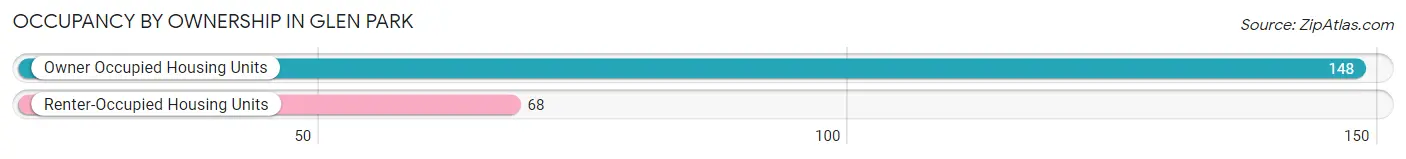
| Occupancy | # Housing Units | % Housing Units |
| Owner Occupied Housing Units | 148 | 68.5% |
| Renter-Occupied Housing Units | 68 | 31.5% |
| Total Occupied Housing Units | 216 | 100.0% |
Occupancy by Household Size in Glen Park
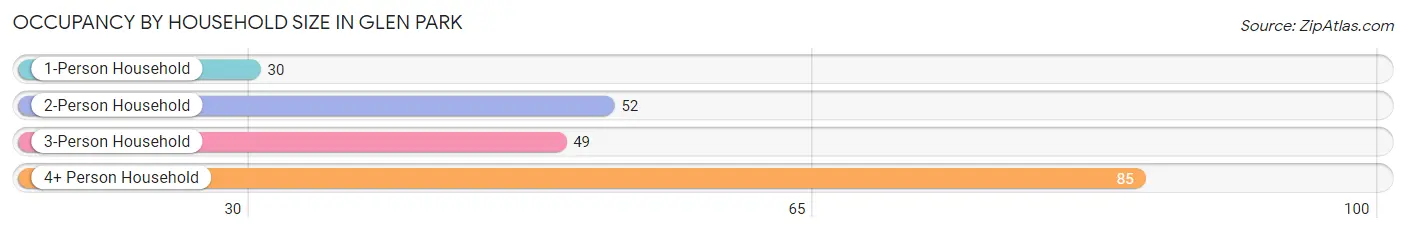
| Household Size | # Housing Units | % Housing Units |
| 1-Person Household | 30 | 13.9% |
| 2-Person Household | 52 | 24.1% |
| 3-Person Household | 49 | 22.7% |
| 4+ Person Household | 85 | 39.4% |
| Total Housing Units | 216 | 100.0% |
Occupancy by Ownership by Household Size in Glen Park
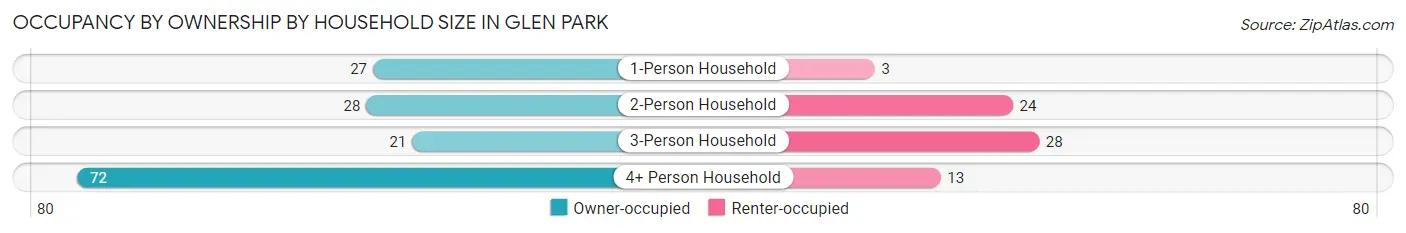
| Household Size | Owner-occupied | Renter-occupied |
| 1-Person Household | 27 (90.0%) | 3 (10.0%) |
| 2-Person Household | 28 (53.8%) | 24 (46.2%) |
| 3-Person Household | 21 (42.9%) | 28 (57.1%) |
| 4+ Person Household | 72 (84.7%) | 13 (15.3%) |
| Total Housing Units | 148 (68.5%) | 68 (31.5%) |
Occupancy by Educational Attainment in Glen Park
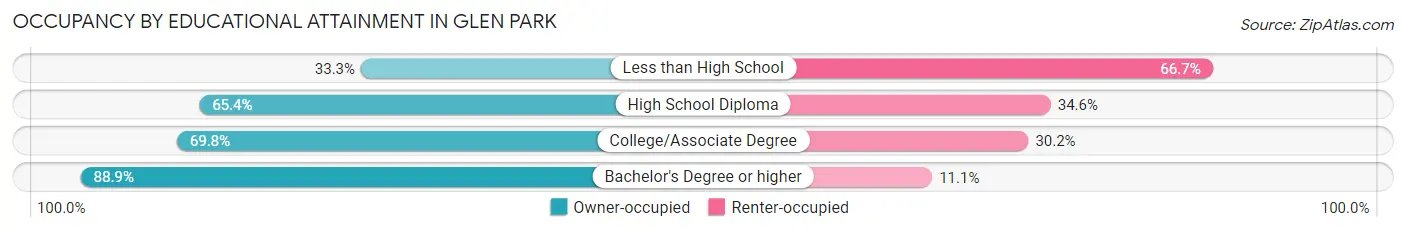
| Household Size | Owner-occupied | Renter-occupied |
| Less than High School | 2 (33.3%) | 4 (66.7%) |
| High School Diploma | 85 (65.4%) | 45 (34.6%) |
| College/Associate Degree | 37 (69.8%) | 16 (30.2%) |
| Bachelor's Degree or higher | 24 (88.9%) | 3 (11.1%) |
Occupancy by Age of Householder in Glen Park
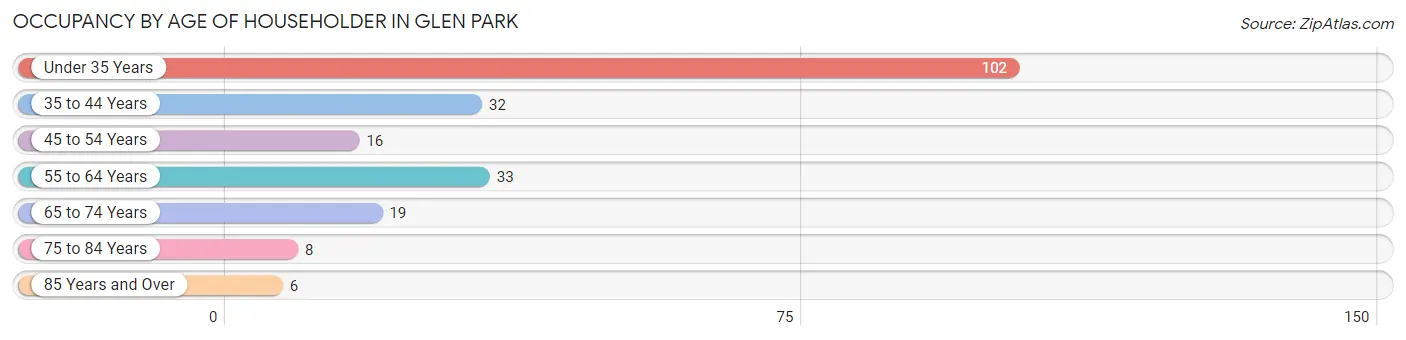
| Age Bracket | # Households | % Households |
| Under 35 Years | 102 | 47.2% |
| 35 to 44 Years | 32 | 14.8% |
| 45 to 54 Years | 16 | 7.4% |
| 55 to 64 Years | 33 | 15.3% |
| 65 to 74 Years | 19 | 8.8% |
| 75 to 84 Years | 8 | 3.7% |
| 85 Years and Over | 6 | 2.8% |
| Total | 216 | 100.0% |
Housing Finances in Glen Park
Median Income by Occupancy in Glen Park
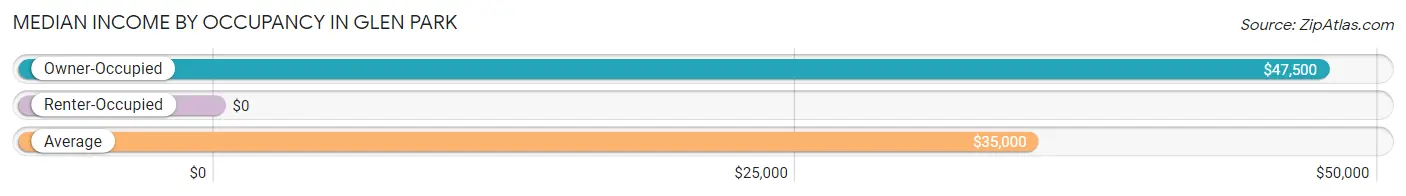
| Occupancy Type | # Households | Median Income |
| Owner-Occupied | 148 (68.5%) | $47,500 |
| Renter-Occupied | 68 (31.5%) | $0 |
| Average | 216 (100.0%) | $35,000 |
Occupancy by Householder Income Bracket in Glen Park
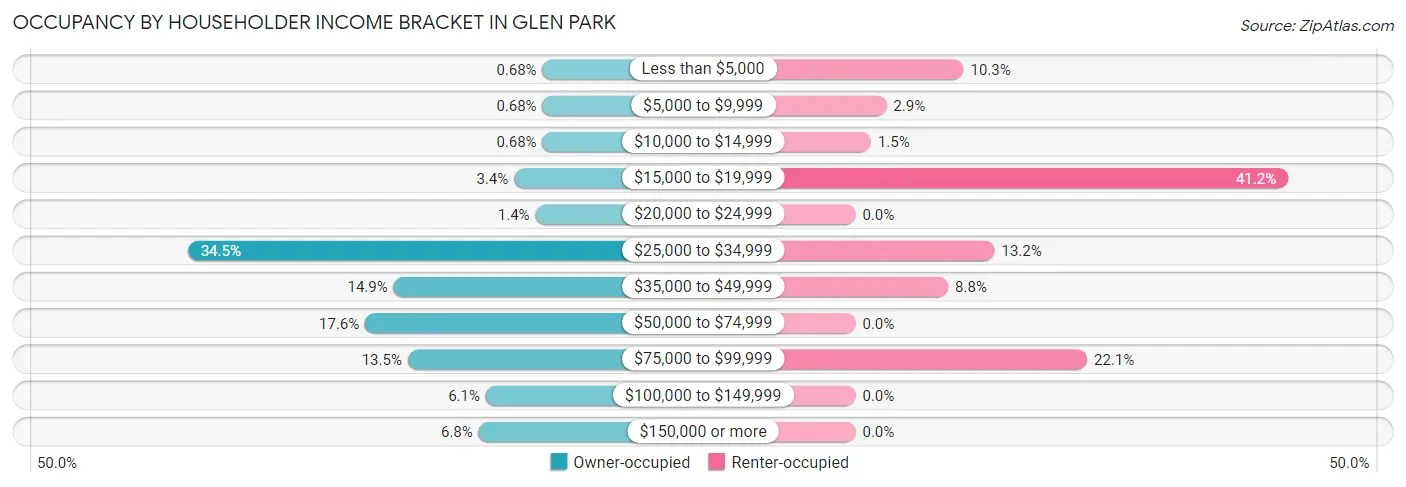
| Income Bracket | Owner-occupied | Renter-occupied |
| Less than $5,000 | 1 (0.7%) | 7 (10.3%) |
| $5,000 to $9,999 | 1 (0.7%) | 2 (2.9%) |
| $10,000 to $14,999 | 1 (0.7%) | 1 (1.5%) |
| $15,000 to $19,999 | 5 (3.4%) | 28 (41.2%) |
| $20,000 to $24,999 | 2 (1.3%) | 0 (0.0%) |
| $25,000 to $34,999 | 51 (34.5%) | 9 (13.2%) |
| $35,000 to $49,999 | 22 (14.9%) | 6 (8.8%) |
| $50,000 to $74,999 | 26 (17.6%) | 0 (0.0%) |
| $75,000 to $99,999 | 20 (13.5%) | 15 (22.1%) |
| $100,000 to $149,999 | 9 (6.1%) | 0 (0.0%) |
| $150,000 or more | 10 (6.8%) | 0 (0.0%) |
| Total | 148 (100.0%) | 68 (100.0%) |
Monthly Housing Cost Tiers in Glen Park
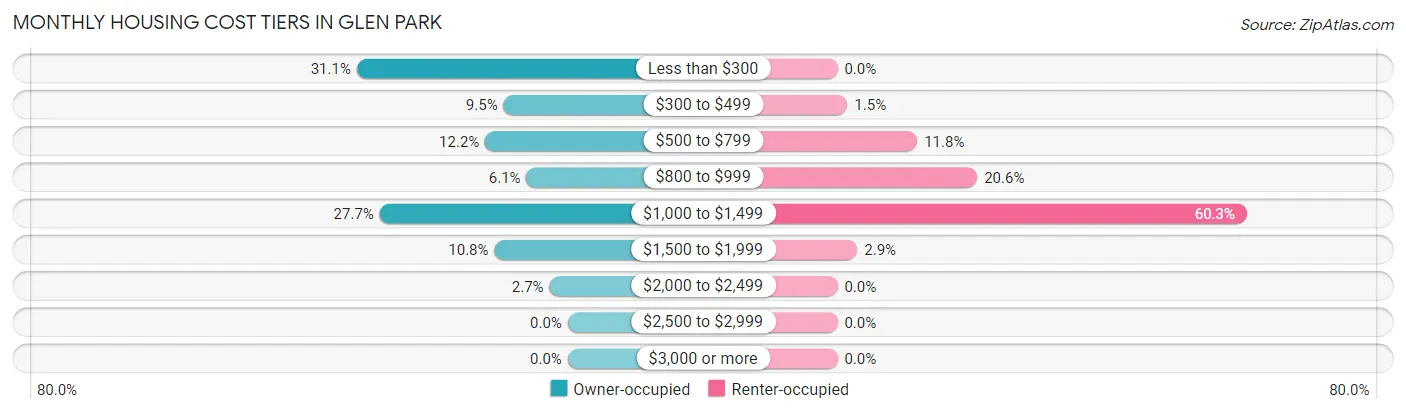
| Monthly Cost | Owner-occupied | Renter-occupied |
| Less than $300 | 46 (31.1%) | 0 (0.0%) |
| $300 to $499 | 14 (9.5%) | 1 (1.5%) |
| $500 to $799 | 18 (12.2%) | 8 (11.8%) |
| $800 to $999 | 9 (6.1%) | 14 (20.6%) |
| $1,000 to $1,499 | 41 (27.7%) | 41 (60.3%) |
| $1,500 to $1,999 | 16 (10.8%) | 2 (2.9%) |
| $2,000 to $2,499 | 4 (2.7%) | 0 (0.0%) |
| $2,500 to $2,999 | 0 (0.0%) | 0 (0.0%) |
| $3,000 or more | 0 (0.0%) | 0 (0.0%) |
| Total | 148 (100.0%) | 68 (100.0%) |
Physical Housing Characteristics in Glen Park
Housing Structures in Glen Park
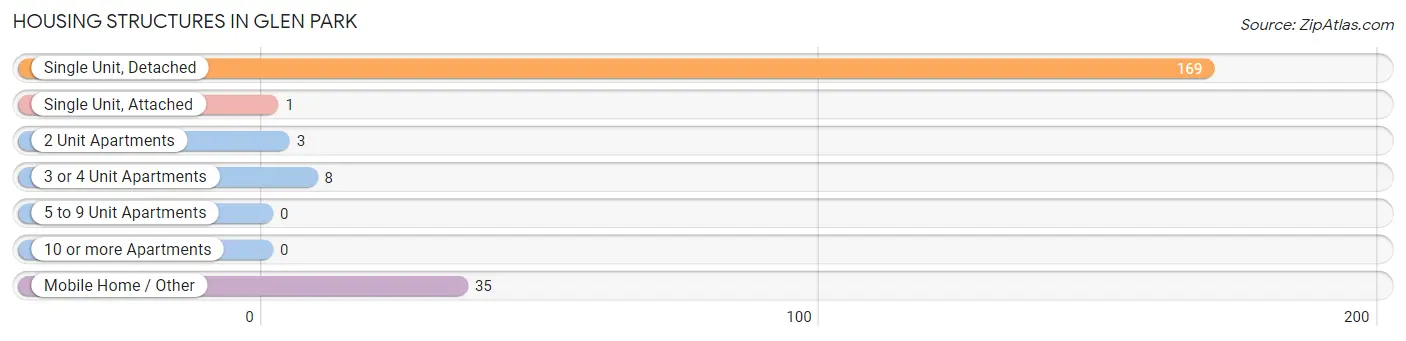
| Structure Type | # Housing Units | % Housing Units |
| Single Unit, Detached | 169 | 78.2% |
| Single Unit, Attached | 1 | 0.5% |
| 2 Unit Apartments | 3 | 1.4% |
| 3 or 4 Unit Apartments | 8 | 3.7% |
| 5 to 9 Unit Apartments | 0 | 0.0% |
| 10 or more Apartments | 0 | 0.0% |
| Mobile Home / Other | 35 | 16.2% |
| Total | 216 | 100.0% |
Housing Structures by Occupancy in Glen Park
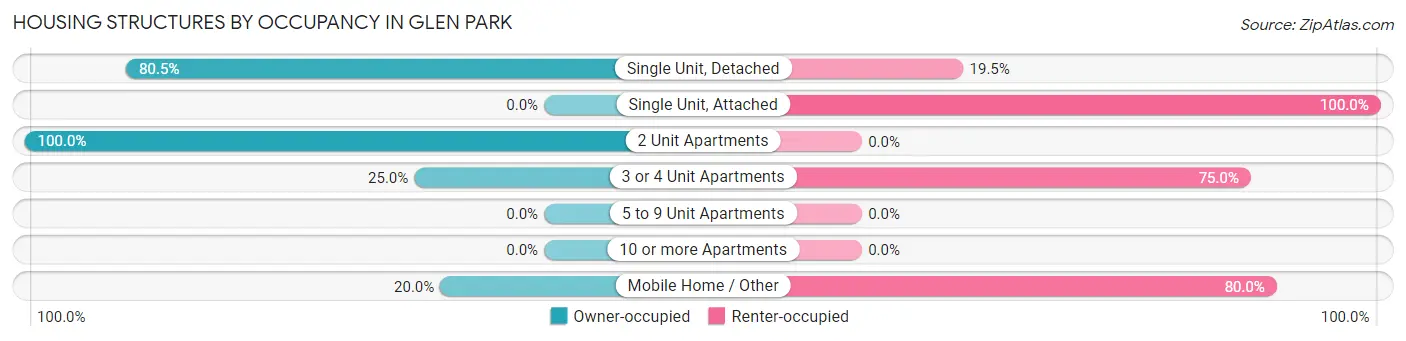
| Structure Type | Owner-occupied | Renter-occupied |
| Single Unit, Detached | 136 (80.5%) | 33 (19.5%) |
| Single Unit, Attached | 0 (0.0%) | 1 (100.0%) |
| 2 Unit Apartments | 3 (100.0%) | 0 (0.0%) |
| 3 or 4 Unit Apartments | 2 (25.0%) | 6 (75.0%) |
| 5 to 9 Unit Apartments | 0 (0.0%) | 0 (0.0%) |
| 10 or more Apartments | 0 (0.0%) | 0 (0.0%) |
| Mobile Home / Other | 7 (20.0%) | 28 (80.0%) |
| Total | 148 (68.5%) | 68 (31.5%) |
Housing Structures by Number of Rooms in Glen Park
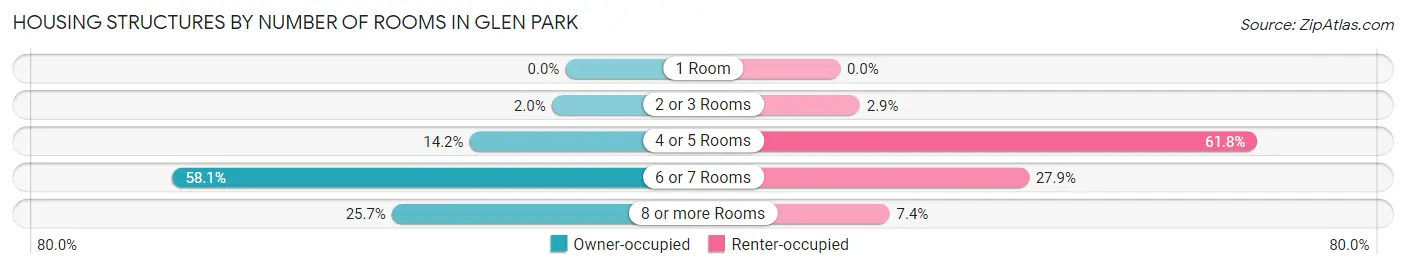
| Number of Rooms | Owner-occupied | Renter-occupied |
| 1 Room | 0 (0.0%) | 0 (0.0%) |
| 2 or 3 Rooms | 3 (2.0%) | 2 (2.9%) |
| 4 or 5 Rooms | 21 (14.2%) | 42 (61.8%) |
| 6 or 7 Rooms | 86 (58.1%) | 19 (27.9%) |
| 8 or more Rooms | 38 (25.7%) | 5 (7.3%) |
| Total | 148 (100.0%) | 68 (100.0%) |
Housing Structure by Heating Type in Glen Park
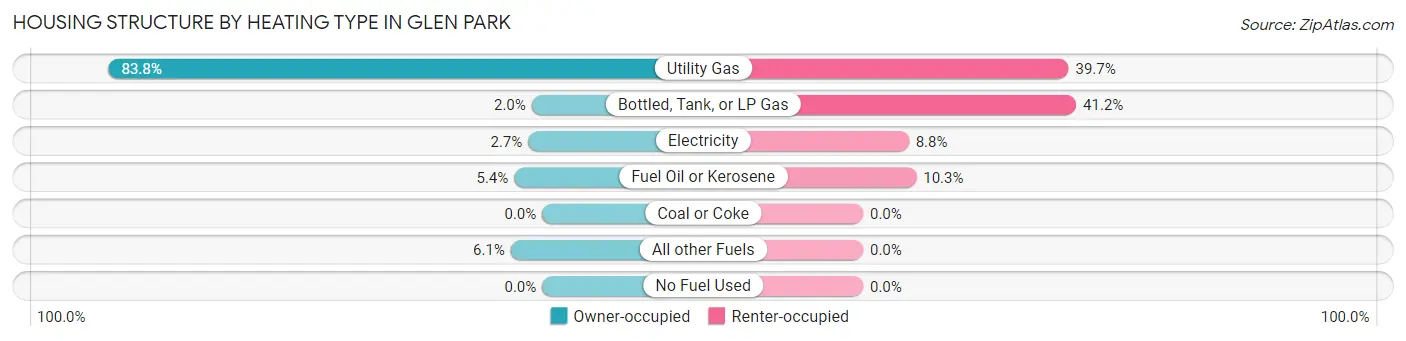
| Heating Type | Owner-occupied | Renter-occupied |
| Utility Gas | 124 (83.8%) | 27 (39.7%) |
| Bottled, Tank, or LP Gas | 3 (2.0%) | 28 (41.2%) |
| Electricity | 4 (2.7%) | 6 (8.8%) |
| Fuel Oil or Kerosene | 8 (5.4%) | 7 (10.3%) |
| Coal or Coke | 0 (0.0%) | 0 (0.0%) |
| All other Fuels | 9 (6.1%) | 0 (0.0%) |
| No Fuel Used | 0 (0.0%) | 0 (0.0%) |
| Total | 148 (100.0%) | 68 (100.0%) |
Household Vehicle Usage in Glen Park
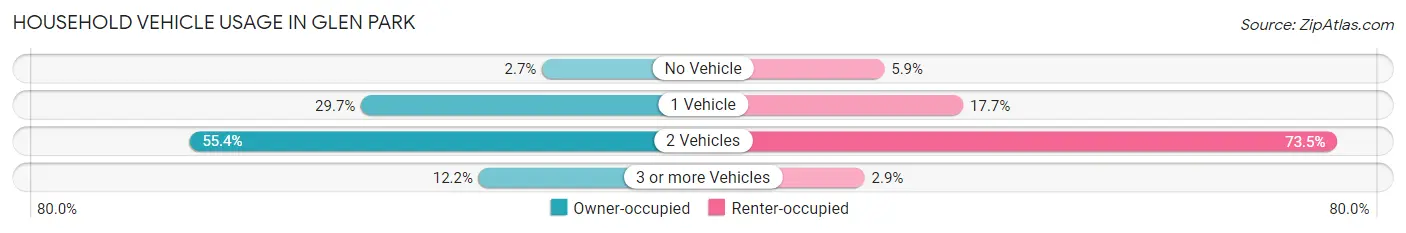
| Vehicles per Household | Owner-occupied | Renter-occupied |
| No Vehicle | 4 (2.7%) | 4 (5.9%) |
| 1 Vehicle | 44 (29.7%) | 12 (17.6%) |
| 2 Vehicles | 82 (55.4%) | 50 (73.5%) |
| 3 or more Vehicles | 18 (12.2%) | 2 (2.9%) |
| Total | 148 (100.0%) | 68 (100.0%) |
Real Estate & Mortgages in Glen Park
Real Estate and Mortgage Overview in Glen Park
| Characteristic | Without Mortgage | With Mortgage |
| Housing Units | 83 | 65 |
| Median Property Value | $182,800 | $140,400 |
| Median Household Income | $31,982 | $8 |
| Monthly Housing Costs | - | - |
| Real Estate Taxes | $2,583 | $9 |
Property Value by Mortgage Status in Glen Park
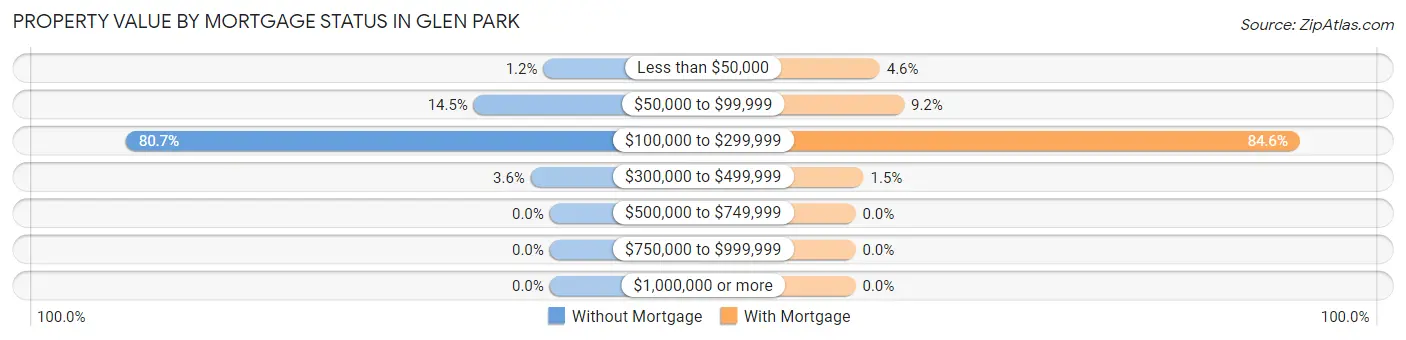
| Property Value | Without Mortgage | With Mortgage |
| Less than $50,000 | 1 (1.2%) | 3 (4.6%) |
| $50,000 to $99,999 | 12 (14.5%) | 6 (9.2%) |
| $100,000 to $299,999 | 67 (80.7%) | 55 (84.6%) |
| $300,000 to $499,999 | 3 (3.6%) | 1 (1.5%) |
| $500,000 to $749,999 | 0 (0.0%) | 0 (0.0%) |
| $750,000 to $999,999 | 0 (0.0%) | 0 (0.0%) |
| $1,000,000 or more | 0 (0.0%) | 0 (0.0%) |
| Total | 83 (100.0%) | 65 (100.0%) |
Household Income by Mortgage Status in Glen Park
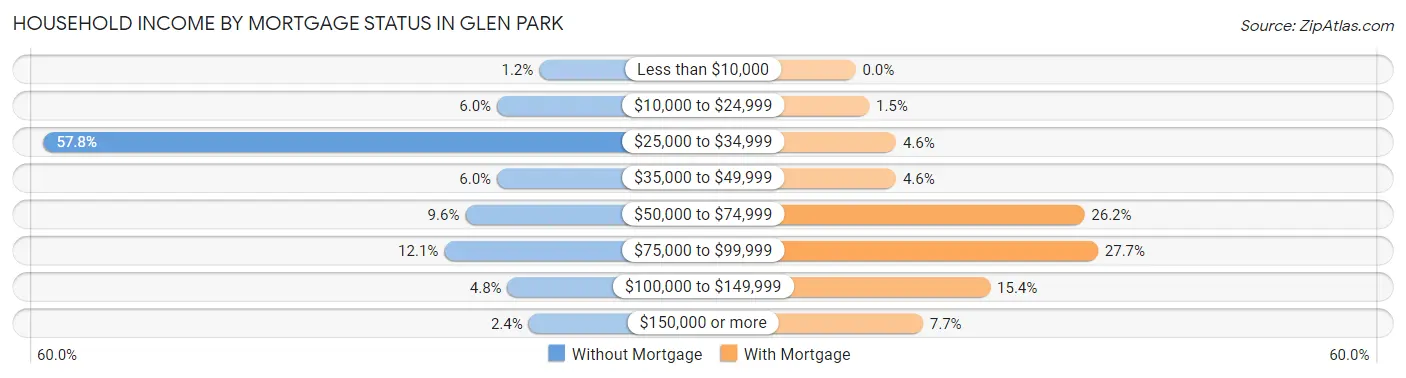
| Household Income | Without Mortgage | With Mortgage |
| Less than $10,000 | 1 (1.2%) | 0 (0.0%) |
| $10,000 to $24,999 | 5 (6.0%) | 1 (1.5%) |
| $25,000 to $34,999 | 48 (57.8%) | 3 (4.6%) |
| $35,000 to $49,999 | 5 (6.0%) | 3 (4.6%) |
| $50,000 to $74,999 | 8 (9.6%) | 17 (26.2%) |
| $75,000 to $99,999 | 10 (12.0%) | 18 (27.7%) |
| $100,000 to $149,999 | 4 (4.8%) | 10 (15.4%) |
| $150,000 or more | 2 (2.4%) | 5 (7.7%) |
| Total | 83 (100.0%) | 65 (100.0%) |
Property Value to Household Income Ratio in Glen Park
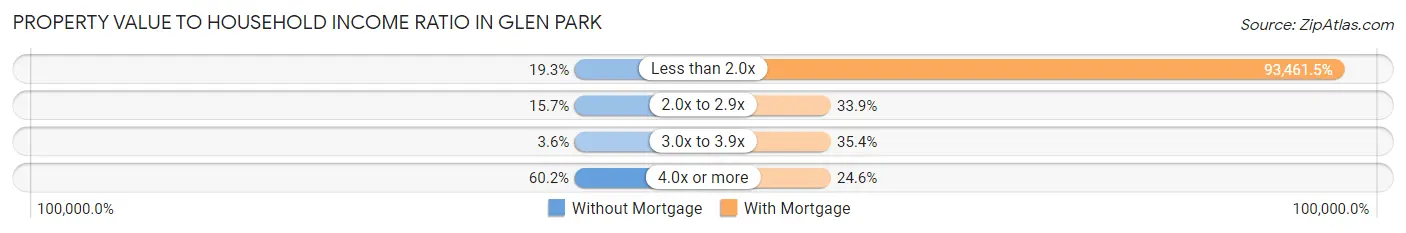
| Value-to-Income Ratio | Without Mortgage | With Mortgage |
| Less than 2.0x | 16 (19.3%) | 60,750 (93,461.5%) |
| 2.0x to 2.9x | 13 (15.7%) | 22 (33.9%) |
| 3.0x to 3.9x | 3 (3.6%) | 23 (35.4%) |
| 4.0x or more | 50 (60.2%) | 16 (24.6%) |
| Total | 83 (100.0%) | 65 (100.0%) |
Real Estate Taxes by Mortgage Status in Glen Park
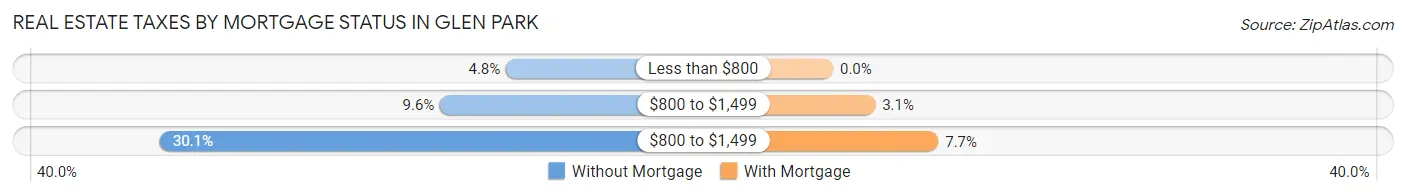
| Property Taxes | Without Mortgage | With Mortgage |
| Less than $800 | 4 (4.8%) | 0 (0.0%) |
| $800 to $1,499 | 8 (9.6%) | 2 (3.1%) |
| $800 to $1,499 | 25 (30.1%) | 5 (7.7%) |
| Total | 83 (100.0%) | 65 (100.0%) |
Health & Disability in Glen Park
Health Insurance Coverage by Age in Glen Park
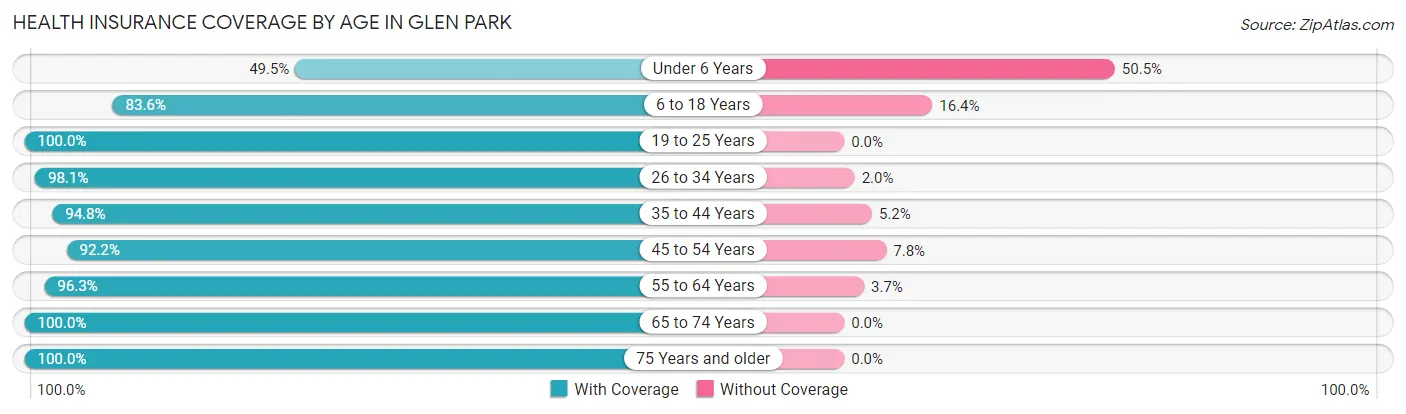
| Age Bracket | With Coverage | Without Coverage |
| Under 6 Years | 54 (49.5%) | 55 (50.5%) |
| 6 to 18 Years | 112 (83.6%) | 22 (16.4%) |
| 19 to 25 Years | 53 (100.0%) | 0 (0.0%) |
| 26 to 34 Years | 151 (98.1%) | 3 (1.9%) |
| 35 to 44 Years | 55 (94.8%) | 3 (5.2%) |
| 45 to 54 Years | 47 (92.2%) | 4 (7.8%) |
| 55 to 64 Years | 52 (96.3%) | 2 (3.7%) |
| 65 to 74 Years | 33 (100.0%) | 0 (0.0%) |
| 75 Years and older | 15 (100.0%) | 0 (0.0%) |
| Total | 572 (86.5%) | 89 (13.5%) |
Health Insurance Coverage by Citizenship Status in Glen Park
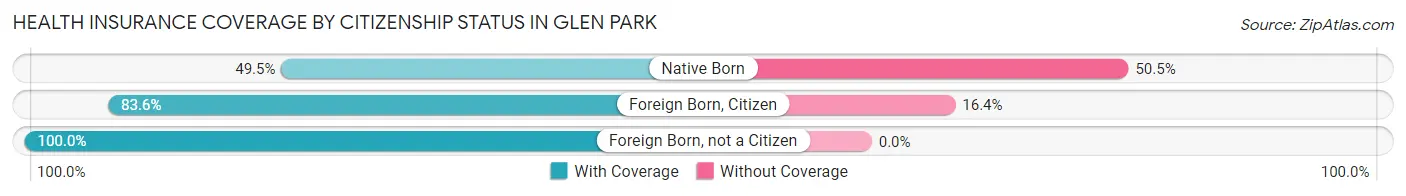
| Citizenship Status | With Coverage | Without Coverage |
| Native Born | 54 (49.5%) | 55 (50.5%) |
| Foreign Born, Citizen | 112 (83.6%) | 22 (16.4%) |
| Foreign Born, not a Citizen | 53 (100.0%) | 0 (0.0%) |
Health Insurance Coverage by Household Income in Glen Park
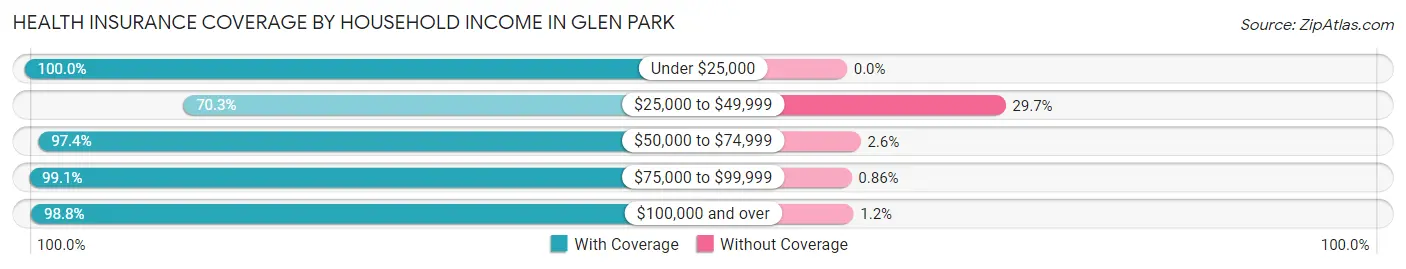
| Household Income | With Coverage | Without Coverage |
| Under $25,000 | 100 (100.0%) | 0 (0.0%) |
| $25,000 to $49,999 | 201 (70.3%) | 85 (29.7%) |
| $50,000 to $74,999 | 76 (97.4%) | 2 (2.6%) |
| $75,000 to $99,999 | 115 (99.1%) | 1 (0.9%) |
| $100,000 and over | 80 (98.8%) | 1 (1.2%) |
Public vs Private Health Insurance Coverage by Age in Glen Park
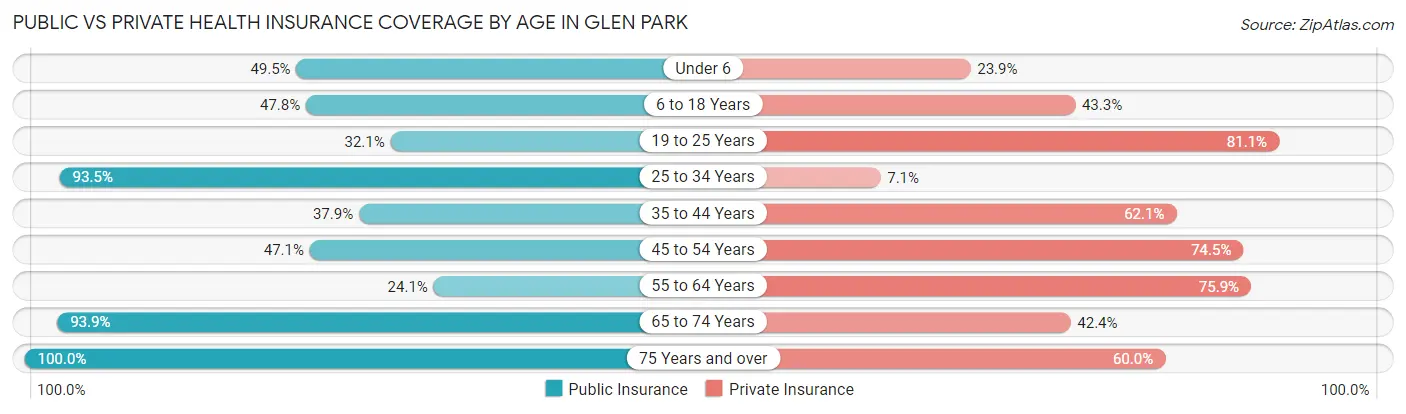
| Age Bracket | Public Insurance | Private Insurance |
| Under 6 | 54 (49.5%) | 26 (23.8%) |
| 6 to 18 Years | 64 (47.8%) | 58 (43.3%) |
| 19 to 25 Years | 17 (32.1%) | 43 (81.1%) |
| 25 to 34 Years | 144 (93.5%) | 11 (7.1%) |
| 35 to 44 Years | 22 (37.9%) | 36 (62.1%) |
| 45 to 54 Years | 24 (47.1%) | 38 (74.5%) |
| 55 to 64 Years | 13 (24.1%) | 41 (75.9%) |
| 65 to 74 Years | 31 (93.9%) | 14 (42.4%) |
| 75 Years and over | 15 (100.0%) | 9 (60.0%) |
| Total | 384 (58.1%) | 276 (41.7%) |
Disability Status by Sex by Age in Glen Park
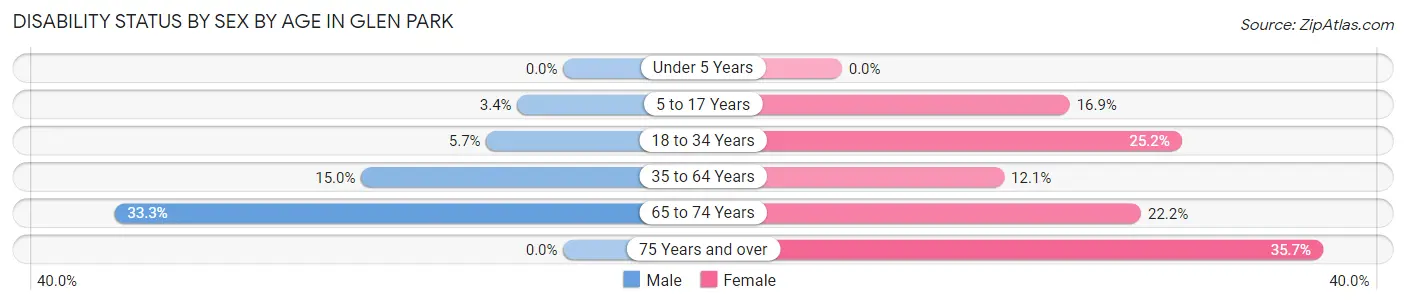
| Age Bracket | Male | Female |
| Under 5 Years | 0 (0.0%) | 0 (0.0%) |
| 5 to 17 Years | 3 (3.4%) | 11 (16.9%) |
| 18 to 34 Years | 6 (5.7%) | 29 (25.2%) |
| 35 to 64 Years | 12 (15.0%) | 10 (12.0%) |
| 65 to 74 Years | 5 (33.3%) | 4 (22.2%) |
| 75 Years and over | 0 (0.0%) | 5 (35.7%) |
Disability Class by Sex by Age in Glen Park
Disability Class: Hearing Difficulty
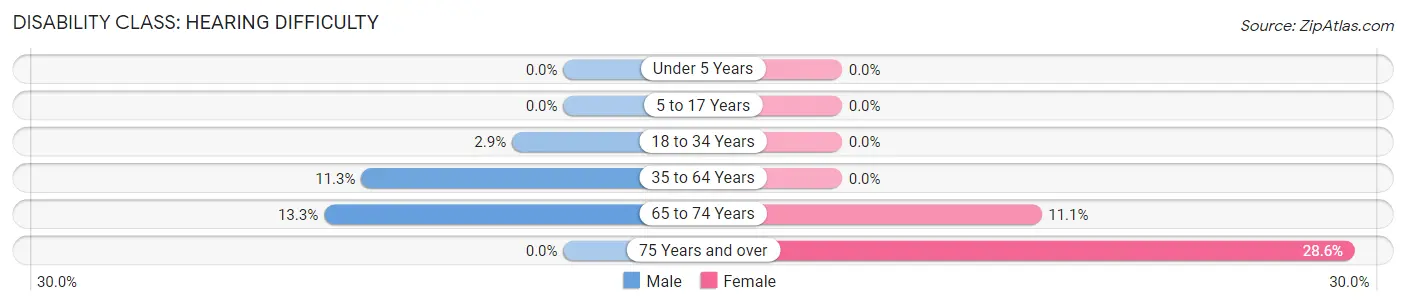
| Age Bracket | Male | Female |
| Under 5 Years | 0 (0.0%) | 0 (0.0%) |
| 5 to 17 Years | 0 (0.0%) | 0 (0.0%) |
| 18 to 34 Years | 3 (2.9%) | 0 (0.0%) |
| 35 to 64 Years | 9 (11.3%) | 0 (0.0%) |
| 65 to 74 Years | 2 (13.3%) | 2 (11.1%) |
| 75 Years and over | 0 (0.0%) | 4 (28.6%) |
Disability Class: Vision Difficulty
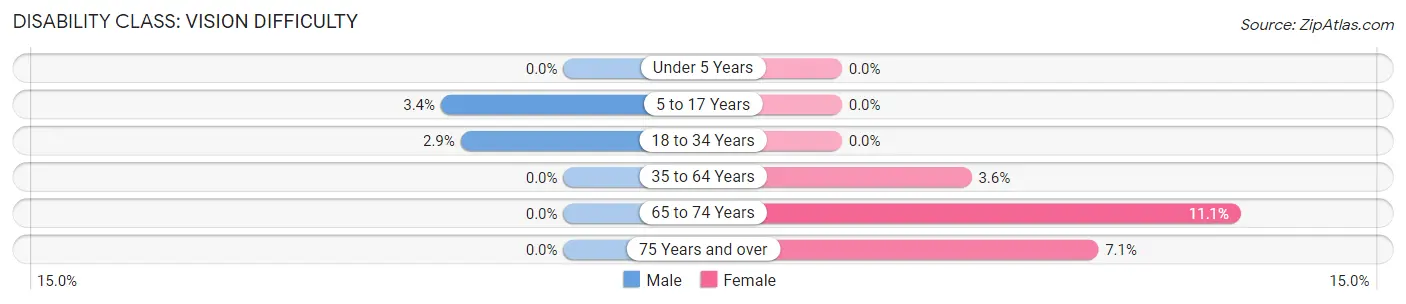
| Age Bracket | Male | Female |
| Under 5 Years | 0 (0.0%) | 0 (0.0%) |
| 5 to 17 Years | 3 (3.4%) | 0 (0.0%) |
| 18 to 34 Years | 3 (2.9%) | 0 (0.0%) |
| 35 to 64 Years | 0 (0.0%) | 3 (3.6%) |
| 65 to 74 Years | 0 (0.0%) | 2 (11.1%) |
| 75 Years and over | 0 (0.0%) | 1 (7.1%) |
Disability Class: Cognitive Difficulty
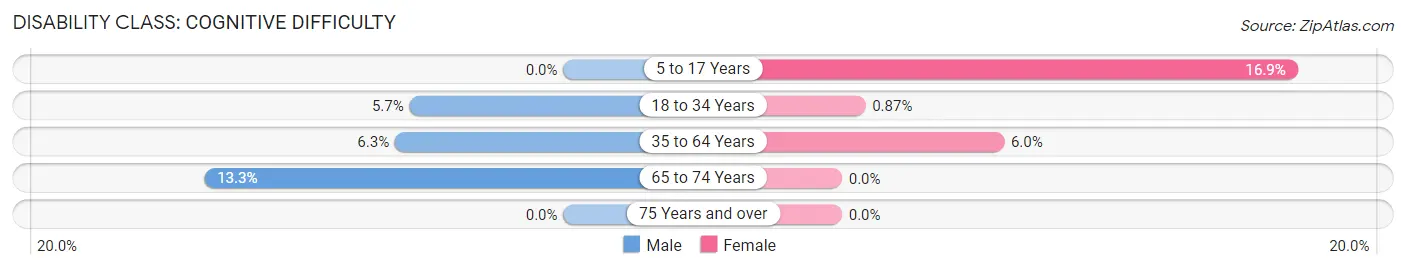
| Age Bracket | Male | Female |
| 5 to 17 Years | 0 (0.0%) | 11 (16.9%) |
| 18 to 34 Years | 6 (5.7%) | 1 (0.9%) |
| 35 to 64 Years | 5 (6.2%) | 5 (6.0%) |
| 65 to 74 Years | 2 (13.3%) | 0 (0.0%) |
| 75 Years and over | 0 (0.0%) | 0 (0.0%) |
Disability Class: Ambulatory Difficulty
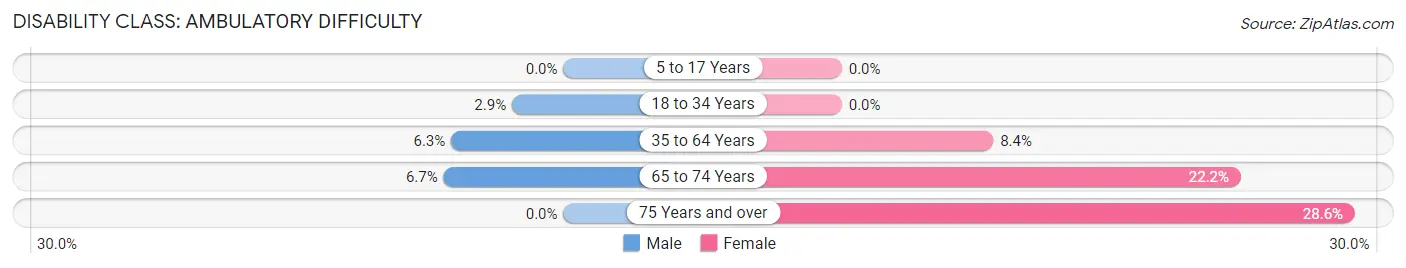
| Age Bracket | Male | Female |
| 5 to 17 Years | 0 (0.0%) | 0 (0.0%) |
| 18 to 34 Years | 3 (2.9%) | 0 (0.0%) |
| 35 to 64 Years | 5 (6.2%) | 7 (8.4%) |
| 65 to 74 Years | 1 (6.7%) | 4 (22.2%) |
| 75 Years and over | 0 (0.0%) | 4 (28.6%) |
Disability Class: Self-Care Difficulty
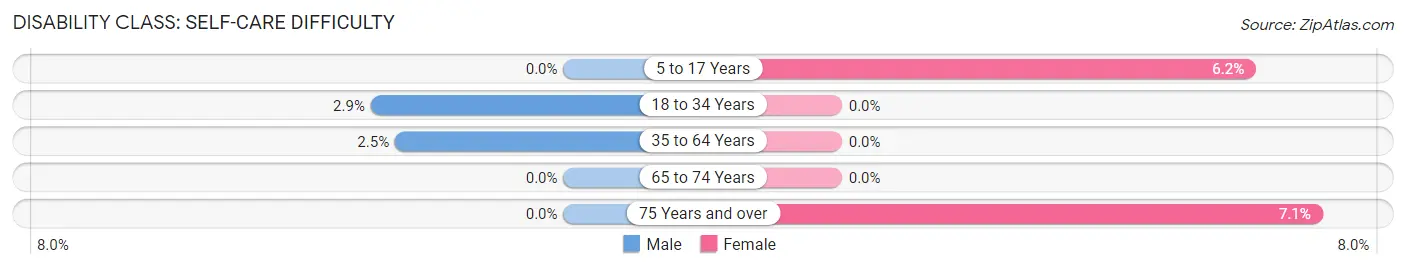
| Age Bracket | Male | Female |
| 5 to 17 Years | 0 (0.0%) | 4 (6.1%) |
| 18 to 34 Years | 3 (2.9%) | 0 (0.0%) |
| 35 to 64 Years | 2 (2.5%) | 0 (0.0%) |
| 65 to 74 Years | 0 (0.0%) | 0 (0.0%) |
| 75 Years and over | 0 (0.0%) | 1 (7.1%) |
Technology Access in Glen Park
Computing Device Access in Glen Park
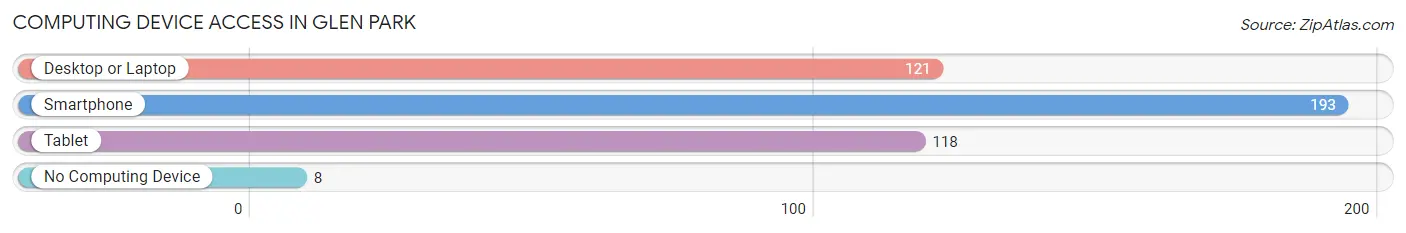
| Device Type | # Households | % Households |
| Desktop or Laptop | 121 | 56.0% |
| Smartphone | 193 | 89.3% |
| Tablet | 118 | 54.6% |
| No Computing Device | 8 | 3.7% |
| Total | 216 | 100.0% |
Internet Access in Glen Park
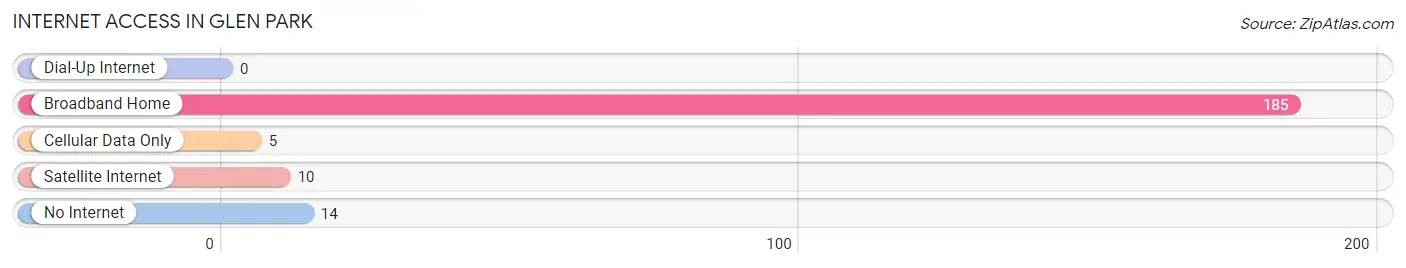
| Internet Type | # Households | % Households |
| Dial-Up Internet | 0 | 0.0% |
| Broadband Home | 185 | 85.7% |
| Cellular Data Only | 5 | 2.3% |
| Satellite Internet | 10 | 4.6% |
| No Internet | 14 | 6.5% |
| Total | 216 | 100.0% |
Glen Park Summary
Glen Park is a small hamlet located in the town of Glen, New York, in the United States. It is situated in the foothills of the Adirondack Mountains, approximately 25 miles north of Albany. The hamlet is home to a population of approximately 1,000 people, and is a popular destination for outdoor recreation and relaxation.
History
Glen Park was first settled in the late 1700s by a group of settlers from Scotland. The settlers were attracted to the area due to its abundance of natural resources, including timber, water, and fertile soil. The settlers established a small farming community, and the hamlet was officially incorporated in 1820.
In the late 1800s, the hamlet began to grow and develop as a tourist destination. The Adirondack Mountains provided a picturesque backdrop for visitors, and the hamlet was home to several resorts and hotels. The hamlet also became a popular destination for outdoor recreation, such as fishing, hunting, and camping.
In the early 1900s, the hamlet began to experience a decline in population as many of the residents moved away in search of better economic opportunities. However, the hamlet has experienced a resurgence in recent years, as more people have moved to the area in search of a rural lifestyle.
Geography
Glen Park is located in the foothills of the Adirondack Mountains, approximately 25 miles north of Albany. The hamlet is situated in a valley, surrounded by rolling hills and forests. The hamlet is home to several small lakes, including Lake George, Lake Placid, and Lake Champlain.
The hamlet is located in a temperate climate, with warm summers and cold winters. The average temperature in the summer is around 70 degrees Fahrenheit, and the average temperature in the winter is around 20 degrees Fahrenheit.
Economy
The economy of Glen Park is largely based on tourism and outdoor recreation. The hamlet is home to several resorts and hotels, as well as a variety of outdoor activities, such as fishing, hunting, and camping. The hamlet is also home to several small businesses, including restaurants, shops, and galleries.
Demographics
As of the 2010 census, the population of Glen Park was 1,000 people. The population is largely white (94.2%), with a small percentage of African Americans (2.2%) and Hispanics (2.2%). The median household income is $45,000, and the median age is 44 years.
Conclusion
Glen Park is a small hamlet located in the foothills of the Adirondack Mountains in New York. The hamlet is home to a population of approximately 1,000 people, and is a popular destination for outdoor recreation and relaxation. The economy of the hamlet is largely based on tourism and outdoor recreation, and the population is largely white.
Common Questions
What is Per Capita Income in Glen Park?
Per Capita income in Glen Park is $21,951.
What is the Median Household income in Glen Park?
Median Household Income in Glen Park is $35,000.
What is Inequality or Gini Index in Glen Park?
Inequality or Gini Index in Glen Park is 0.46.
What is the Total Population of Glen Park?
Total Population of Glen Park is 661.
What is the Total Male Population of Glen Park?
Total Male Population of Glen Park is 349.
What is the Total Female Population of Glen Park?
Total Female Population of Glen Park is 312.
What is the Ratio of Males per 100 Females in Glen Park?
There are 111.86 Males per 100 Females in Glen Park.
What is the Ratio of Females per 100 Males in Glen Park?
There are 89.40 Females per 100 Males in Glen Park.
What is the Median Population Age in Glen Park?
Median Population Age in Glen Park is 28.4 Years.
What is the Average Family Size in Glen Park
Average Family Size in Glen Park is 3.1 People.
What is the Average Household Size in Glen Park
Average Household Size in Glen Park is 3.1 People.
How Large is the Labor Force in Glen Park?
There are 321 People in the Labor Forcein in Glen Park.
What is the Percentage of People in the Labor Force in Glen Park?
71.7% of People are in the Labor Force in Glen Park.
What is the Unemployment Rate in Glen Park?
Unemployment Rate in Glen Park is 4.4%.