Cities with the Most Immigrants from Uruguay in New York
RELATED REPORTS & OPTIONS
Uruguay
New York
Compare Cities
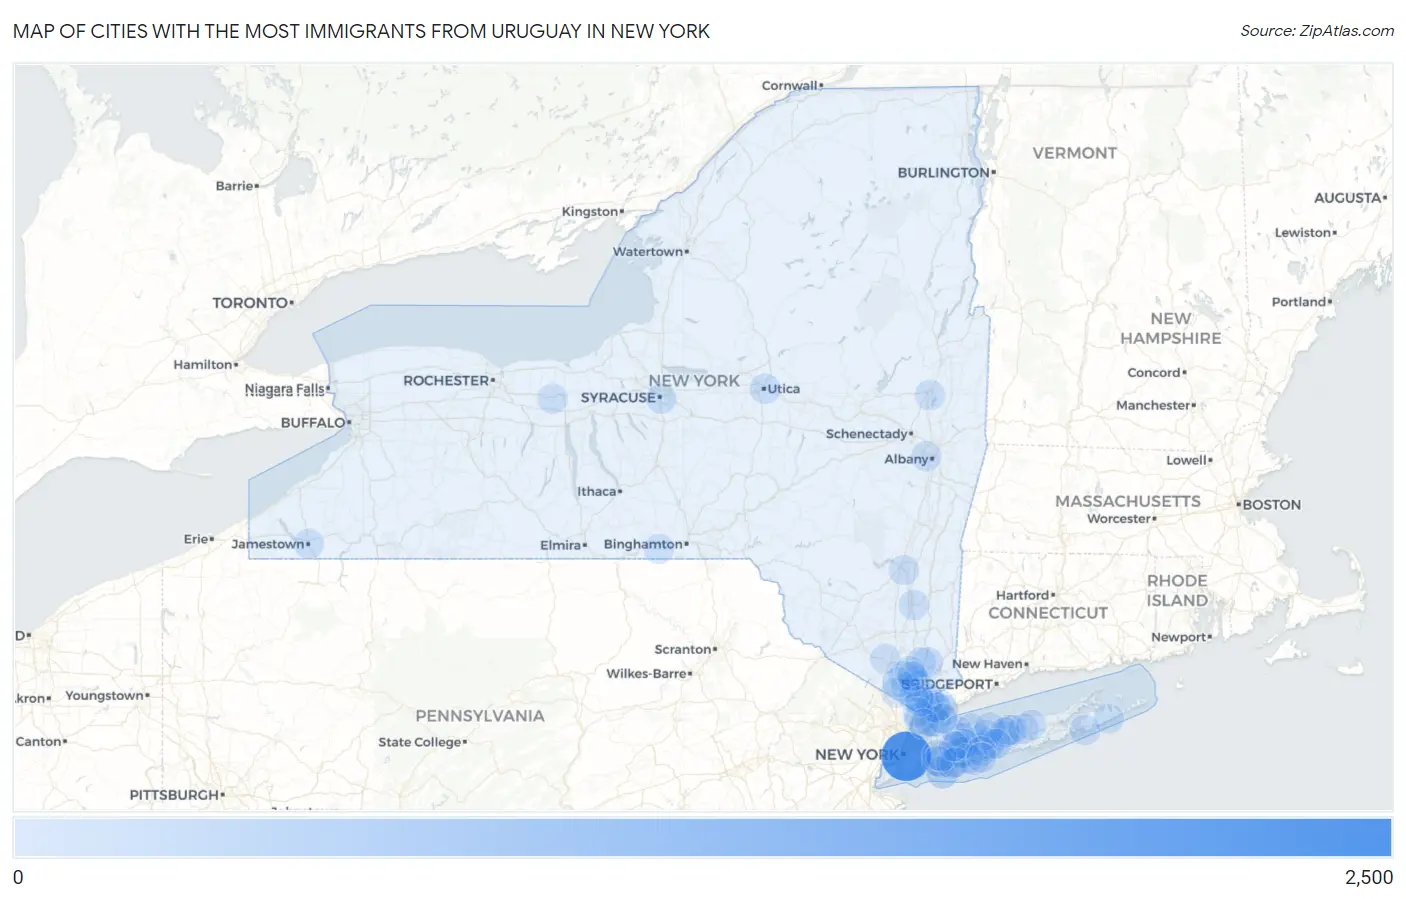
Map of Cities with the Most Immigrants from Uruguay in New York
0
2,500
Cities with the Most Immigrants from Uruguay in New York
| City | Uruguay | vs State | vs National | |
| 1. | New York | 2,402 | 5,566(43.15%)#1 | 51,485(4.67%)#1 |
| 2. | Long Beach | 242 | 5,566(4.35%)#2 | 51,485(0.47%)#26 |
| 3. | Yonkers | 184 | 5,566(3.31%)#3 | 51,485(0.36%)#40 |
| 4. | Ossining | 146 | 5,566(2.62%)#4 | 51,485(0.28%)#55 |
| 5. | Lynbrook | 140 | 5,566(2.52%)#5 | 51,485(0.27%)#59 |
| 6. | White Plains | 122 | 5,566(2.19%)#6 | 51,485(0.24%)#71 |
| 7. | Port Chester | 120 | 5,566(2.16%)#7 | 51,485(0.23%)#72 |
| 8. | Syosset | 109 | 5,566(1.96%)#8 | 51,485(0.21%)#79 |
| 9. | Mamaroneck | 102 | 5,566(1.83%)#9 | 51,485(0.20%)#89 |
| 10. | New Rochelle | 94 | 5,566(1.69%)#10 | 51,485(0.18%)#96 |
| 11. | Levittown | 90 | 5,566(1.62%)#11 | 51,485(0.17%)#101 |
| 12. | Jefferson Valley Yorktown | 82 | 5,566(1.47%)#12 | 51,485(0.16%)#112 |
| 13. | Elmont | 53 | 5,566(0.95%)#13 | 51,485(0.10%)#181 |
| 14. | Lake Ronkonkoma | 52 | 5,566(0.93%)#14 | 51,485(0.10%)#185 |
| 15. | Rye Brook | 49 | 5,566(0.88%)#15 | 51,485(0.10%)#195 |
| 16. | Southampton | 48 | 5,566(0.86%)#16 | 51,485(0.09%)#197 |
| 17. | Utica | 45 | 5,566(0.81%)#17 | 51,485(0.09%)#209 |
| 18. | North Bay Shore | 45 | 5,566(0.81%)#18 | 51,485(0.09%)#212 |
| 19. | Brentwood | 44 | 5,566(0.79%)#19 | 51,485(0.09%)#217 |
| 20. | Valhalla | 41 | 5,566(0.74%)#20 | 51,485(0.08%)#231 |
| 21. | Dix Hills | 38 | 5,566(0.68%)#21 | 51,485(0.07%)#246 |
| 22. | Plainedge | 35 | 5,566(0.63%)#22 | 51,485(0.07%)#266 |
| 23. | Huntington | 34 | 5,566(0.61%)#23 | 51,485(0.07%)#274 |
| 24. | Stony Point | 31 | 5,566(0.56%)#24 | 51,485(0.06%)#293 |
| 25. | Valley Stream | 30 | 5,566(0.54%)#25 | 51,485(0.06%)#301 |
| 26. | Freeport | 29 | 5,566(0.52%)#26 | 51,485(0.06%)#309 |
| 27. | Copiague | 29 | 5,566(0.52%)#27 | 51,485(0.06%)#312 |
| 28. | Oyster Bay | 29 | 5,566(0.52%)#28 | 51,485(0.06%)#316 |
| 29. | Centereach | 28 | 5,566(0.50%)#29 | 51,485(0.05%)#318 |
| 30. | Syracuse | 26 | 5,566(0.47%)#30 | 51,485(0.05%)#330 |
| 31. | Hicksville | 25 | 5,566(0.45%)#31 | 51,485(0.05%)#341 |
| 32. | Croton On Hudson | 25 | 5,566(0.45%)#32 | 51,485(0.05%)#344 |
| 33. | Harrison | 24 | 5,566(0.43%)#33 | 51,485(0.05%)#348 |
| 34. | Middle Island | 24 | 5,566(0.43%)#34 | 51,485(0.05%)#351 |
| 35. | Rye | 23 | 5,566(0.41%)#35 | 51,485(0.04%)#355 |
| 36. | Commack | 22 | 5,566(0.40%)#36 | 51,485(0.04%)#360 |
| 37. | East Massapequa | 22 | 5,566(0.40%)#37 | 51,485(0.04%)#362 |
| 38. | Plainview | 21 | 5,566(0.38%)#38 | 51,485(0.04%)#373 |
| 39. | Sleepy Hollow | 19 | 5,566(0.34%)#39 | 51,485(0.04%)#404 |
| 40. | Selden | 18 | 5,566(0.32%)#40 | 51,485(0.03%)#419 |
| 41. | Merrick | 17 | 5,566(0.31%)#41 | 51,485(0.03%)#440 |
| 42. | Kings Park | 16 | 5,566(0.29%)#42 | 51,485(0.03%)#453 |
| 43. | Monsey | 15 | 5,566(0.27%)#43 | 51,485(0.03%)#465 |
| 44. | Nyack | 15 | 5,566(0.27%)#44 | 51,485(0.03%)#474 |
| 45. | Lake Mohegan | 15 | 5,566(0.27%)#45 | 51,485(0.03%)#475 |
| 46. | Franklin Square | 14 | 5,566(0.25%)#46 | 51,485(0.03%)#488 |
| 47. | Albany | 10 | 5,566(0.18%)#47 | 51,485(0.02%)#579 |
| 48. | Kiryas Joel | 10 | 5,566(0.18%)#48 | 51,485(0.02%)#588 |
| 49. | Jamestown | 10 | 5,566(0.18%)#49 | 51,485(0.02%)#590 |
| 50. | North Babylon | 10 | 5,566(0.18%)#50 | 51,485(0.02%)#593 |
| 51. | Lake Grove | 10 | 5,566(0.18%)#51 | 51,485(0.02%)#597 |
| 52. | New City | 9 | 5,566(0.16%)#52 | 51,485(0.02%)#617 |
| 53. | Hastings On Hudson | 9 | 5,566(0.16%)#53 | 51,485(0.02%)#621 |
| 54. | Carmel | 9 | 5,566(0.16%)#54 | 51,485(0.02%)#623 |
| 55. | Central Islip | 8 | 5,566(0.14%)#55 | 51,485(0.02%)#642 |
| 56. | Poughkeepsie | 8 | 5,566(0.14%)#56 | 51,485(0.02%)#644 |
| 57. | Kingston | 7 | 5,566(0.13%)#57 | 51,485(0.01%)#668 |
| 58. | Ridge | 7 | 5,566(0.13%)#58 | 51,485(0.01%)#676 |
| 59. | New Cassel | 6 | 5,566(0.11%)#59 | 51,485(0.01%)#695 |
| 60. | Babylon | 6 | 5,566(0.11%)#60 | 51,485(0.01%)#698 |
| 61. | Tarrytown | 5 | 5,566(0.09%)#61 | 51,485(0.01%)#712 |
| 62. | Pomona | 5 | 5,566(0.09%)#62 | 51,485(0.01%)#716 |
| 63. | Buchanan | 5 | 5,566(0.09%)#63 | 51,485(0.01%)#717 |
| 64. | Crugers | 5 | 5,566(0.09%)#64 | 51,485(0.01%)#720 |
| 65. | Mount Vernon | 4 | 5,566(0.07%)#65 | 51,485(0.01%)#725 |
| 66. | East Hampton | 4 | 5,566(0.07%)#66 | 51,485(0.01%)#735 |
| 67. | Saratoga Springs | 3 | 5,566(0.05%)#67 | 51,485(0.01%)#745 |
| 68. | Newark | 2 | 5,566(0.04%)#68 | 51,485(0.00%)#757 |
| 69. | Apalachin | 1 | 5,566(0.02%)#69 | 51,485(0.00%)#770 |
Common Questions
What are the Top 10 Cities with the Most Immigrants from Uruguay in New York?
Top 10 Cities with the Most Immigrants from Uruguay in New York are:
#1
2,402
#2
242
#3
184
#4
146
#5
140
#6
122
#7
120
#8
109
#9
102
#10
94
What city has the Most Immigrants from Uruguay in New York?
New York has the Most Immigrants from Uruguay in New York with 2,402.
What is the Total Immigrants from Uruguay in the State of New York?
Total Immigrants from Uruguay in New York is 5,566.
What is the Total Immigrants from Uruguay in the United States?
Total Immigrants from Uruguay in the United States is 51,485.