Zip Codes with the Highest Percentage of Population Employed in Food Preparation & Serving in Ithaca, NY
RELATED REPORTS & OPTIONS
Food Preparation & Serving
Ithaca
Compare Zip Codes
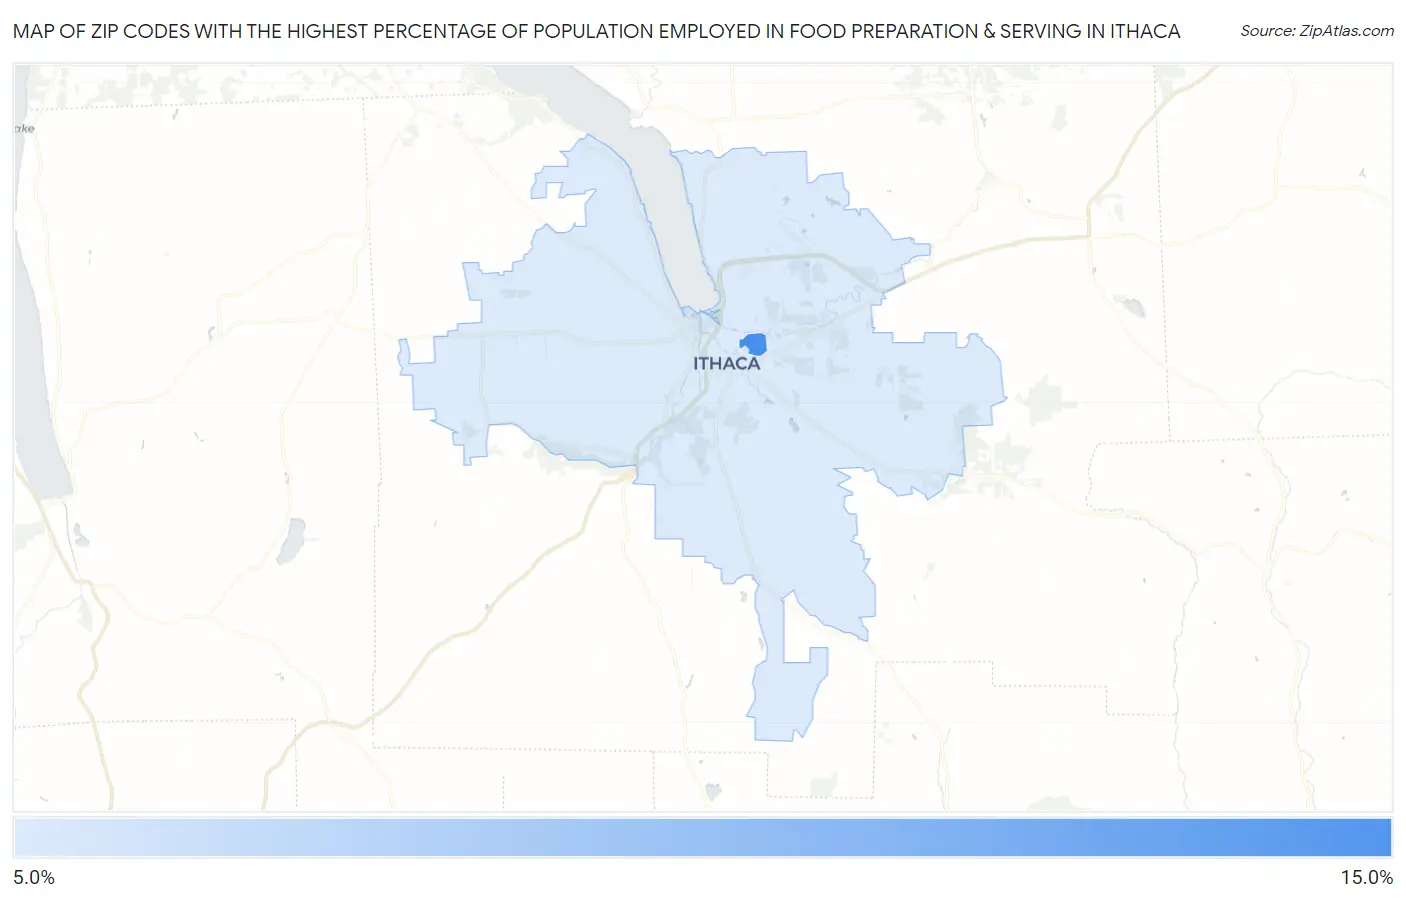
Map of Zip Codes with the Highest Percentage of Population Employed in Food Preparation & Serving in Ithaca
7.0%
13.1%
Zip Codes with the Highest Percentage of Population Employed in Food Preparation & Serving in Ithaca, NY
| Zip Code | % Employed | vs State | vs National | |
| 1. | 14853 | 13.1% | 4.8%(+8.27)#75 | 5.3%(+7.80)#1,371 |
| 2. | 14850 | 7.0% | 4.8%(+2.21)#326 | 5.3%(+1.74)#6,498 |
1
Common Questions
What are the Top Zip Codes with the Highest Percentage of Population Employed in Food Preparation & Serving in Ithaca, NY?
Top Zip Codes with the Highest Percentage of Population Employed in Food Preparation & Serving in Ithaca, NY are:
What zip code has the Highest Percentage of Population Employed in Food Preparation & Serving in Ithaca, NY?
14853 has the Highest Percentage of Population Employed in Food Preparation & Serving in Ithaca, NY with 13.1%.
What is the Percentage of Population Employed in Food Preparation & Serving in Ithaca, NY?
Percentage of Population Employed in Food Preparation & Serving in Ithaca is 10.5%.
What is the Percentage of Population Employed in Food Preparation & Serving in New York?
Percentage of Population Employed in Food Preparation & Serving in New York is 4.8%.
What is the Percentage of Population Employed in Food Preparation & Serving in the United States?
Percentage of Population Employed in Food Preparation & Serving in the United States is 5.3%.