Cities with the Highest Percentage of Spanish Population in New York
RELATED REPORTS & OPTIONS
Spanish
New York
Compare Cities
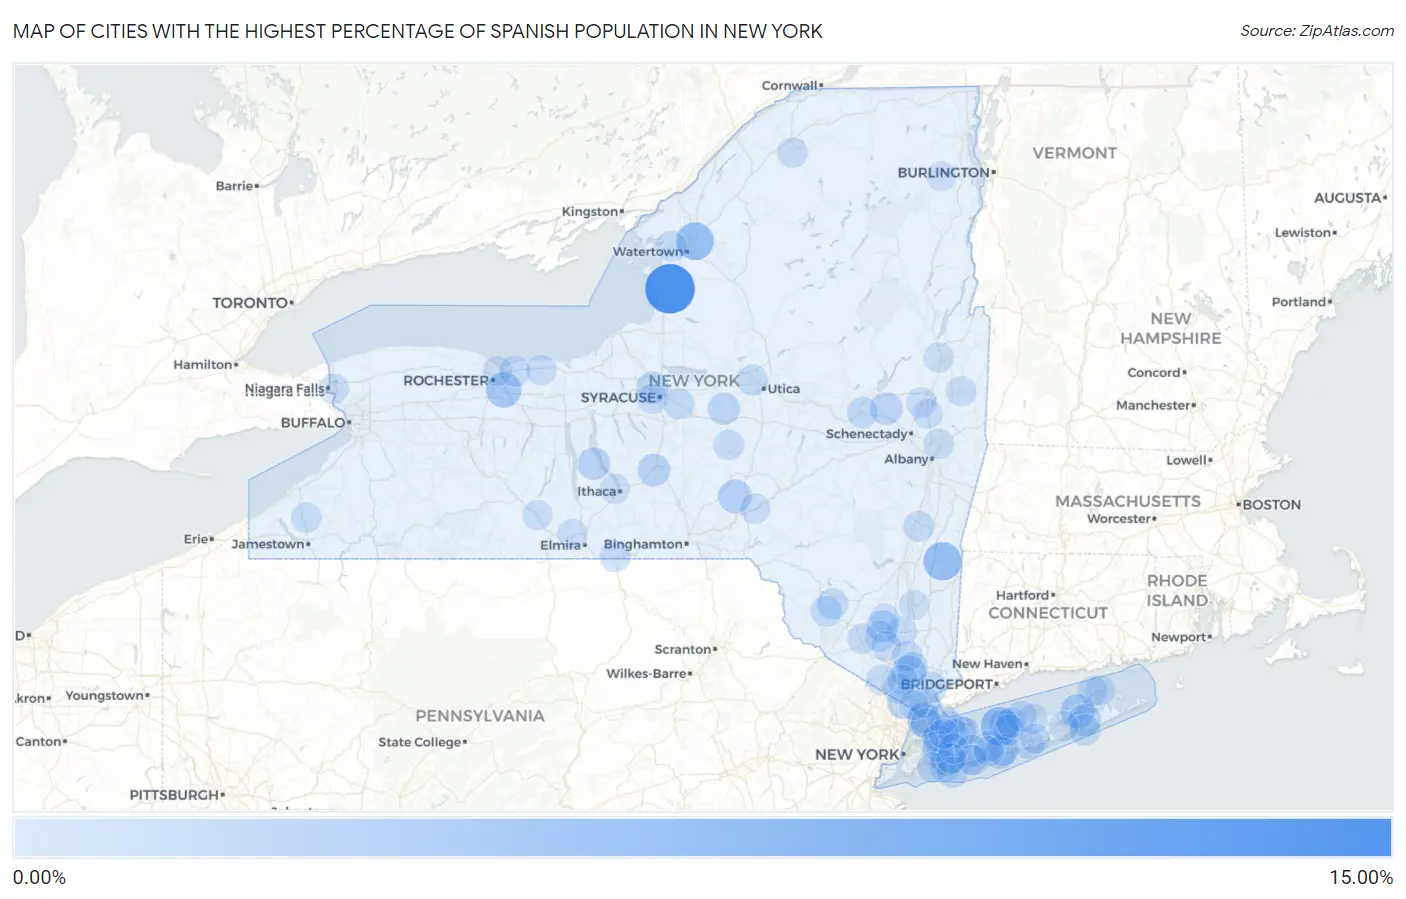
Map of Cities with the Highest Percentage of Spanish Population in New York
0.00%
15.00%
Cities with the Highest Percentage of Spanish Population in New York
| City | Spanish | vs State | vs National | |
| 1. | Pierrepont Manor | 12.47% | 0.17%(+12.3)#1 | 0.23%(+12.2)#108 |
| 2. | Head Of The Harbor | 5.60% | 0.17%(+5.43)#2 | 0.23%(+5.36)#254 |
| 3. | Pine Plains | 5.33% | 0.17%(+5.17)#3 | 0.23%(+5.10)#264 |
| 4. | Calcium | 5.11% | 0.17%(+4.94)#4 | 0.23%(+4.87)#278 |
| 5. | Pittsford | 3.59% | 0.17%(+3.42)#5 | 0.23%(+3.35)#392 |
| 6. | Verplanck | 3.02% | 0.17%(+2.85)#6 | 0.23%(+2.78)#463 |
| 7. | New Suffolk | 2.95% | 0.17%(+2.78)#7 | 0.23%(+2.72)#474 |
| 8. | South Hempstead | 2.62% | 0.17%(+2.45)#8 | 0.23%(+2.38)#534 |
| 9. | Guilford | 2.52% | 0.17%(+2.35)#9 | 0.23%(+2.28)#558 |
| 10. | Bronxville | 2.34% | 0.17%(+2.18)#10 | 0.23%(+2.11)#590 |
| 11. | Pearl River | 2.20% | 0.17%(+2.03)#11 | 0.23%(+1.96)#621 |
| 12. | Munsons Corners | 2.09% | 0.17%(+1.92)#12 | 0.23%(+1.86)#647 |
| 13. | Great River | 2.01% | 0.17%(+1.84)#13 | 0.23%(+1.77)#668 |
| 14. | Interlaken | 1.99% | 0.17%(+1.82)#14 | 0.23%(+1.75)#673 |
| 15. | North Sea | 1.92% | 0.17%(+1.75)#15 | 0.23%(+1.68)#701 |
| 16. | Hagaman | 1.90% | 0.17%(+1.74)#16 | 0.23%(+1.67)#707 |
| 17. | Oyster Bay Cove | 1.85% | 0.17%(+1.69)#17 | 0.23%(+1.62)#726 |
| 18. | East Farmingdale | 1.79% | 0.17%(+1.62)#18 | 0.23%(+1.55)#742 |
| 19. | Liverpool | 1.76% | 0.17%(+1.59)#19 | 0.23%(+1.52)#749 |
| 20. | Greenville Cdp Greene County | 1.74% | 0.17%(+1.58)#20 | 0.23%(+1.51)#757 |
| 21. | Munnsville | 1.74% | 0.17%(+1.58)#21 | 0.23%(+1.51)#758 |
| 22. | New Hackensack | 1.73% | 0.17%(+1.56)#22 | 0.23%(+1.50)#762 |
| 23. | Walden | 1.60% | 0.17%(+1.44)#23 | 0.23%(+1.37)#814 |
| 24. | Laurel Hollow | 1.56% | 0.17%(+1.39)#24 | 0.23%(+1.33)#839 |
| 25. | Floral Park | 1.53% | 0.17%(+1.36)#25 | 0.23%(+1.29)#855 |
| 26. | Lake Huntington | 1.48% | 0.17%(+1.31)#26 | 0.23%(+1.24)#887 |
| 27. | Oakdale | 1.44% | 0.17%(+1.27)#27 | 0.23%(+1.20)#898 |
| 28. | East Herkimer | 1.39% | 0.17%(+1.22)#28 | 0.23%(+1.15)#924 |
| 29. | Chappaqua | 1.35% | 0.17%(+1.19)#29 | 0.23%(+1.12)#953 |
| 30. | Baxter Estates | 1.31% | 0.17%(+1.14)#30 | 0.23%(+1.07)#990 |
| 31. | Tuckahoe | 1.23% | 0.17%(+1.06)#31 | 0.23%(+0.995)#1,053 |
| 32. | Southampton | 1.23% | 0.17%(+1.06)#32 | 0.23%(+0.993)#1,054 |
| 33. | Fultonville | 1.19% | 0.17%(+1.03)#33 | 0.23%(+0.960)#1,087 |
| 34. | South Fallsburg | 1.19% | 0.17%(+1.02)#34 | 0.23%(+0.952)#1,094 |
| 35. | Oceanside | 1.17% | 0.17%(+1.01)#35 | 0.23%(+0.937)#1,106 |
| 36. | North Bay Shore | 1.16% | 0.17%(+0.992)#36 | 0.23%(+0.924)#1,120 |
| 37. | Greenville Cdp Westchester County | 1.16% | 0.17%(+0.992)#37 | 0.23%(+0.924)#1,121 |
| 38. | Waverly | 1.15% | 0.17%(+0.981)#38 | 0.23%(+0.912)#1,130 |
| 39. | Peekskill | 1.13% | 0.17%(+0.960)#39 | 0.23%(+0.891)#1,150 |
| 40. | Monticello | 1.12% | 0.17%(+0.955)#40 | 0.23%(+0.887)#1,156 |
| 41. | Oriskany | 1.08% | 0.17%(+0.916)#41 | 0.23%(+0.848)#1,199 |
| 42. | Webster | 1.07% | 0.17%(+0.899)#42 | 0.23%(+0.831)#1,214 |
| 43. | Chelsea Cove | 1.05% | 0.17%(+0.888)#43 | 0.23%(+0.820)#1,228 |
| 44. | Maybrook | 1.05% | 0.17%(+0.887)#44 | 0.23%(+0.818)#1,229 |
| 45. | Highland-On-The-Lake | 1.05% | 0.17%(+0.884)#45 | 0.23%(+0.816)#1,230 |
| 46. | Elmsford | 1.04% | 0.17%(+0.874)#46 | 0.23%(+0.806)#1,242 |
| 47. | Stony Brook | 1.04% | 0.17%(+0.874)#47 | 0.23%(+0.805)#1,243 |
| 48. | Manlius | 1.01% | 0.17%(+0.839)#48 | 0.23%(+0.771)#1,289 |
| 49. | Catskill | 0.99% | 0.17%(+0.826)#49 | 0.23%(+0.758)#1,302 |
| 50. | Point Lookout | 0.99% | 0.17%(+0.825)#50 | 0.23%(+0.756)#1,303 |
| 51. | Plandome Heights | 0.96% | 0.17%(+0.793)#51 | 0.23%(+0.725)#1,351 |
| 52. | Earlville | 0.95% | 0.17%(+0.788)#52 | 0.23%(+0.719)#1,359 |
| 53. | Sound Beach | 0.95% | 0.17%(+0.784)#53 | 0.23%(+0.716)#1,362 |
| 54. | Brookhaven | 0.94% | 0.17%(+0.773)#54 | 0.23%(+0.704)#1,375 |
| 55. | Dexter | 0.92% | 0.17%(+0.751)#55 | 0.23%(+0.683)#1,409 |
| 56. | Centereach | 0.91% | 0.17%(+0.747)#56 | 0.23%(+0.678)#1,418 |
| 57. | Hannawa Falls | 0.90% | 0.17%(+0.731)#57 | 0.23%(+0.662)#1,446 |
| 58. | Copiague | 0.90% | 0.17%(+0.730)#58 | 0.23%(+0.661)#1,448 |
| 59. | Highland Falls | 0.89% | 0.17%(+0.721)#59 | 0.23%(+0.653)#1,458 |
| 60. | New Hempstead | 0.88% | 0.17%(+0.715)#60 | 0.23%(+0.646)#1,468 |
| 61. | Thiells | 0.87% | 0.17%(+0.702)#61 | 0.23%(+0.634)#1,491 |
| 62. | Pelham | 0.87% | 0.17%(+0.702)#62 | 0.23%(+0.633)#1,492 |
| 63. | Tuxedo Park | 0.86% | 0.17%(+0.691)#63 | 0.23%(+0.623)#1,503 |
| 64. | Sinclairville | 0.84% | 0.17%(+0.674)#64 | 0.23%(+0.606)#1,530 |
| 65. | Lattingtown | 0.83% | 0.17%(+0.668)#65 | 0.23%(+0.599)#1,542 |
| 66. | Williamson | 0.78% | 0.17%(+0.615)#66 | 0.23%(+0.547)#1,630 |
| 67. | Lake Success | 0.78% | 0.17%(+0.613)#67 | 0.23%(+0.544)#1,638 |
| 68. | Port Jefferson Station | 0.78% | 0.17%(+0.612)#68 | 0.23%(+0.543)#1,641 |
| 69. | East Marion | 0.77% | 0.17%(+0.601)#69 | 0.23%(+0.533)#1,660 |
| 70. | Balmville | 0.77% | 0.17%(+0.601)#70 | 0.23%(+0.532)#1,662 |
| 71. | Ballston Spa | 0.74% | 0.17%(+0.571)#71 | 0.23%(+0.503)#1,710 |
| 72. | Greenwich | 0.71% | 0.17%(+0.549)#72 | 0.23%(+0.480)#1,750 |
| 73. | Amityville | 0.70% | 0.17%(+0.539)#73 | 0.23%(+0.470)#1,767 |
| 74. | Wallkill | 0.70% | 0.17%(+0.533)#74 | 0.23%(+0.465)#1,783 |
| 75. | Scotchtown | 0.69% | 0.17%(+0.520)#75 | 0.23%(+0.451)#1,801 |
| 76. | East Shoreham | 0.68% | 0.17%(+0.513)#76 | 0.23%(+0.444)#1,814 |
| 77. | Westvale | 0.67% | 0.17%(+0.503)#77 | 0.23%(+0.434)#1,845 |
| 78. | Inwood | 0.66% | 0.17%(+0.497)#78 | 0.23%(+0.429)#1,858 |
| 79. | Upper Brookville | 0.64% | 0.17%(+0.472)#79 | 0.23%(+0.404)#1,921 |
| 80. | Unadilla | 0.63% | 0.17%(+0.469)#80 | 0.23%(+0.400)#1,926 |
| 81. | Niagara Falls | 0.63% | 0.17%(+0.461)#81 | 0.23%(+0.392)#1,948 |
| 82. | Mastic | 0.61% | 0.17%(+0.449)#82 | 0.23%(+0.380)#1,979 |
| 83. | Green Island | 0.61% | 0.17%(+0.440)#83 | 0.23%(+0.372)#2,005 |
| 84. | Savona | 0.59% | 0.17%(+0.428)#84 | 0.23%(+0.360)#2,039 |
| 85. | Washingtonville | 0.59% | 0.17%(+0.427)#85 | 0.23%(+0.359)#2,046 |
| 86. | Flanders | 0.58% | 0.17%(+0.411)#86 | 0.23%(+0.343)#2,093 |
| 87. | Orient | 0.57% | 0.17%(+0.408)#87 | 0.23%(+0.339)#2,101 |
| 88. | Salisbury | 0.57% | 0.17%(+0.402)#88 | 0.23%(+0.333)#2,119 |
| 89. | Poughkeepsie | 0.56% | 0.17%(+0.398)#89 | 0.23%(+0.330)#2,127 |
| 90. | Piermont | 0.56% | 0.17%(+0.392)#90 | 0.23%(+0.324)#2,139 |
| 91. | Northwest Ithaca | 0.56% | 0.17%(+0.391)#91 | 0.23%(+0.322)#2,146 |
| 92. | Roosevelt | 0.56% | 0.17%(+0.390)#92 | 0.23%(+0.322)#2,148 |
| 93. | West Glens Falls | 0.55% | 0.17%(+0.388)#93 | 0.23%(+0.320)#2,153 |
| 94. | Rye | 0.55% | 0.17%(+0.387)#94 | 0.23%(+0.319)#2,156 |
| 95. | Au Sable Forks | 0.51% | 0.17%(+0.342)#95 | 0.23%(+0.274)#2,284 |
| 96. | Big Flats | 0.50% | 0.17%(+0.330)#96 | 0.23%(+0.262)#2,327 |
| 97. | Sea Cliff | 0.49% | 0.17%(+0.328)#97 | 0.23%(+0.259)#2,338 |
| 98. | Irondequoit | 0.49% | 0.17%(+0.324)#98 | 0.23%(+0.256)#2,350 |
| 99. | Bay Shore | 0.49% | 0.17%(+0.322)#99 | 0.23%(+0.253)#2,361 |
| 100. | Round Lake | 0.49% | 0.17%(+0.321)#100 | 0.23%(+0.252)#2,365 |
Common Questions
What are the Top 10 Cities with the Highest Percentage of Spanish Population in New York?
Top 10 Cities with the Highest Percentage of Spanish Population in New York are:
#1
12.47%
#2
5.60%
#3
5.33%
#4
5.11%
#5
3.59%
#6
3.02%
#7
2.95%
#8
2.62%
#9
2.52%
#10
2.34%
What city has the Highest Percentage of Spanish Population in New York?
Pierrepont Manor has the Highest Percentage of Spanish Population in New York with 12.47%.
What is the Percentage of Spanish Population in the State of New York?
Percentage of Spanish Population in New York is 0.17%.
What is the Percentage of Spanish Population in the United States?
Percentage of Spanish Population in the United States is 0.23%.