Cities with the Largest South American Community in New York
RELATED REPORTS & OPTIONS
South American
New York
Compare Cities
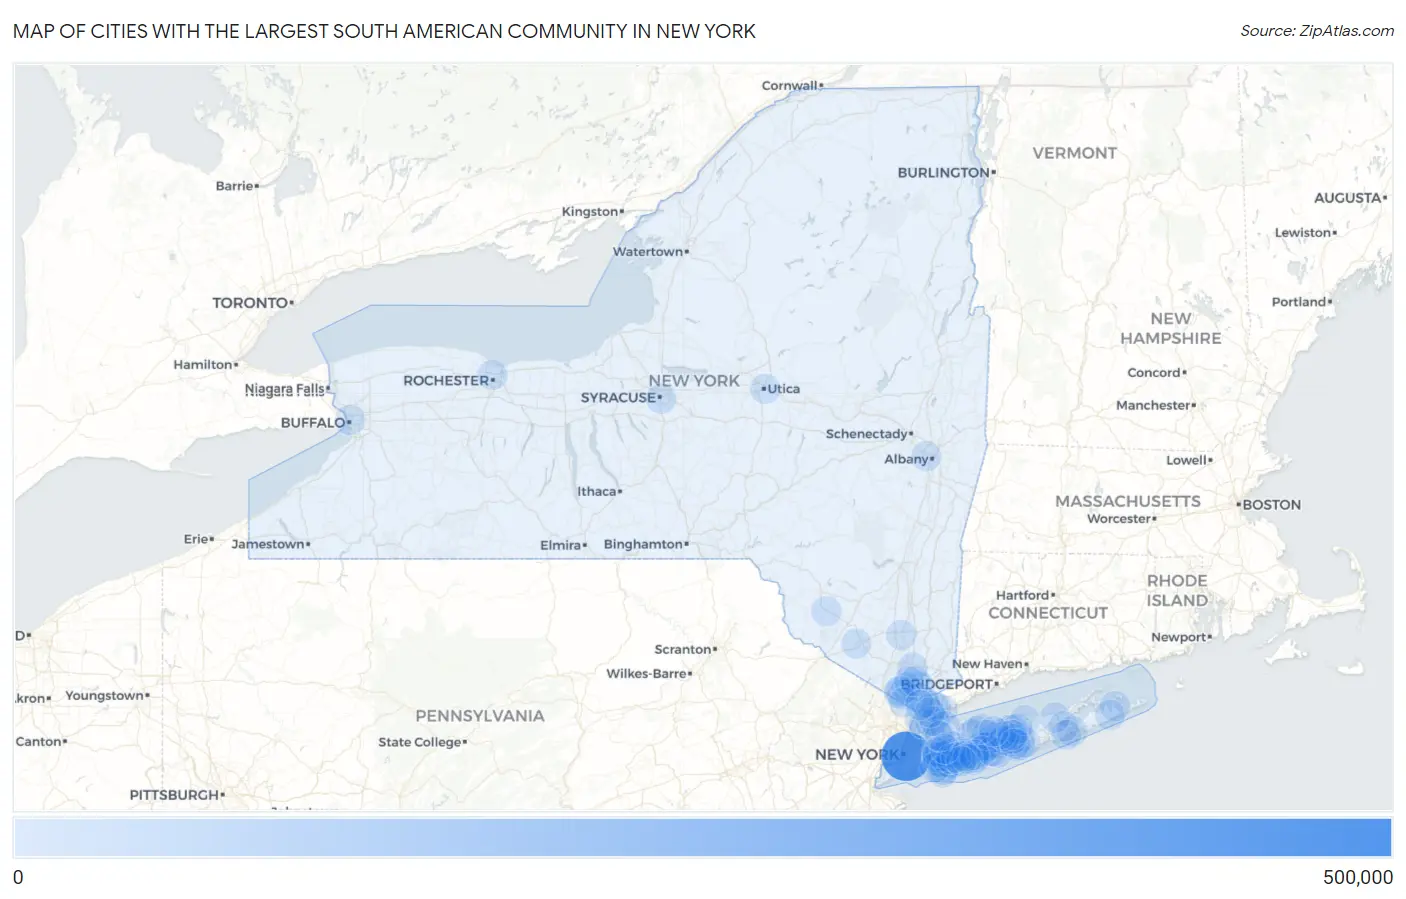
Map of Cities with the Largest South American Community in New York
0
500,000
Cities with the Largest South American Community in New York
| City | South American | vs State | vs National | |
| 1. | New York | 408,570 | 651,110(62.75%)#1 | 4,248,408(9.62%)#1 |
| 2. | Yonkers | 10,980 | 651,110(1.69%)#2 | 4,248,408(0.26%)#40 |
| 3. | White Plains | 7,546 | 651,110(1.16%)#3 | 4,248,408(0.18%)#59 |
| 4. | Brentwood | 7,228 | 651,110(1.11%)#4 | 4,248,408(0.17%)#65 |
| 5. | Port Chester | 6,878 | 651,110(1.06%)#5 | 4,248,408(0.16%)#71 |
| 6. | Ossining | 5,614 | 651,110(0.86%)#6 | 4,248,408(0.13%)#85 |
| 7. | Peekskill | 4,054 | 651,110(0.62%)#7 | 4,248,408(0.10%)#123 |
| 8. | Valley Stream | 3,720 | 651,110(0.57%)#8 | 4,248,408(0.09%)#135 |
| 9. | New Rochelle | 3,637 | 651,110(0.56%)#9 | 4,248,408(0.09%)#142 |
| 10. | Spring Valley | 3,541 | 651,110(0.54%)#10 | 4,248,408(0.08%)#146 |
| 11. | Medford | 3,388 | 651,110(0.52%)#11 | 4,248,408(0.08%)#159 |
| 12. | Bay Shore | 3,382 | 651,110(0.52%)#12 | 4,248,408(0.08%)#161 |
| 13. | Hempstead | 2,790 | 651,110(0.43%)#13 | 4,248,408(0.07%)#205 |
| 14. | Central Islip | 2,697 | 651,110(0.41%)#14 | 4,248,408(0.06%)#214 |
| 15. | Hicksville | 2,689 | 651,110(0.41%)#15 | 4,248,408(0.06%)#215 |
| 16. | Springs | 2,612 | 651,110(0.40%)#16 | 4,248,408(0.06%)#219 |
| 17. | Levittown | 2,480 | 651,110(0.38%)#17 | 4,248,408(0.06%)#230 |
| 18. | Franklin Square | 2,364 | 651,110(0.36%)#18 | 4,248,408(0.06%)#241 |
| 19. | Sleepy Hollow | 2,362 | 651,110(0.36%)#19 | 4,248,408(0.06%)#242 |
| 20. | Elmont | 2,289 | 651,110(0.35%)#20 | 4,248,408(0.05%)#252 |
| 21. | Hampton Bays | 2,281 | 651,110(0.35%)#21 | 4,248,408(0.05%)#253 |
| 22. | Nanuet | 2,033 | 651,110(0.31%)#22 | 4,248,408(0.05%)#288 |
| 23. | Freeport | 1,843 | 651,110(0.28%)#23 | 4,248,408(0.04%)#319 |
| 24. | Mount Vernon | 1,831 | 651,110(0.28%)#24 | 4,248,408(0.04%)#320 |
| 25. | Oceanside | 1,776 | 651,110(0.27%)#25 | 4,248,408(0.04%)#327 |
| 26. | Long Beach | 1,756 | 651,110(0.27%)#26 | 4,248,408(0.04%)#329 |
| 27. | Lynbrook | 1,677 | 651,110(0.26%)#27 | 4,248,408(0.04%)#345 |
| 28. | East Meadow | 1,613 | 651,110(0.25%)#28 | 4,248,408(0.04%)#351 |
| 29. | Newburgh | 1,610 | 651,110(0.25%)#29 | 4,248,408(0.04%)#354 |
| 30. | Harrison | 1,595 | 651,110(0.24%)#30 | 4,248,408(0.04%)#357 |
| 31. | West Babylon | 1,530 | 651,110(0.23%)#31 | 4,248,408(0.04%)#369 |
| 32. | East Hampton North | 1,519 | 651,110(0.23%)#32 | 4,248,408(0.04%)#375 |
| 33. | Glen Cove | 1,496 | 651,110(0.23%)#33 | 4,248,408(0.04%)#384 |
| 34. | Buffalo | 1,493 | 651,110(0.23%)#34 | 4,248,408(0.04%)#386 |
| 35. | Elmsford | 1,411 | 651,110(0.22%)#35 | 4,248,408(0.03%)#416 |
| 36. | Uniondale | 1,407 | 651,110(0.22%)#36 | 4,248,408(0.03%)#418 |
| 37. | Centereach | 1,373 | 651,110(0.21%)#37 | 4,248,408(0.03%)#432 |
| 38. | Patchogue | 1,330 | 651,110(0.20%)#38 | 4,248,408(0.03%)#450 |
| 39. | Albany | 1,288 | 651,110(0.20%)#39 | 4,248,408(0.03%)#462 |
| 40. | Greenlawn | 1,282 | 651,110(0.20%)#40 | 4,248,408(0.03%)#464 |
| 41. | New City | 1,230 | 651,110(0.19%)#41 | 4,248,408(0.03%)#490 |
| 42. | Huntington Station | 1,222 | 651,110(0.19%)#42 | 4,248,408(0.03%)#492 |
| 43. | Middletown | 1,216 | 651,110(0.19%)#43 | 4,248,408(0.03%)#494 |
| 44. | Syracuse | 1,166 | 651,110(0.18%)#44 | 4,248,408(0.03%)#530 |
| 45. | Rochester | 1,139 | 651,110(0.17%)#45 | 4,248,408(0.03%)#544 |
| 46. | Selden | 1,130 | 651,110(0.17%)#46 | 4,248,408(0.03%)#546 |
| 47. | Copiague | 1,109 | 651,110(0.17%)#47 | 4,248,408(0.03%)#555 |
| 48. | Baldwin | 1,074 | 651,110(0.16%)#48 | 4,248,408(0.03%)#575 |
| 49. | Holbrook | 1,070 | 651,110(0.16%)#49 | 4,248,408(0.03%)#576 |
| 50. | New Hyde Park | 1,025 | 651,110(0.16%)#50 | 4,248,408(0.02%)#601 |
| 51. | Flanders | 991 | 651,110(0.15%)#51 | 4,248,408(0.02%)#613 |
| 52. | West Hempstead | 983 | 651,110(0.15%)#52 | 4,248,408(0.02%)#616 |
| 53. | Hillcrest | 965 | 651,110(0.15%)#53 | 4,248,408(0.02%)#628 |
| 54. | North Valley Stream | 955 | 651,110(0.15%)#54 | 4,248,408(0.02%)#632 |
| 55. | East Islip | 924 | 651,110(0.14%)#55 | 4,248,408(0.02%)#646 |
| 56. | Island Park | 913 | 651,110(0.14%)#56 | 4,248,408(0.02%)#654 |
| 57. | Westbury | 900 | 651,110(0.14%)#57 | 4,248,408(0.02%)#663 |
| 58. | South Farmingdale | 867 | 651,110(0.13%)#58 | 4,248,408(0.02%)#690 |
| 59. | Manorhaven | 865 | 651,110(0.13%)#59 | 4,248,408(0.02%)#692 |
| 60. | Deer Park | 864 | 651,110(0.13%)#60 | 4,248,408(0.02%)#693 |
| 61. | Hauppauge | 838 | 651,110(0.13%)#61 | 4,248,408(0.02%)#711 |
| 62. | Mamaroneck | 835 | 651,110(0.13%)#62 | 4,248,408(0.02%)#712 |
| 63. | North Bay Shore | 820 | 651,110(0.13%)#63 | 4,248,408(0.02%)#721 |
| 64. | East Patchogue | 811 | 651,110(0.12%)#64 | 4,248,408(0.02%)#731 |
| 65. | North Wantagh | 787 | 651,110(0.12%)#65 | 4,248,408(0.02%)#748 |
| 66. | Floral Park | 786 | 651,110(0.12%)#66 | 4,248,408(0.02%)#750 |
| 67. | Baywood | 786 | 651,110(0.12%)#67 | 4,248,408(0.02%)#752 |
| 68. | Haverstraw | 779 | 651,110(0.12%)#68 | 4,248,408(0.02%)#766 |
| 69. | Commack | 774 | 651,110(0.12%)#69 | 4,248,408(0.02%)#774 |
| 70. | North Bellport | 760 | 651,110(0.12%)#70 | 4,248,408(0.02%)#782 |
| 71. | Ronkonkoma | 753 | 651,110(0.12%)#71 | 4,248,408(0.02%)#789 |
| 72. | Coram | 744 | 651,110(0.11%)#72 | 4,248,408(0.02%)#799 |
| 73. | Lake Ronkonkoma | 729 | 651,110(0.11%)#73 | 4,248,408(0.02%)#815 |
| 74. | North Babylon | 692 | 651,110(0.11%)#74 | 4,248,408(0.02%)#849 |
| 75. | Pearl River | 672 | 651,110(0.10%)#75 | 4,248,408(0.02%)#873 |
| 76. | Cedarhurst | 669 | 651,110(0.10%)#76 | 4,248,408(0.02%)#884 |
| 77. | Roosevelt | 651 | 651,110(0.10%)#77 | 4,248,408(0.02%)#909 |
| 78. | Utica | 645 | 651,110(0.10%)#78 | 4,248,408(0.02%)#920 |
| 79. | Lindenhurst | 639 | 651,110(0.10%)#79 | 4,248,408(0.02%)#923 |
| 80. | North Massapequa | 639 | 651,110(0.10%)#80 | 4,248,408(0.02%)#924 |
| 81. | North Lindenhurst | 638 | 651,110(0.10%)#81 | 4,248,408(0.02%)#925 |
| 82. | North Bellmore | 637 | 651,110(0.10%)#82 | 4,248,408(0.01%)#926 |
| 83. | Riverhead | 636 | 651,110(0.10%)#83 | 4,248,408(0.01%)#928 |
| 84. | Islip | 633 | 651,110(0.10%)#84 | 4,248,408(0.01%)#931 |
| 85. | East Massapequa | 605 | 651,110(0.09%)#85 | 4,248,408(0.01%)#968 |
| 86. | Holtsville | 604 | 651,110(0.09%)#86 | 4,248,408(0.01%)#970 |
| 87. | Mineola | 600 | 651,110(0.09%)#87 | 4,248,408(0.01%)#975 |
| 88. | East Quogue | 597 | 651,110(0.09%)#88 | 4,248,408(0.01%)#979 |
| 89. | Monticello | 589 | 651,110(0.09%)#89 | 4,248,408(0.01%)#990 |
| 90. | Port Washington | 588 | 651,110(0.09%)#90 | 4,248,408(0.01%)#994 |
| 91. | Nesconset | 559 | 651,110(0.09%)#91 | 4,248,408(0.01%)#1,034 |
| 92. | Croton On Hudson | 557 | 651,110(0.09%)#92 | 4,248,408(0.01%)#1,035 |
| 93. | East Northport | 551 | 651,110(0.08%)#93 | 4,248,408(0.01%)#1,043 |
| 94. | Seaford | 550 | 651,110(0.08%)#94 | 4,248,408(0.01%)#1,044 |
| 95. | Rocky Point | 547 | 651,110(0.08%)#95 | 4,248,408(0.01%)#1,049 |
| 96. | Farmingville | 545 | 651,110(0.08%)#96 | 4,248,408(0.01%)#1,051 |
| 97. | Scarsdale | 542 | 651,110(0.08%)#97 | 4,248,408(0.01%)#1,055 |
| 98. | Irvington | 528 | 651,110(0.08%)#98 | 4,248,408(0.01%)#1,077 |
| 99. | North Patchogue | 527 | 651,110(0.08%)#99 | 4,248,408(0.01%)#1,079 |
| 100. | Smithtown | 497 | 651,110(0.08%)#100 | 4,248,408(0.01%)#1,125 |
Common Questions
What are the Top 10 Cities with the Largest South American Community in New York?
Top 10 Cities with the Largest South American Community in New York are:
#1
408,570
#2
10,980
#3
7,546
#4
7,228
#5
6,878
#6
5,614
#7
4,054
#8
3,720
#9
3,637
#10
3,541
What city has the Largest South American Community in New York?
New York has the Largest South American Community in New York with 408,570.
What is the Total South American Population in the State of New York?
Total South American Population in New York is 651,110.
What is the Total South American Population in the United States?
Total South American Population in the United States is 4,248,408.