Cities with the Most Immigrants from Jordan in New York

RELATED REPORTS & OPTIONS

Jordan
Population
Families and Households
Female Fertility
Female Fertility (Unmarried)
Race (Community Size)
Race (Percentage)
Ancestry (Community Size)
AfghanAfricanAlaska NativeAlaskan AthabascanAlbanianAleutAlsatianAmericanApacheArabArapahoArgentineanArmenianAssyrian / Chaldean / SyriacAustralianAustrianBahamianBangladeshiBarbadianBasqueBelgianBelizeanBermudanBhutaneseBlackfeetBolivianBrazilianBritishBritish West IndianBulgarianBurmeseCajunCambodianCanadianCape VerdeanCarpatho RusynCelticCentral AmericanCentral American IndianCherokeeCheyenneChickasawChileanChineseChippewaChoctawColombianColvilleComancheCosta RicanCreeCreekCroatianCrowCubanCypriotCzechCzechoslovakianDanishDelawareDominicanDutchDutch West IndianEastern EuropeanEcuadorianEgyptianEnglishEstonianEthiopianEuropeanFijianFilipinoFinnishFrenchFrench American IndianFrench CanadianGermanGerman RussianGhanaianGreekGuamanian / ChamorroGuatemalanGuyaneseHaitianHmongHonduranHopiHoumaHungarianIcelanderIndian (Asian)IndonesianInupiatIranianIraqiIrishIroquoisIsraeliItalianJamaicanJapaneseJordanianKenyanKiowaKoreanLaotianLatvianLebaneseLiberianLithuanianLumbeeLuxembourgerMacedonianMalaysianMalteseMarshalleseMenomineeMexicanMexican American IndianMongolianMoroccanNative HawaiianNavajoNepaleseNew ZealanderNicaraguanNigerianNorthern EuropeanNorwegianOkinawanOsageOttawaPaiutePakistaniPalestinianPanamanianParaguayanPennsylvania GermanPeruvianPimaPolishPortuguesePotawatomiPuebloPuerto RicanPuget Sound SalishRomanianRussianSalvadoranSamoanScandinavianScotch-IrishScottishSeminoleSenegaleseSerbianShoshoneSierra LeoneanSiouxSlavicSlovakSloveneSomaliSouth AfricanSouth AmericanSouth American IndianSoviet UnionSpaniardSpanishSpanish AmericanSpanish American IndianSri LankanSubsaharan AfricanSudaneseSwedishSwissSyrianTaiwaneseThaiTlingit-HaidaTohono O'OdhamTonganTrinidadian and TobagonianTsimshianTurkishU.S. Virgin IslanderUgandanUkrainianUruguayanUteVenezuelanVietnameseWelshWest IndianYakamaYaquiYugoslavianYumanYup'ikZimbabwean
Ancestry (Percentage)
AfghanAfricanAlaska NativeAlaskan AthabascanAlbanianAleutAlsatianAmericanApacheArabArapahoArgentineanArmenianAssyrian / Chaldean / SyriacAustralianAustrianBahamianBangladeshiBarbadianBasqueBelgianBelizeanBermudanBhutaneseBlackfeetBolivianBrazilianBritishBritish West IndianBulgarianBurmeseCajunCambodianCanadianCape VerdeanCarpatho RusynCelticCentral AmericanCentral American IndianCherokeeCheyenneChickasawChileanChineseChippewaChoctawColombianColvilleComancheCosta RicanCreeCreekCroatianCrowCubanCypriotCzechCzechoslovakianDanishDelawareDominicanDutchDutch West IndianEastern EuropeanEcuadorianEgyptianEnglishEstonianEthiopianEuropeanFijianFilipinoFinnishFrenchFrench American IndianFrench CanadianGermanGerman RussianGhanaianGreekGuamanian / ChamorroGuatemalanGuyaneseHaitianHmongHonduranHopiHoumaHungarianIcelanderIndian (Asian)IndonesianInupiatIranianIraqiIrishIroquoisIsraeliItalianJamaicanJapaneseJordanianKenyanKiowaKoreanLaotianLatvianLebaneseLiberianLithuanianLumbeeLuxembourgerMacedonianMalaysianMalteseMarshalleseMenomineeMexicanMexican American IndianMongolianMoroccanNative HawaiianNavajoNepaleseNew ZealanderNicaraguanNigerianNorthern EuropeanNorwegianOkinawanOsageOttawaPaiutePakistaniPalestinianPanamanianParaguayanPennsylvania GermanPeruvianPimaPolishPortuguesePotawatomiPuebloPuerto RicanPuget Sound SalishRomanianRussianSalvadoranSamoanScandinavianScotch-IrishScottishSeminoleSenegaleseSerbianShoshoneSierra LeoneanSiouxSlavicSlovakSloveneSomaliSouth AfricanSouth AmericanSouth American IndianSoviet UnionSpaniardSpanishSpanish AmericanSpanish American IndianSri LankanSubsaharan AfricanSudaneseSwedishSwissSyrianTaiwaneseThaiTlingit-HaidaTohono O'OdhamTonganTrinidadian and TobagonianTsimshianTurkishU.S. Virgin IslanderUgandanUkrainianUruguayanUteVenezuelanVietnameseWelshWest IndianYakamaYaquiYugoslavianYumanYup'ikZimbabwean
Immigrant Origin (Total)
AfghanistanAfricaAlbaniaArgentinaArmeniaAsiaAustraliaAustriaAzoresBahamasBangladeshBarbadosBelarusBelgiumBelizeBoliviaBosnia and HerzegovinaBrazilBulgariaBurma / MyanmarCabo VerdeCambodiaCameroonCanadaCaribbeanCentral AmericaChileChinaColombiaCongoCosta RicaCroatiaCubaCzechoslovakiaDenmarkDominicaDominican RepublicEastern AfricaEastern AsiaEastern EuropeEcuadorEgyptEl SalvadorEnglandEritreaEthiopiaEuropeFijiFranceGermanyGhanaGreeceGrenadaGuatemalaGuyanaHaitiHondurasHong KongHungaryIndiaIndonesiaIranIraqIrelandIsraelItalyJamaicaJapanJordanKazakhstanKenyaKoreaKuwaitLaosLatin AmericaLatviaLebanonLiberiaLithuaniaMalaysiaMexicoMicronesiaMiddle AfricaMoldovaMoroccoNepalNetherlandsNicaraguaNigeriaNorth MacedoniaNorthern AfricaNorthern EuropeNorwayOceaniaPakistanPanamaPeruPhilippinesPolandPortugalRomaniaRussiaSaudi ArabiaScotlandSenegalSerbiaSierra LeoneSingaporeSomaliaSouth AfricaSouth AmericaSouth Central AsiaSouth Eastern AsiaSouthern EuropeSpainSri LankaSt. Vincent and the GrenadinesSudanSwedenSwitzerlandSyriaTaiwanThailandTrinidad and TobagoTurkeyUgandaUkraineUruguayUzbekistanVenezuelaVietnamWest IndiesWestern AfricaWestern AsiaWestern EuropeYemenZaireZimbabwe
Immigrant Origin (Percentage)
AfghanistanAfricaAlbaniaArgentinaArmeniaAsiaAustraliaAustriaAzoresBahamasBangladeshBarbadosBelarusBelgiumBelizeBoliviaBosnia and HerzegovinaBrazilBulgariaBurma / MyanmarCabo VerdeCambodiaCameroonCanadaCaribbeanCentral AmericaChileChinaColombiaCongoCosta RicaCroatiaCubaCzechoslovakiaDenmarkDominicaDominican RepublicEastern AfricaEastern AsiaEastern EuropeEcuadorEgyptEl SalvadorEnglandEritreaEthiopiaEuropeFijiFranceGermanyGhanaGreeceGrenadaGuatemalaGuyanaHaitiHondurasHong KongHungaryIndiaIndonesiaIranIraqIrelandIsraelItalyJamaicaJapanJordanKazakhstanKenyaKoreaKuwaitLaosLatin AmericaLatviaLebanonLiberiaLithuaniaMalaysiaMexicoMicronesiaMiddle AfricaMoldovaMoroccoNepalNetherlandsNicaraguaNigeriaNorth MacedoniaNorthern AfricaNorthern EuropeNorwayOceaniaPakistanPanamaPeruPhilippinesPolandPortugalRomaniaRussiaSaudi ArabiaScotlandSenegalSerbiaSierra LeoneSingaporeSomaliaSouth AfricaSouth AmericaSouth Central AsiaSouth Eastern AsiaSouthern EuropeSpainSri LankaSt. Vincent and the GrenadinesSudanSwedenSwitzerlandSyriaTaiwanThailandTrinidad and TobagoTurkeyUgandaUkraineUruguayUzbekistanVenezuelaVietnamWest IndiesWestern AfricaWestern AsiaWestern EuropeYemenZaireZimbabwe
Income
Income (Families)
Income (Households)
Poverty
Poverty (Families)
Unemployment
Employment Occupations
Employment Industries
Employer Class
Commute Time
Commute Means
School Enrollment
Education by Degree Field
Occupancy
Finances
Physical Characteristics
New York
Compare Cities
Comparison Subject

Map of Cities with the Most Immigrants from Jordan in New York

0
2,500
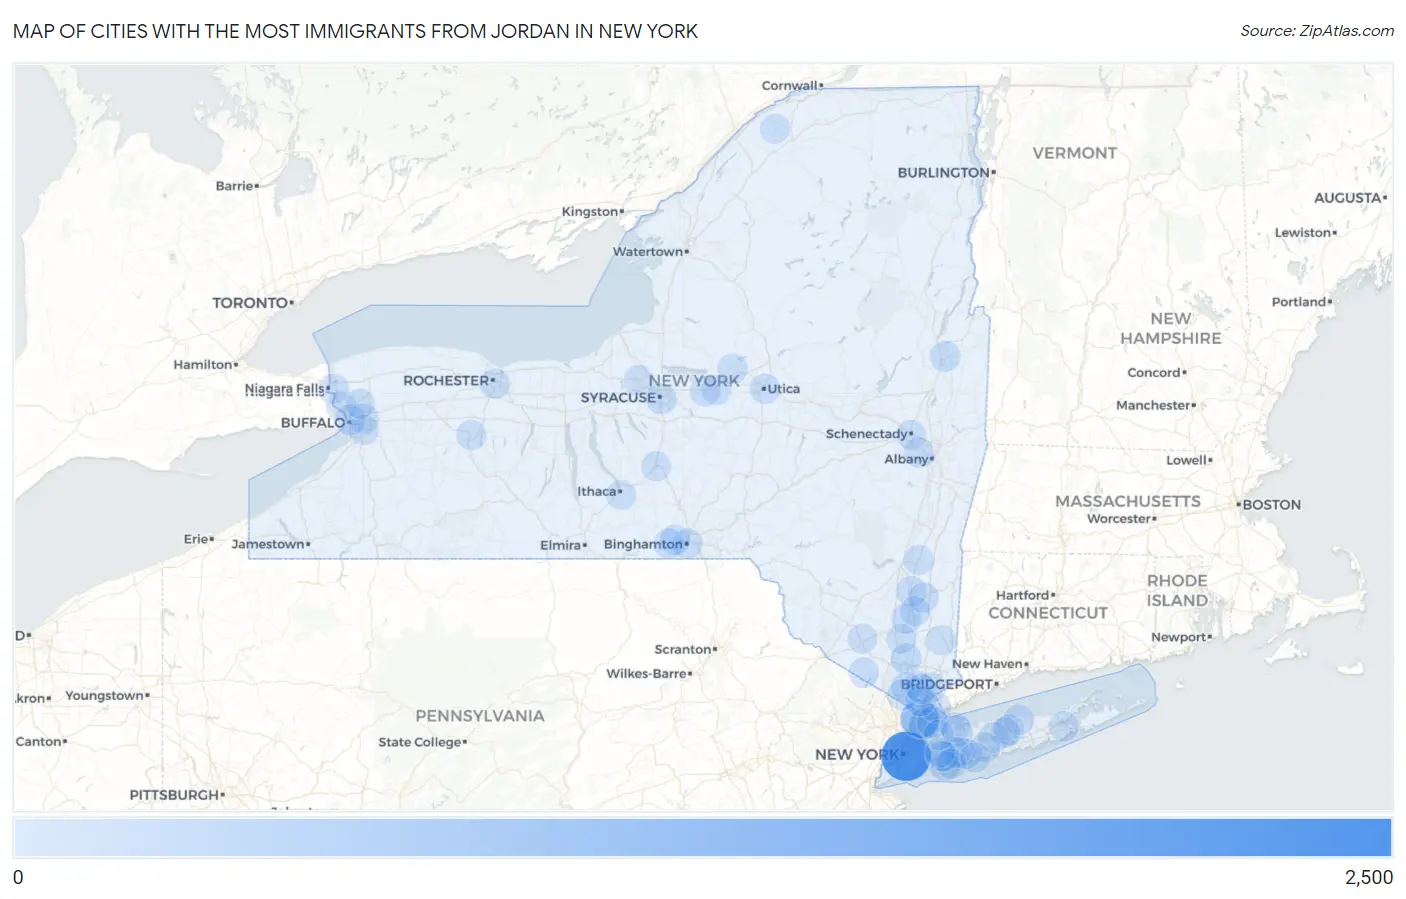
Cities with the Most Immigrants from Jordan in New York Map

Cities with the Most Immigrants from Jordan in New York

City Jordan vs State vs National
1. New York 2,169 5,923 (36.62%)#1 88,074 (2.46%)#1
2. Yonkers 961 5,923 (16.22%)#2 88,074 (1.09%)#6
3. Larchmont 134 5,923 (2.26%)#3 88,074 (0.15%)#129
4. Mount Vernon 106 5,923 (1.79%)#4 88,074 (0.12%)#166
5. Nanuet 100 5,923 (1.69%)#5 88,074 (0.11%)#178
6. Fort Montgomery 91 5,923 (1.54%)#6 88,074 (0.10%)#196
7. Glens Falls 75 5,923 (1.27%)#7 88,074 (0.09%)#244
8. Oyster Bay 75 5,923 (1.27%)#8 88,074 (0.09%)#247
9. Hauppauge 67 5,923 (1.13%)#9 88,074 (0.08%)#267
10. Syracuse 66 5,923 (1.11%)#10 88,074 (0.07%)#270
11. Centereach 63 5,923 (1.06%)#11 88,074 (0.07%)#281
12. Fairview Cdp Dutchess County 61 5,923 (1.03%)#12 88,074 (0.07%)#295
13. Latham 59 5,923 (1.00%)#13 88,074 (0.07%)#304
14. New City 56 5,923 (0.95%)#14 88,074 (0.06%)#312
15. Franklin Square 54 5,923 (0.91%)#15 88,074 (0.06%)#328
16. Miller Place 54 5,923 (0.91%)#16 88,074 (0.06%)#330
17. Canastota 52 5,923 (0.88%)#17 88,074 (0.06%)#343
18. Brighton 49 5,923 (0.83%)#18 88,074 (0.06%)#363
19. Buffalo 48 5,923 (0.81%)#19 88,074 (0.05%)#368
20. Binghamton 40 5,923 (0.68%)#20 88,074 (0.05%)#428
21. Westmere 40 5,923 (0.68%)#21 88,074 (0.05%)#438
22. South Farmingdale 35 5,923 (0.59%)#22 88,074 (0.04%)#478
23. Endicott 34 5,923 (0.57%)#23 88,074 (0.04%)#487
24. Hyde Park 34 5,923 (0.57%)#24 88,074 (0.04%)#489
25. Utica 33 5,923 (0.56%)#25 88,074 (0.04%)#492
26. Ossining 33 5,923 (0.56%)#26 88,074 (0.04%)#494
27. Loudonville 32 5,923 (0.54%)#27 88,074 (0.04%)#503
28. Levittown 31 5,923 (0.52%)#28 88,074 (0.04%)#510
29. Marlboro 28 5,923 (0.47%)#29 88,074 (0.03%)#561
30. Cheektowaga 27 5,923 (0.46%)#30 88,074 (0.03%)#567
31. East Meadow 27 5,923 (0.46%)#31 88,074 (0.03%)#571
32. Pleasant Valley 27 5,923 (0.46%)#32 88,074 (0.03%)#581
33. Greenville Cdp Westchester County 26 5,923 (0.44%)#33 88,074 (0.03%)#591
34. Harrison 24 5,923 (0.41%)#34 88,074 (0.03%)#616
35. Warwick 23 5,923 (0.39%)#35 88,074 (0.03%)#633
36. Oceanside 22 5,923 (0.37%)#36 88,074 (0.02%)#641
37. Tarrytown 19 5,923 (0.32%)#37 88,074 (0.02%)#703
38. Endwell 18 5,923 (0.30%)#38 88,074 (0.02%)#719
39. Rome 17 5,923 (0.29%)#39 88,074 (0.02%)#729
40. Grandyle Village 17 5,923 (0.29%)#40 88,074 (0.02%)#738
41. Schenectady 16 5,923 (0.27%)#41 88,074 (0.02%)#748
42. Baldwinsville 16 5,923 (0.27%)#42 88,074 (0.02%)#760
43. Spackenkill 16 5,923 (0.27%)#43 88,074 (0.02%)#763
44. Red Hook 14 5,923 (0.24%)#44 88,074 (0.02%)#824
45. Chappaqua 13 5,923 (0.22%)#45 88,074 (0.01%)#851
46. West Seneca 12 5,923 (0.20%)#46 88,074 (0.01%)#863
47. Lake Grove 12 5,923 (0.20%)#47 88,074 (0.01%)#872
48. Scotchtown 12 5,923 (0.20%)#48 88,074 (0.01%)#875
49. Oneida 12 5,923 (0.20%)#49 88,074 (0.01%)#876
50. West Hempstead 10 5,923 (0.17%)#50 88,074 (0.01%)#918
51. Lake Carmel 10 5,923 (0.17%)#51 88,074 (0.01%)#927
52. Baywood 10 5,923 (0.17%)#52 88,074 (0.01%)#930
53. South Hill 10 5,923 (0.17%)#53 88,074 (0.01%)#931
54. Lindenhurst 9 5,923 (0.15%)#54 88,074 (0.01%)#951
55. Port Washington North 8 5,923 (0.14%)#55 88,074 (0.01%)#997
56. Niagara Falls 7 5,923 (0.12%)#56 88,074 (0.01%)#1,009
57. New Windsor 7 5,923 (0.12%)#57 88,074 (0.01%)#1,026
58. University At Buffalo 7 5,923 (0.12%)#58 88,074 (0.01%)#1,032
59. Freeport 6 5,923 (0.10%)#59 88,074 (0.01%)#1,042
60. Cortland 5 5,923 (0.08%)#60 88,074 (0.01%)#1,070
61. Briarcliff Manor 5 5,923 (0.08%)#61 88,074 (0.01%)#1,074
62. Stewart Manor 5 5,923 (0.08%)#62 88,074 (0.01%)#1,078
63. Geneseo 4 5,923 (0.07%)#63 88,074 (0.00%)#1,095
64. Mill Neck 3 5,923 (0.05%)#64 88,074 (0.00%)#1,112
65. Madrid 3 5,923 (0.05%)#65 88,074 (0.00%)#1,114
66. Flanders 2 5,923 (0.03%)#66 88,074 (0.00%)#1,124

Common Questions

What are the Top 10 Cities with the Most Immigrants from Jordan in New York?
Top 10 Cities with the Most Immigrants from Jordan in New York are:
What city has the Most Immigrants from Jordan in New York?
New York has the Most Immigrants from Jordan in New York with 2,169.
What is the Total Immigrants from Jordan in the State of New York?
Total Immigrants from Jordan in New York is 5,923.
What is the Total Immigrants from Jordan in the United States?
Total Immigrants from Jordan in the United States is 88,074.