Plattekill, NY Map & Demographics
Plattekill Map
Plattekill Overview
$30,389
PER CAPITA INCOME
$100,652
AVG HOUSEHOLD INCOME
40.0%
WAGE / INCOME GAP [ % ]
60.0¢/ $1
WAGE / INCOME GAP [ $ ]
0.32
INEQUALITY / GINI INDEX
1,410
TOTAL POPULATION
699
MALE POPULATION
711
FEMALE POPULATION
98.31
MALES / 100 FEMALES
101.72
FEMALES / 100 MALES
28.8
MEDIAN AGE
3.2
AVG FAMILY SIZE
2.7
AVG HOUSEHOLD SIZE
772
LABOR FORCE [ PEOPLE ]
71.0%
PERCENT IN LABOR FORCE
1.3%
UNEMPLOYMENT RATE
Plattekill Area Codes
Income in Plattekill
Income Overview in Plattekill
| Characteristic | Number | Measure |
| Per Capita Income | 1,410 | $30,389 |
| Median Family Income | 352 | $0 |
| Mean Family Income | 352 | $86,289 |
| Median Household Income | 520 | $100,652 |
| Mean Household Income | 520 | $86,131 |
| Income Deficit | 352 | $0 |
| Wage / Income Gap (%) | 1,410 | 39.98% |
| Wage / Income Gap ($) | 1,410 | 60.02¢ per $1 |
| Gini / Inequality Index | 1,410 | 0.32 |
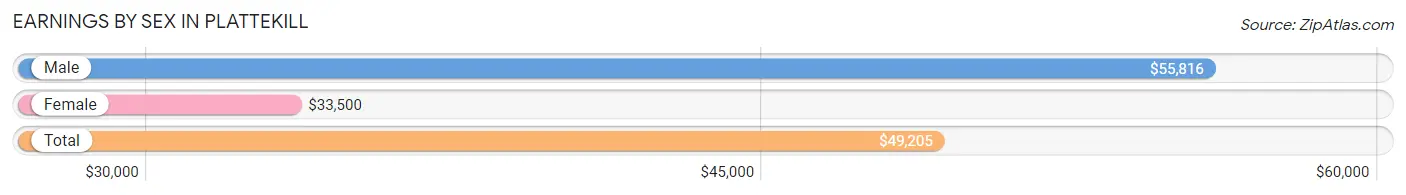
Earnings by Sex in Plattekill
Average Earnings in Plattekill are $49,205, $55,816 for men and $33,500 for women, a difference of 40.0%.
| Sex | Number | Average Earnings |
| Male | 438 (55.2%) | $55,816 |
| Female | 356 (44.8%) | $33,500 |
| Total | 794 (100.0%) | $49,205 |
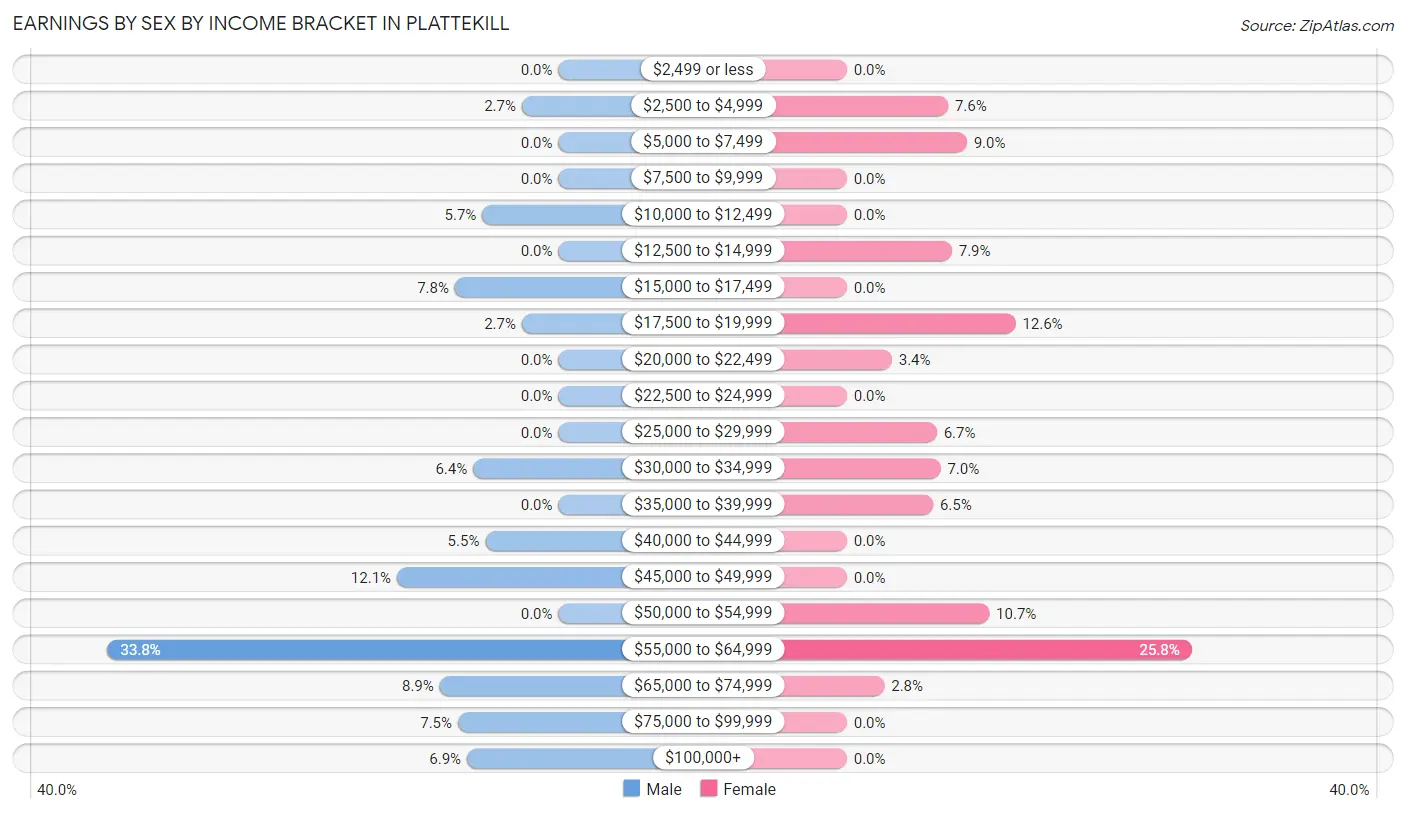
Earnings by Sex by Income Bracket in Plattekill
The most common earnings brackets in Plattekill are $55,000 to $64,999 for men (148 | 33.8%) and $55,000 to $64,999 for women (92 | 25.8%).
| Income | Male | Female |
| $2,499 or less | 0 (0.0%) | 0 (0.0%) |
| $2,500 to $4,999 | 12 (2.7%) | 27 (7.6%) |
| $5,000 to $7,499 | 0 (0.0%) | 32 (9.0%) |
| $7,500 to $9,999 | 0 (0.0%) | 0 (0.0%) |
| $10,000 to $12,499 | 25 (5.7%) | 0 (0.0%) |
| $12,500 to $14,999 | 0 (0.0%) | 28 (7.9%) |
| $15,000 to $17,499 | 34 (7.8%) | 0 (0.0%) |
| $17,500 to $19,999 | 12 (2.7%) | 45 (12.6%) |
| $20,000 to $22,499 | 0 (0.0%) | 12 (3.4%) |
| $22,500 to $24,999 | 0 (0.0%) | 0 (0.0%) |
| $25,000 to $29,999 | 0 (0.0%) | 24 (6.7%) |
| $30,000 to $34,999 | 28 (6.4%) | 25 (7.0%) |
| $35,000 to $39,999 | 0 (0.0%) | 23 (6.5%) |
| $40,000 to $44,999 | 24 (5.5%) | 0 (0.0%) |
| $45,000 to $49,999 | 53 (12.1%) | 0 (0.0%) |
| $50,000 to $54,999 | 0 (0.0%) | 38 (10.7%) |
| $55,000 to $64,999 | 148 (33.8%) | 92 (25.8%) |
| $65,000 to $74,999 | 39 (8.9%) | 10 (2.8%) |
| $75,000 to $99,999 | 33 (7.5%) | 0 (0.0%) |
| $100,000+ | 30 (6.9%) | 0 (0.0%) |
| Total | 438 (100.0%) | 356 (100.0%) |
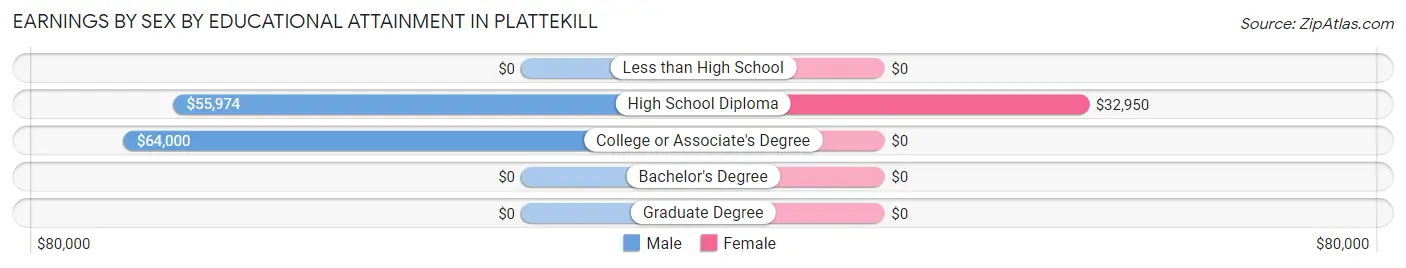
Earnings by Sex by Educational Attainment in Plattekill
Average earnings in Plattekill are $56,829 for men and $53,661 for women, a difference of 5.6%. Men with an educational attainment of college or associate's degree enjoy the highest average annual earnings of $64,000, while those with high school diploma education earn the least with $55,974. Women with an educational attainment of high school diploma earn the most with the average annual earnings of $32,950, while those with high school diploma education have the smallest earnings of $32,950.
| Educational Attainment | Male Income | Female Income |
| Less than High School | - | - |
| High School Diploma | $55,974 | $32,950 |
| College or Associate's Degree | $64,000 | $0 |
| Bachelor's Degree | - | - |
| Graduate Degree | - | - |
| Total | $56,829 | $53,661 |
Family Income in Plattekill
Family Income Brackets in Plattekill
According to the Plattekill family income data, there are 114 families falling into the $50,000 to $74,999 income range, which is the most common income bracket and makes up 32.4% of all families.
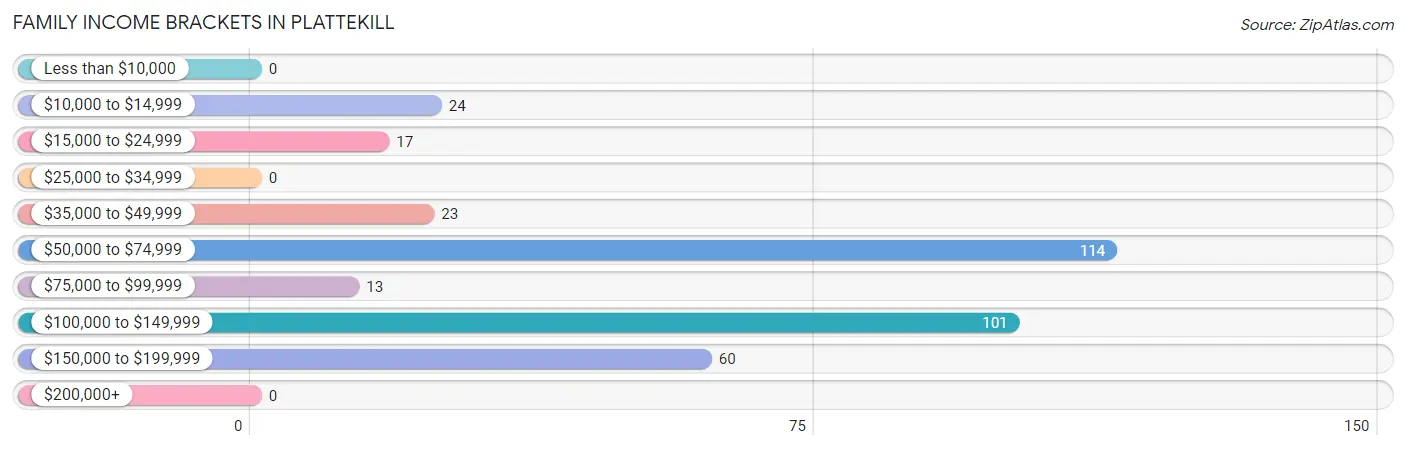
| Income Bracket | # Families | % Families |
| Less than $10,000 | 0 | 0.0% |
| $10,000 to $14,999 | 24 | 6.8% |
| $15,000 to $24,999 | 17 | 4.8% |
| $25,000 to $34,999 | 0 | 0.0% |
| $35,000 to $49,999 | 23 | 6.5% |
| $50,000 to $74,999 | 114 | 32.4% |
| $75,000 to $99,999 | 13 | 3.7% |
| $100,000 to $149,999 | 101 | 28.7% |
| $150,000 to $199,999 | 60 | 17.0% |
| $200,000+ | 0 | 0.0% |
Family Income by Famaliy Size in Plattekill
5-person families (54 | 15.3%) account for the highest median family income in Plattekill with $153,583 per family, while 4-person families (57 | 16.2%) have the highest median income of $32,279 per family member.
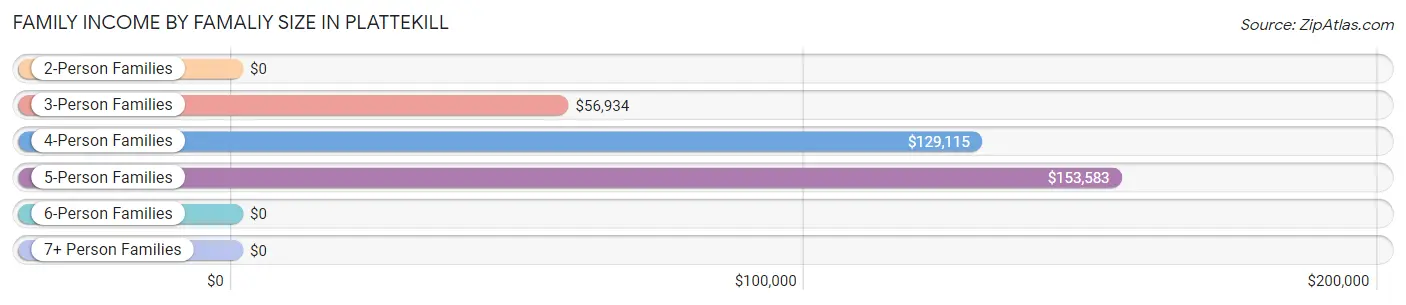
| Income Bracket | # Families | Median Income |
| 2-Person Families | 34 (9.7%) | $0 |
| 3-Person Families | 207 (58.8%) | $56,934 |
| 4-Person Families | 57 (16.2%) | $129,115 |
| 5-Person Families | 54 (15.3%) | $153,583 |
| 6-Person Families | 0 (0.0%) | $0 |
| 7+ Person Families | 0 (0.0%) | $0 |
| Total | 352 (100.0%) | $0 |
Family Income by Number of Earners in Plattekill
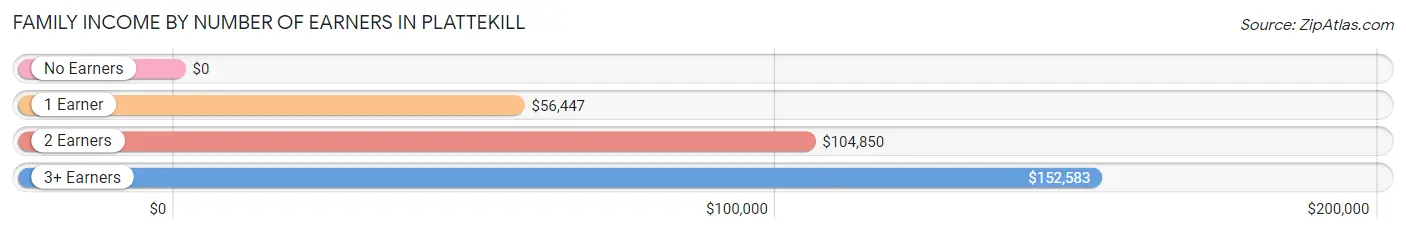
| Number of Earners | # Families | Median Income |
| No Earners | 11 (3.1%) | $0 |
| 1 Earner | 190 (54.0%) | $56,447 |
| 2 Earners | 73 (20.7%) | $104,850 |
| 3+ Earners | 78 (22.2%) | $152,583 |
| Total | 352 (100.0%) | $0 |
Household Income in Plattekill
Household Income Brackets in Plattekill
With 196 households falling in the category, the $100,000 to $149,999 income range is the most frequent in Plattekill, accounting for 37.7% of all households.
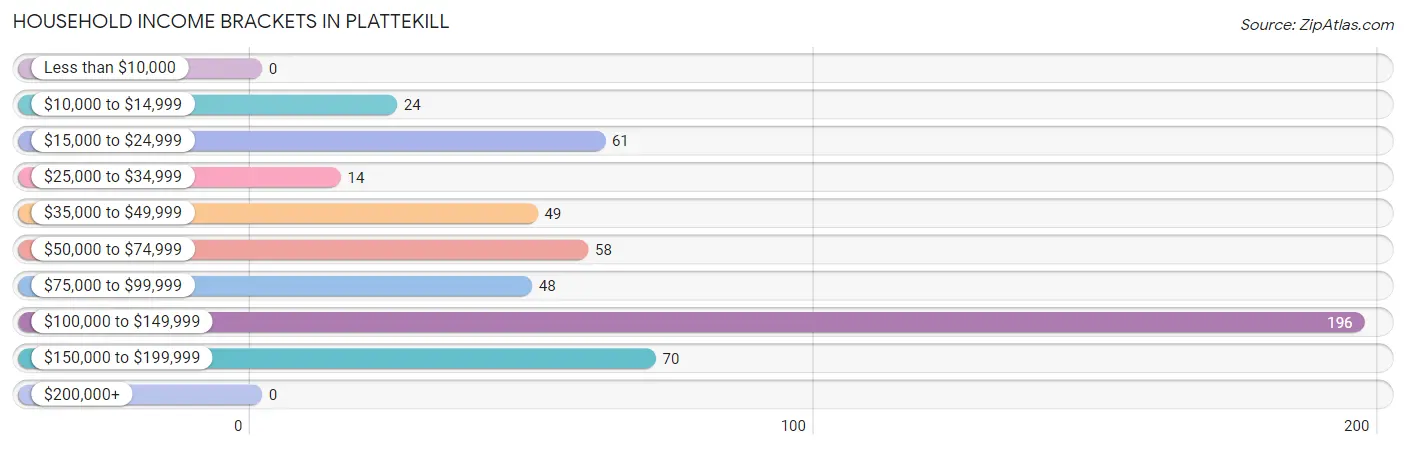
| Income Bracket | # Households | % Households |
| Less than $10,000 | 0 | 0.0% |
| $10,000 to $14,999 | 24 | 4.6% |
| $15,000 to $24,999 | 61 | 11.7% |
| $25,000 to $34,999 | 14 | 2.7% |
| $35,000 to $49,999 | 49 | 9.4% |
| $50,000 to $74,999 | 58 | 11.2% |
| $75,000 to $99,999 | 48 | 9.2% |
| $100,000 to $149,999 | 196 | 37.7% |
| $150,000 to $199,999 | 70 | 13.5% |
| $200,000+ | 0 | 0.0% |
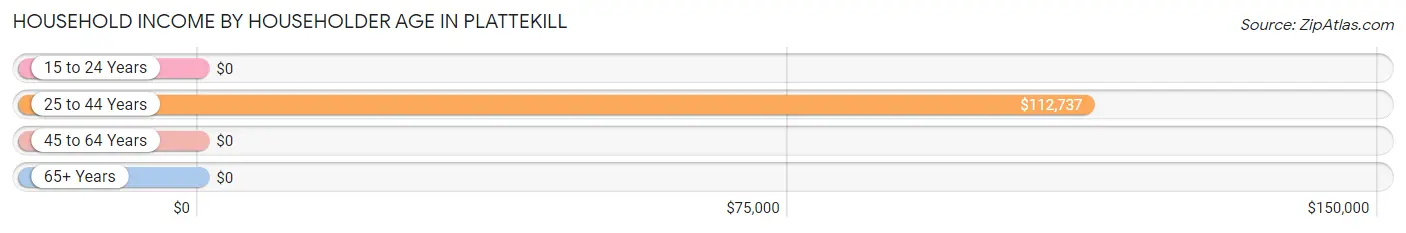
Household Income by Householder Age in Plattekill
The median household income in Plattekill is $100,652, with the highest median household income of $112,737 found in the 25 to 44 years age bracket for the primary householder. A total of 172 households (33.1%) fall into this category. Meanwhile, the 15 to 24 years age bracket for the primary householder has the lowest median household income of $0, with 42 households (8.1%) in this group.
| Income Bracket | # Households | Median Income |
| 15 to 24 Years | 42 (8.1%) | $0 |
| 25 to 44 Years | 172 (33.1%) | $112,737 |
| 45 to 64 Years | 225 (43.3%) | $0 |
| 65+ Years | 81 (15.6%) | $0 |
| Total | 520 (100.0%) | $100,652 |
Poverty in Plattekill
Income Below Poverty by Sex and Age in Plattekill
With 13.6% poverty level for males and 11.8% for females among the residents of Plattekill, 5 year old males and 75 year old and over females are the most vulnerable to poverty, with 25 males (100.0%) and 22 females (44.9%) in their respective age groups living below the poverty level.
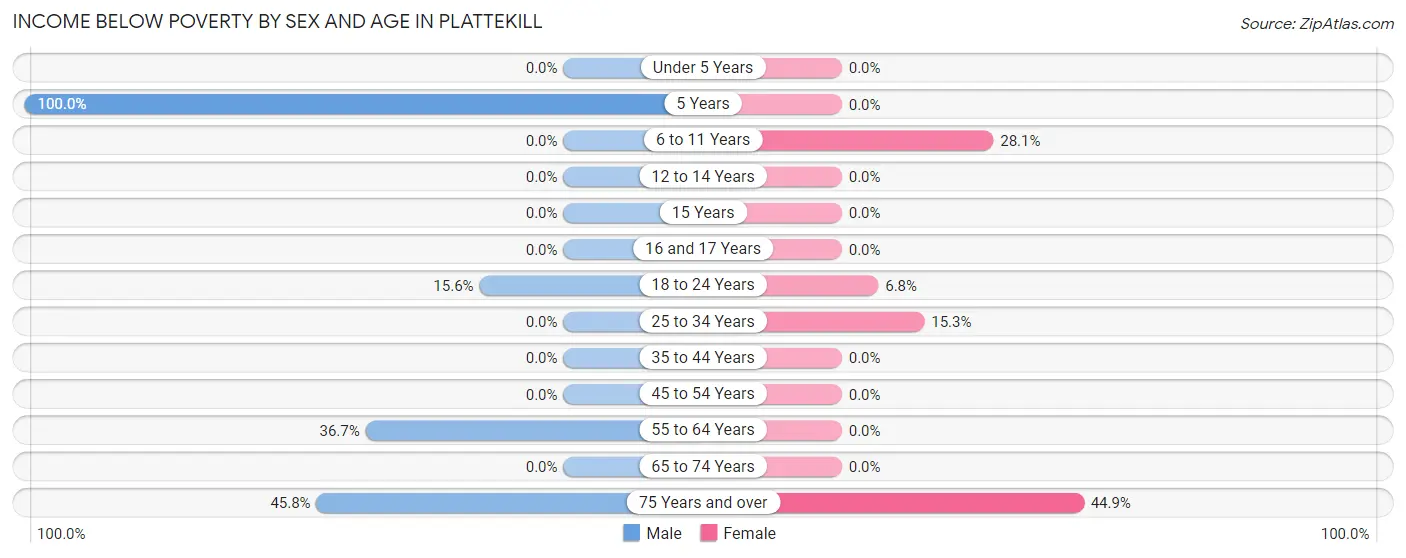
| Age Bracket | Male | Female |
| Under 5 Years | 0 (0.0%) | 0 (0.0%) |
| 5 Years | 25 (100.0%) | 0 (0.0%) |
| 6 to 11 Years | 0 (0.0%) | 36 (28.1%) |
| 12 to 14 Years | 0 (0.0%) | 0 (0.0%) |
| 15 Years | 0 (0.0%) | 0 (0.0%) |
| 16 and 17 Years | 0 (0.0%) | 0 (0.0%) |
| 18 to 24 Years | 12 (15.6%) | 9 (6.8%) |
| 25 to 34 Years | 0 (0.0%) | 17 (15.3%) |
| 35 to 44 Years | 0 (0.0%) | 0 (0.0%) |
| 45 to 54 Years | 0 (0.0%) | 0 (0.0%) |
| 55 to 64 Years | 47 (36.7%) | 0 (0.0%) |
| 65 to 74 Years | 0 (0.0%) | 0 (0.0%) |
| 75 Years and over | 11 (45.8%) | 22 (44.9%) |
| Total | 95 (13.6%) | 84 (11.8%) |
Income Above Poverty by Sex and Age in Plattekill
According to the poverty statistics in Plattekill, males aged under 5 years and females aged under 5 years are the age groups that are most secure financially, with 100.0% of males and 100.0% of females in these age groups living above the poverty line.
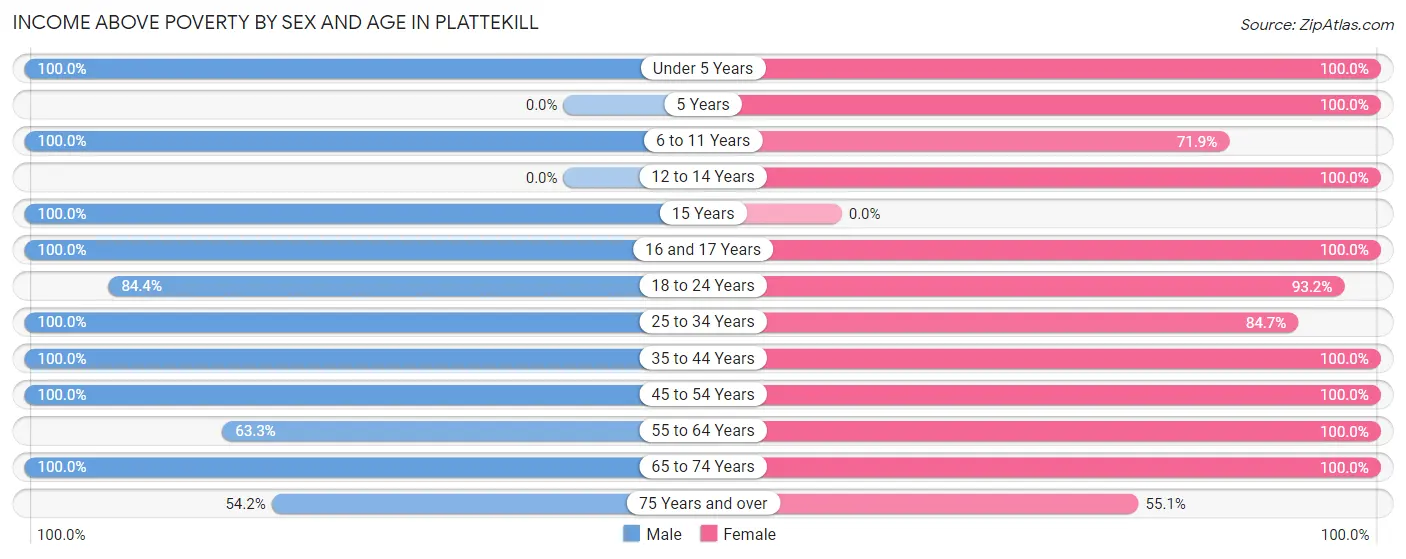
| Age Bracket | Male | Female |
| Under 5 Years | 82 (100.0%) | 10 (100.0%) |
| 5 Years | 0 (0.0%) | 28 (100.0%) |
| 6 to 11 Years | 13 (100.0%) | 92 (71.9%) |
| 12 to 14 Years | 0 (0.0%) | 10 (100.0%) |
| 15 Years | 26 (100.0%) | 0 (0.0%) |
| 16 and 17 Years | 17 (100.0%) | 27 (100.0%) |
| 18 to 24 Years | 65 (84.4%) | 124 (93.2%) |
| 25 to 34 Years | 120 (100.0%) | 94 (84.7%) |
| 35 to 44 Years | 94 (100.0%) | 24 (100.0%) |
| 45 to 54 Years | 70 (100.0%) | 103 (100.0%) |
| 55 to 64 Years | 81 (63.3%) | 43 (100.0%) |
| 65 to 74 Years | 23 (100.0%) | 45 (100.0%) |
| 75 Years and over | 13 (54.2%) | 27 (55.1%) |
| Total | 604 (86.4%) | 627 (88.2%) |
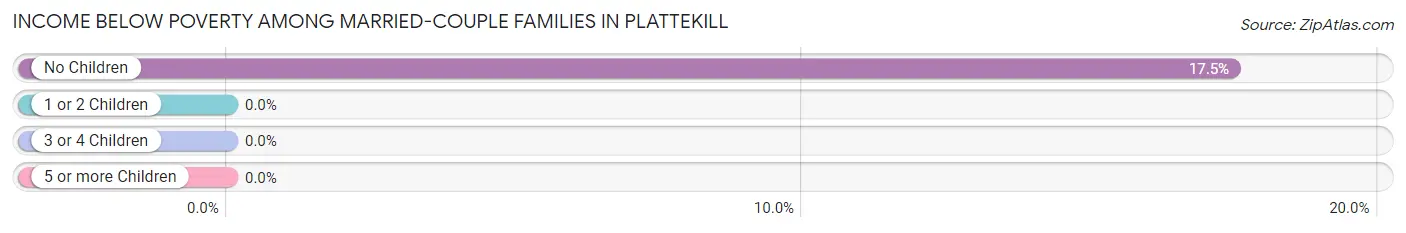
Income Below Poverty Among Married-Couple Families in Plattekill
The poverty statistics for married-couple families in Plattekill show that 6.1% or 11 of the total 180 families live below the poverty line. Families with no children have the highest poverty rate of 17.5%, comprising of 11 families. On the other hand, families with 1 or 2 children have the lowest poverty rate of 0.0%, which includes 0 families.
| Children | Above Poverty | Below Poverty |
| No Children | 52 (82.5%) | 11 (17.5%) |
| 1 or 2 Children | 117 (100.0%) | 0 (0.0%) |
| 3 or 4 Children | 0 (0.0%) | 0 (0.0%) |
| 5 or more Children | 0 (0.0%) | 0 (0.0%) |
| Total | 169 (93.9%) | 11 (6.1%) |
Income Below Poverty Among Single-Parent Households in Plattekill
According to the poverty data in Plattekill, 9.9% or 13 single-father households and 42.5% or 17 single-mother households are living below the poverty line. Among single-father households, those with no children have the highest poverty rate, with 13 households (100.0%) experiencing poverty. Likewise, among single-mother households, those with 1 or 2 children have the highest poverty rate, with 17 households (42.5%) falling below the poverty line.
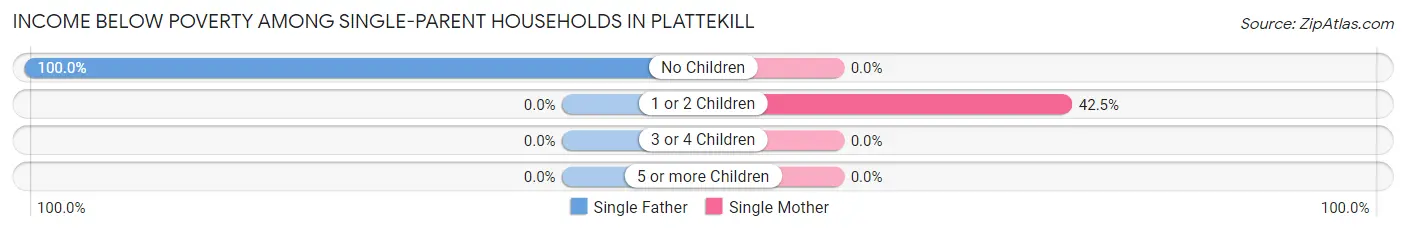
| Children | Single Father | Single Mother |
| No Children | 13 (100.0%) | 0 (0.0%) |
| 1 or 2 Children | 0 (0.0%) | 17 (42.5%) |
| 3 or 4 Children | 0 (0.0%) | 0 (0.0%) |
| 5 or more Children | 0 (0.0%) | 0 (0.0%) |
| Total | 13 (9.9%) | 17 (42.5%) |
Income Below Poverty Among Married-Couple vs Single-Parent Households in Plattekill
The poverty data for Plattekill shows that 11 of the married-couple family households (6.1%) and 30 of the single-parent households (17.4%) are living below the poverty level. Within the married-couple family households, those with no children have the highest poverty rate, with 11 households (17.5%) falling below the poverty line. Among the single-parent households, those with no children have the highest poverty rate, with 13 household (100.0%) living below poverty.
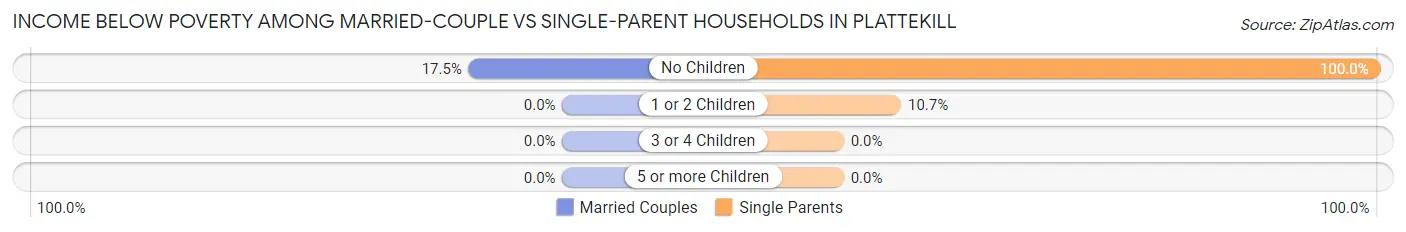
| Children | Married-Couple Families | Single-Parent Households |
| No Children | 11 (17.5%) | 13 (100.0%) |
| 1 or 2 Children | 0 (0.0%) | 17 (10.7%) |
| 3 or 4 Children | 0 (0.0%) | 0 (0.0%) |
| 5 or more Children | 0 (0.0%) | 0 (0.0%) |
| Total | 11 (6.1%) | 30 (17.4%) |
Race in Plattekill
The most populous races in Plattekill are White / Caucasian (810 | 57.5%), Hispanic or Latino (713 | 50.6%), and Some other Race (381 | 27.0%).
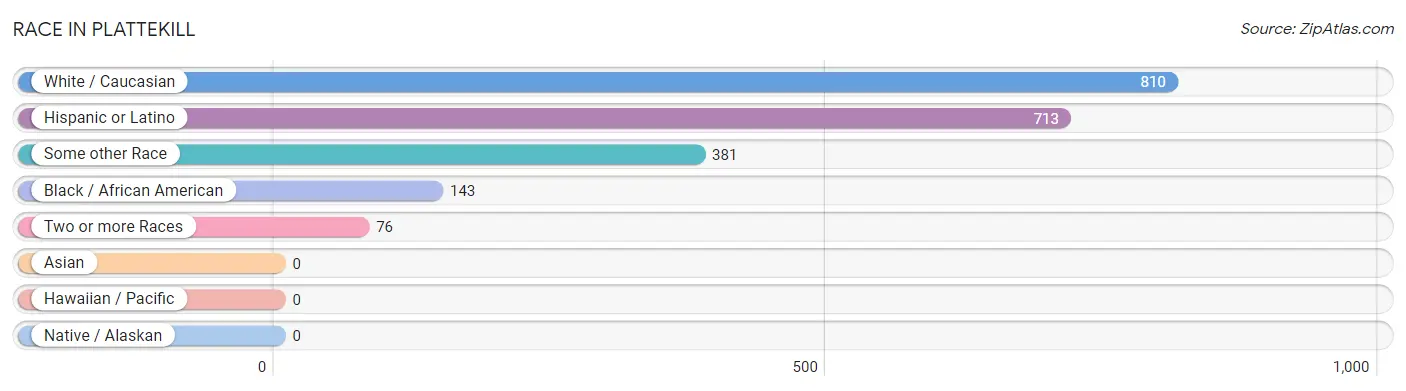
| Race | # Population | % Population |
| Asian | 0 | 0.0% |
| Black / African American | 143 | 10.1% |
| Hawaiian / Pacific | 0 | 0.0% |
| Hispanic or Latino | 713 | 50.6% |
| Native / Alaskan | 0 | 0.0% |
| White / Caucasian | 810 | 57.5% |
| Two or more Races | 76 | 5.4% |
| Some other Race | 381 | 27.0% |
| Total | 1,410 | 100.0% |
Ancestry in Plattekill
The most populous ancestries reported in Plattekill are Puerto Rican (657 | 46.6%), Italian (180 | 12.8%), Irish (95 | 6.7%), German (54 | 3.8%), and Jamaican (49 | 3.5%), together accounting for 73.4% of all Plattekill residents.
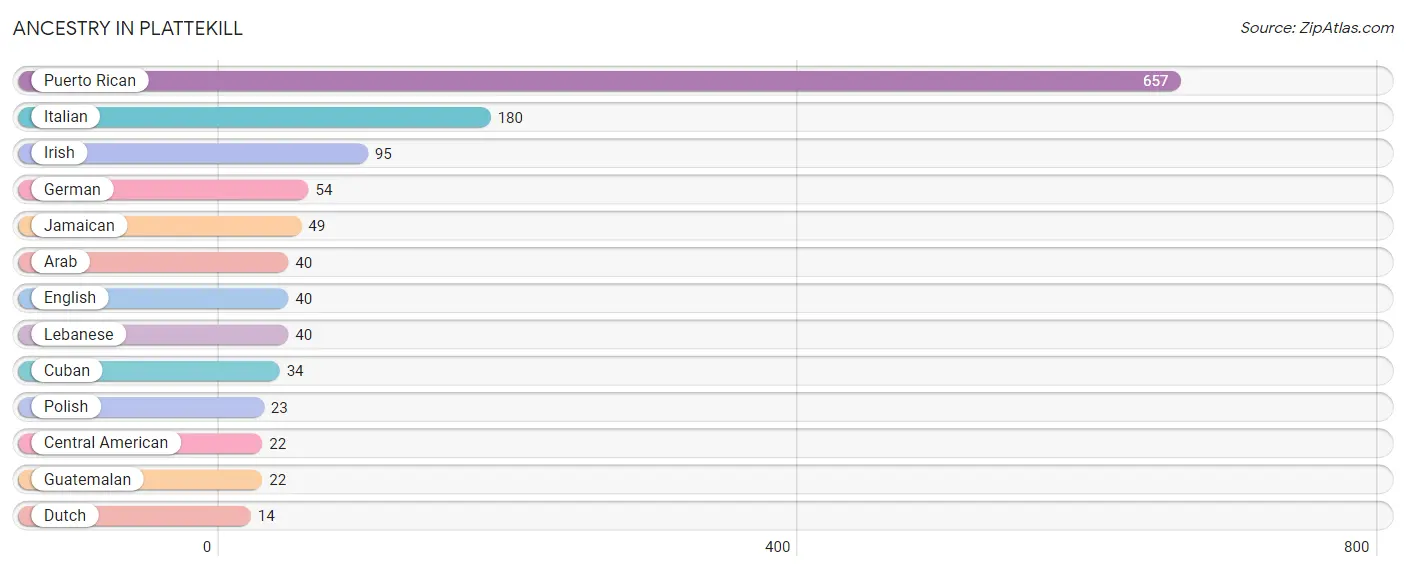
| Ancestry | # Population | % Population |
| Arab | 40 | 2.8% |
| Central American | 22 | 1.6% |
| Cuban | 34 | 2.4% |
| Dutch | 14 | 1.0% |
| English | 40 | 2.8% |
| German | 54 | 3.8% |
| Guatemalan | 22 | 1.6% |
| Irish | 95 | 6.7% |
| Italian | 180 | 12.8% |
| Jamaican | 49 | 3.5% |
| Lebanese | 40 | 2.8% |
| Polish | 23 | 1.6% |
| Puerto Rican | 657 | 46.6% | View All 13 Rows |
Immigrants in Plattekill
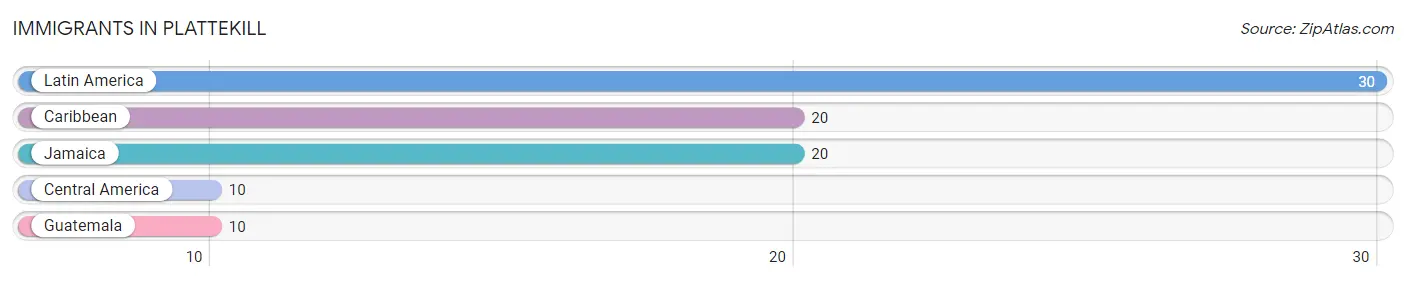
The most numerous immigrant groups reported in Plattekill came from Latin America (30 | 2.1%), Caribbean (20 | 1.4%), Jamaica (20 | 1.4%), Central America (10 | 0.7%), and Guatemala (10 | 0.7%), together accounting for 6.4% of all Plattekill residents.
| Immigration Origin | # Population | % Population |
| Caribbean | 20 | 1.4% |
| Central America | 10 | 0.7% |
| Guatemala | 10 | 0.7% |
| Jamaica | 20 | 1.4% |
| Latin America | 30 | 2.1% | View All 5 Rows |
Sex and Age in Plattekill
Sex and Age in Plattekill
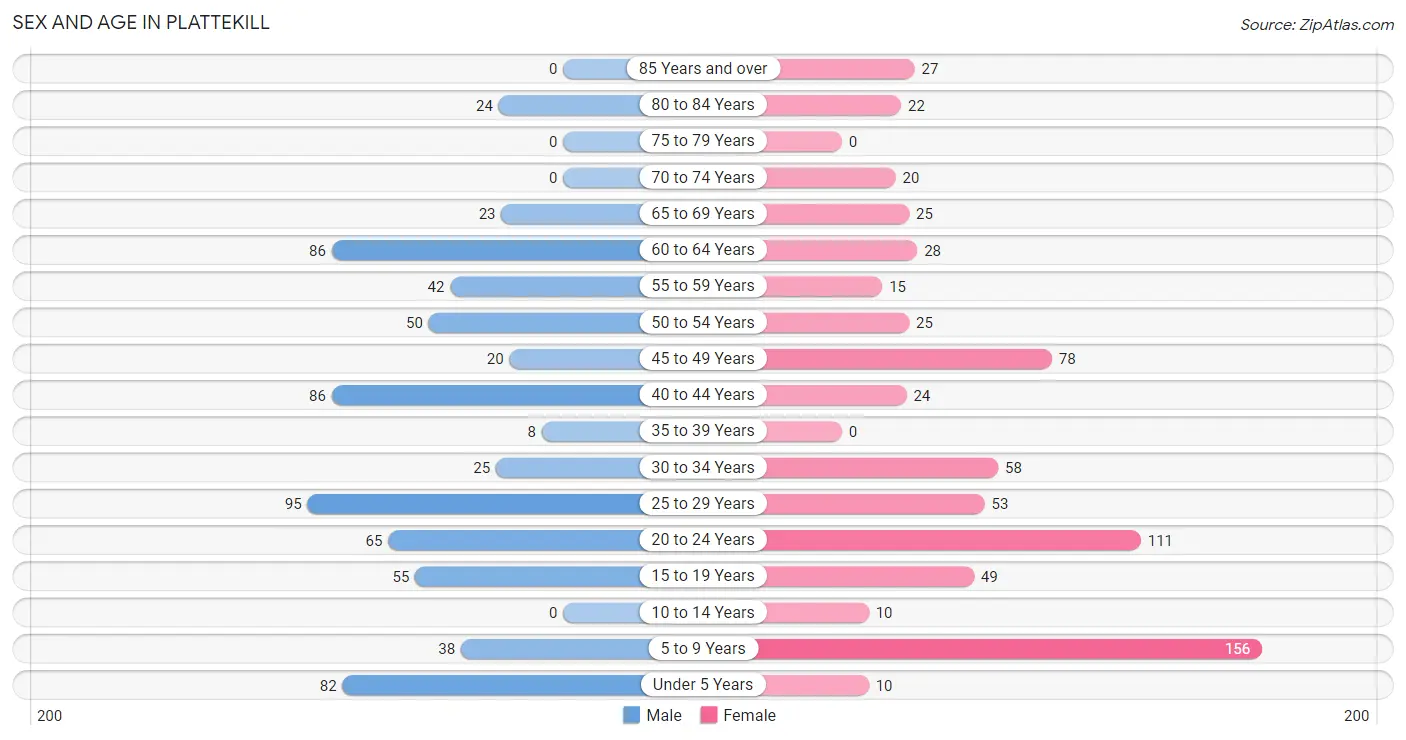
The most populous age groups in Plattekill are 25 to 29 Years (95 | 13.6%) for men and 5 to 9 Years (156 | 21.9%) for women.
| Age Bracket | Male | Female |
| Under 5 Years | 82 (11.7%) | 10 (1.4%) |
| 5 to 9 Years | 38 (5.4%) | 156 (21.9%) |
| 10 to 14 Years | 0 (0.0%) | 10 (1.4%) |
| 15 to 19 Years | 55 (7.9%) | 49 (6.9%) |
| 20 to 24 Years | 65 (9.3%) | 111 (15.6%) |
| 25 to 29 Years | 95 (13.6%) | 53 (7.4%) |
| 30 to 34 Years | 25 (3.6%) | 58 (8.2%) |
| 35 to 39 Years | 8 (1.1%) | 0 (0.0%) |
| 40 to 44 Years | 86 (12.3%) | 24 (3.4%) |
| 45 to 49 Years | 20 (2.9%) | 78 (11.0%) |
| 50 to 54 Years | 50 (7.1%) | 25 (3.5%) |
| 55 to 59 Years | 42 (6.0%) | 15 (2.1%) |
| 60 to 64 Years | 86 (12.3%) | 28 (3.9%) |
| 65 to 69 Years | 23 (3.3%) | 25 (3.5%) |
| 70 to 74 Years | 0 (0.0%) | 20 (2.8%) |
| 75 to 79 Years | 0 (0.0%) | 0 (0.0%) |
| 80 to 84 Years | 24 (3.4%) | 22 (3.1%) |
| 85 Years and over | 0 (0.0%) | 27 (3.8%) |
| Total | 699 (100.0%) | 711 (100.0%) |
Families and Households in Plattekill
Median Family Size in Plattekill
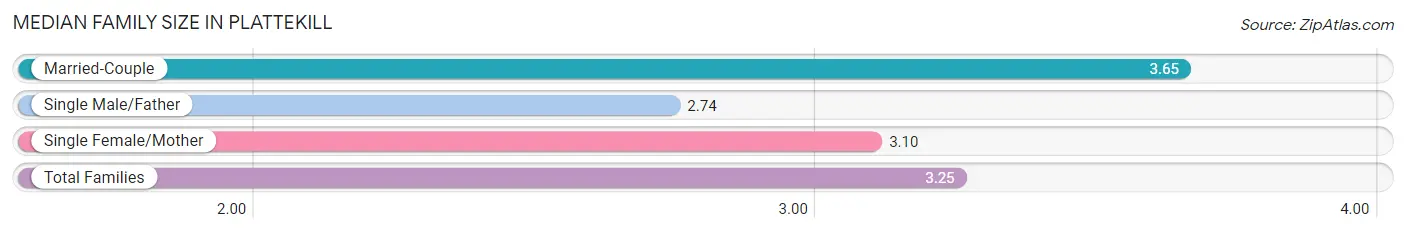
The median family size in Plattekill is 3.25 persons per family, with married-couple families (180 | 51.1%) accounting for the largest median family size of 3.65 persons per family. On the other hand, single male/father families (132 | 37.5%) represent the smallest median family size with 2.74 persons per family.
| Family Type | # Families | Family Size |
| Married-Couple | 180 (51.1%) | 3.65 |
| Single Male/Father | 132 (37.5%) | 2.74 |
| Single Female/Mother | 40 (11.4%) | 3.10 |
| Total Families | 352 (100.0%) | 3.25 |
Median Household Size in Plattekill
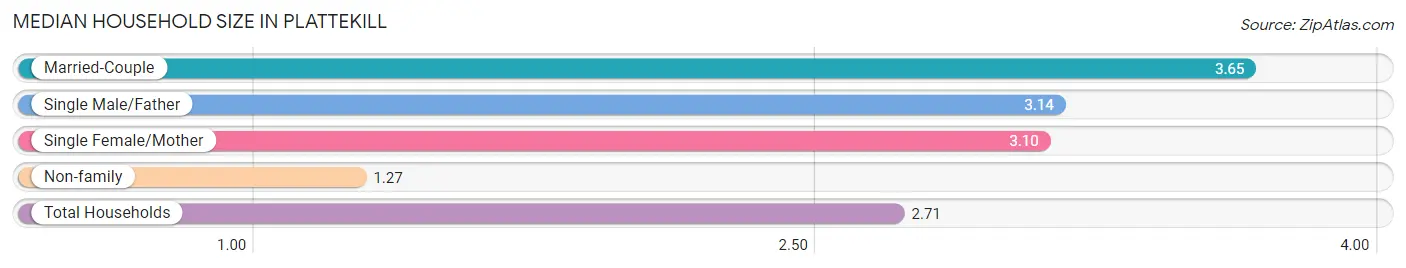
The median household size in Plattekill is 2.71 persons per household, with married-couple households (180 | 34.6%) accounting for the largest median household size of 3.65 persons per household. non-family households (168 | 32.3%) represent the smallest median household size with 1.27 persons per household.
| Household Type | # Households | Household Size |
| Married-Couple | 180 (34.6%) | 3.65 |
| Single Male/Father | 132 (25.4%) | 3.14 |
| Single Female/Mother | 40 (7.7%) | 3.10 |
| Non-family | 168 (32.3%) | 1.27 |
| Total Households | 520 (100.0%) | 2.71 |
Household Size by Marriage Status in Plattekill
Out of a total of 520 households in Plattekill, 352 (67.7%) are family households, while 168 (32.3%) are nonfamily households. The most numerous type of family households are 4-person households, comprising 152, and the most common type of nonfamily households are 1-person households, comprising 123.
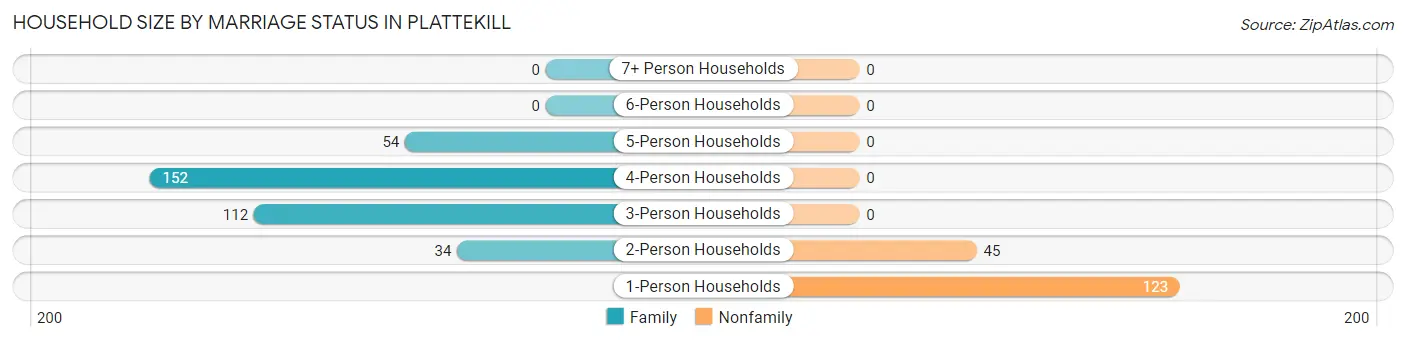
| Household Size | Family Households | Nonfamily Households |
| 1-Person Households | - | 123 (23.6%) |
| 2-Person Households | 34 (6.5%) | 45 (8.6%) |
| 3-Person Households | 112 (21.5%) | 0 (0.0%) |
| 4-Person Households | 152 (29.2%) | 0 (0.0%) |
| 5-Person Households | 54 (10.4%) | 0 (0.0%) |
| 6-Person Households | 0 (0.0%) | 0 (0.0%) |
| 7+ Person Households | 0 (0.0%) | 0 (0.0%) |
| Total | 352 (67.7%) | 168 (32.3%) |
Female Fertility in Plattekill
Fertility by Age in Plattekill
Average fertility rate in Plattekill is 58.0 births per 1,000 women. Women in the age bracket of 20 to 34 years have the highest fertility rate with 104.0 births per 1,000 women. Women in the age bracket of 20 to 34 years acount for 100.0% of all women with births.
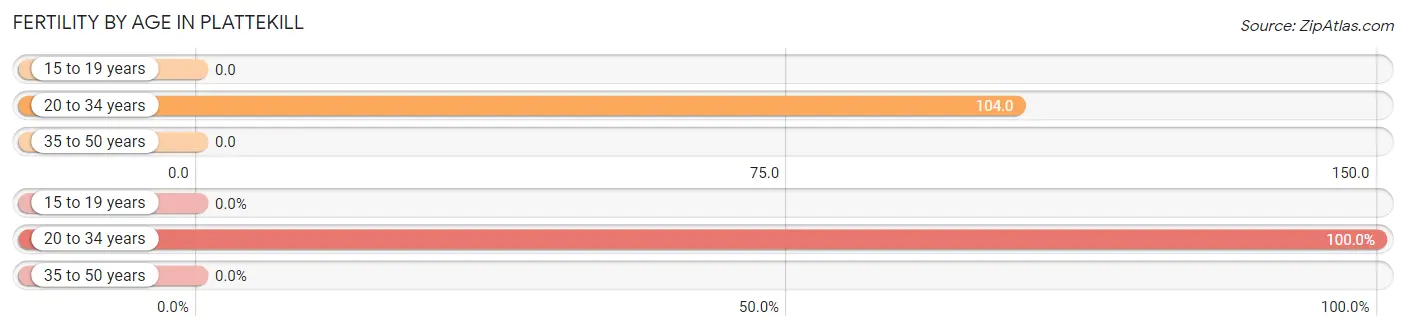
| Age Bracket | Women with Births | Births / 1,000 Women |
| 15 to 19 years | 0 (0.0%) | 0.0 |
| 20 to 34 years | 23 (100.0%) | 104.0 |
| 35 to 50 years | 0 (0.0%) | 0.0 |
| Total | 23 (100.0%) | 58.0 |
Fertility by Age by Marriage Status in Plattekill
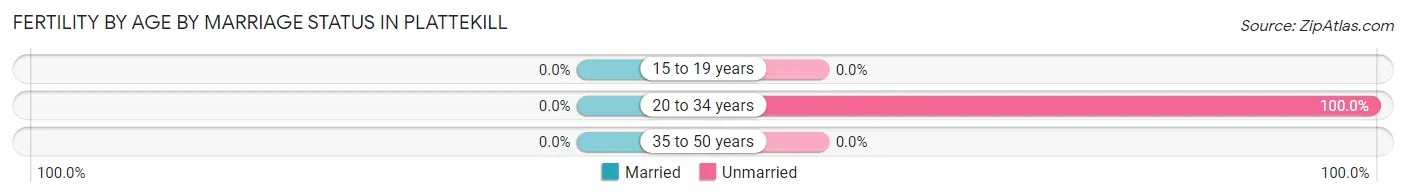
| Age Bracket | Married | Unmarried |
| 15 to 19 years | 0 (0.0%) | 0 (0.0%) |
| 20 to 34 years | 0 (0.0%) | 23 (100.0%) |
| 35 to 50 years | 0 (0.0%) | 0 (0.0%) |
| Total | 0 (0.0%) | 23 (100.0%) |
Fertility by Education in Plattekill
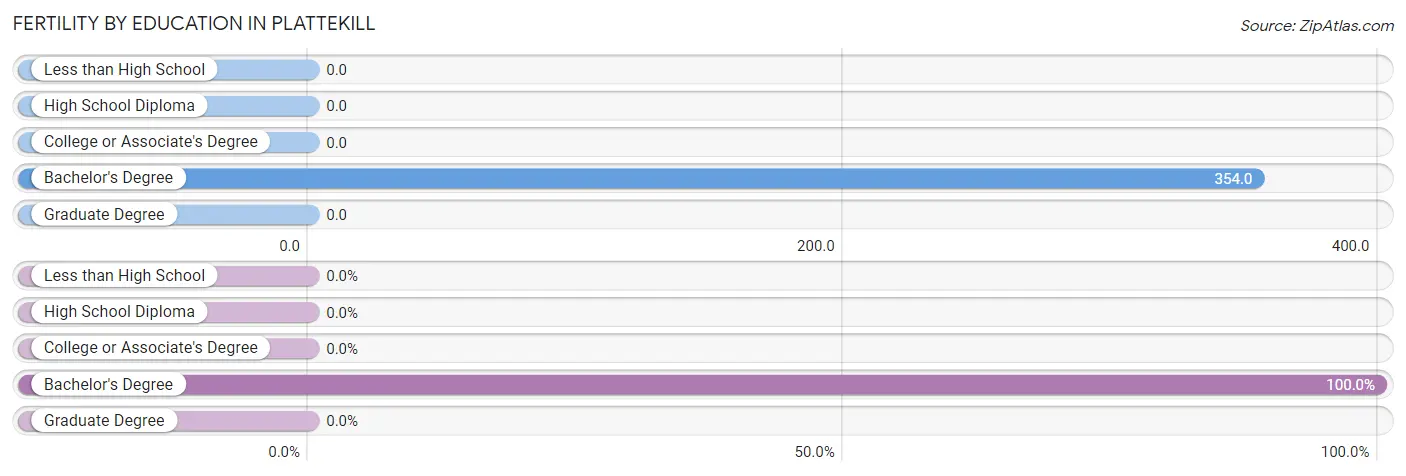
| Educational Attainment | Women with Births | Births / 1,000 Women |
| Less than High School | 0 (0.0%) | 0.0 |
| High School Diploma | 0 (0.0%) | 0.0 |
| College or Associate's Degree | 0 (0.0%) | 0.0 |
| Bachelor's Degree | 23 (100.0%) | 354.0 |
| Graduate Degree | 0 (0.0%) | 0.0 |
| Total | 23 (100.0%) | 58.0 |
Fertility by Education by Marriage Status in Plattekill
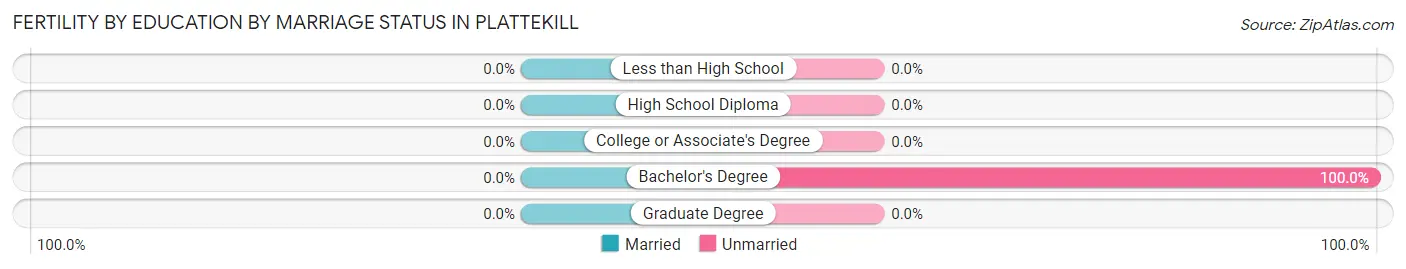
| Educational Attainment | Married | Unmarried |
| Less than High School | 0 (0.0%) | 0 (0.0%) |
| High School Diploma | 0 (0.0%) | 0 (0.0%) |
| College or Associate's Degree | 0 (0.0%) | 0 (0.0%) |
| Bachelor's Degree | 0 (0.0%) | 23 (100.0%) |
| Graduate Degree | 0 (0.0%) | 0 (0.0%) |
| Total | 0 (0.0%) | 23 (100.0%) |
Employment Characteristics in Plattekill
Employment by Class of Employer in Plattekill
Among the 762 employed individuals in Plattekill, private company employees (589 | 77.3%), state government employees (72 | 9.5%), and self-employed (not incorporated) (62 | 8.1%) make up the most common classes of employment.
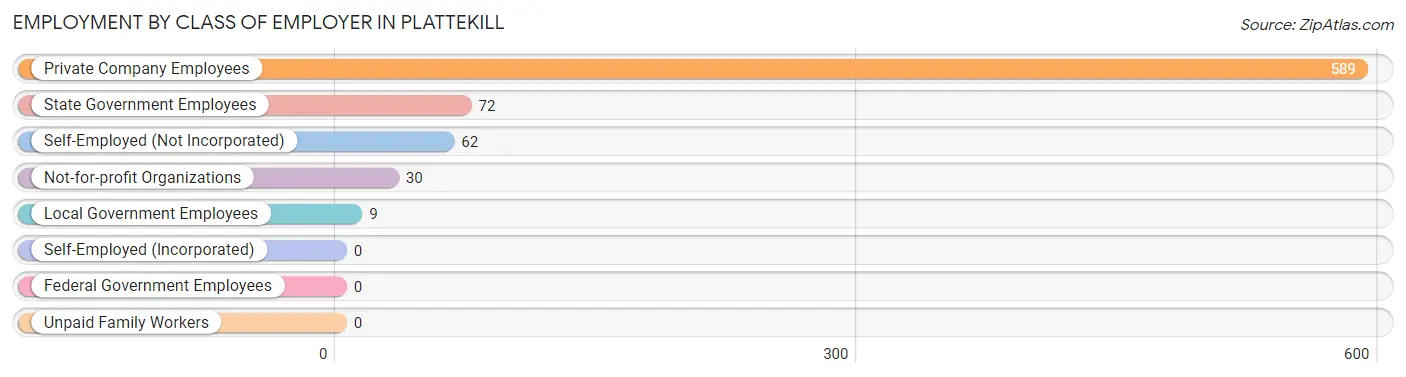
| Employer Class | # Employees | % Employees |
| Private Company Employees | 589 | 77.3% |
| Self-Employed (Incorporated) | 0 | 0.0% |
| Self-Employed (Not Incorporated) | 62 | 8.1% |
| Not-for-profit Organizations | 30 | 3.9% |
| Local Government Employees | 9 | 1.2% |
| State Government Employees | 72 | 9.5% |
| Federal Government Employees | 0 | 0.0% |
| Unpaid Family Workers | 0 | 0.0% |
| Total | 762 | 100.0% |
Employment Status by Age in Plattekill
According to the labor force statistics for Plattekill, out of the total population over 16 years of age (1,088), 71.0% or 772 individuals are in the labor force, with 1.3% or 10 of them unemployed. The age group with the highest labor force participation rate is 25 to 29 years, with 100.0% or 148 individuals in the labor force. Within the labor force, the 55 to 59 years age range has the highest percentage of unemployed individuals, with 35.7% or 10 of them being unemployed.
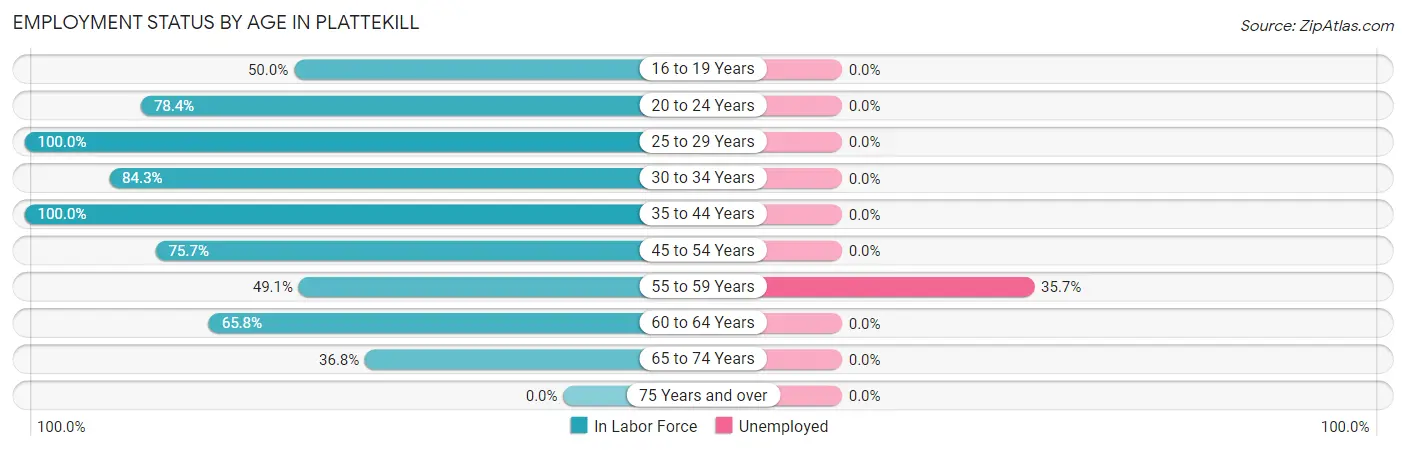
| Age Bracket | In Labor Force | Unemployed |
| 16 to 19 Years | 39 (50.0%) | 0 (0.0%) |
| 20 to 24 Years | 138 (78.4%) | 0 (0.0%) |
| 25 to 29 Years | 148 (100.0%) | 0 (0.0%) |
| 30 to 34 Years | 70 (84.3%) | 0 (0.0%) |
| 35 to 44 Years | 118 (100.0%) | 0 (0.0%) |
| 45 to 54 Years | 131 (75.7%) | 0 (0.0%) |
| 55 to 59 Years | 28 (49.1%) | 10 (35.7%) |
| 60 to 64 Years | 75 (65.8%) | 0 (0.0%) |
| 65 to 74 Years | 25 (36.8%) | 0 (0.0%) |
| 75 Years and over | 0 (0.0%) | 0 (0.0%) |
| Total | 772 (71.0%) | 10 (1.3%) |
Employment Status by Educational Attainment in Plattekill
According to labor force statistics for Plattekill, 82.3% of individuals (570) out of the total population between 25 and 64 years of age (693) are in the labor force, with 1.8% or 10 of them being unemployed. The group with the highest labor force participation rate are those with the educational attainment of less than high school, with 100.0% or 43 individuals in the labor force. Within the labor force, individuals with college / associate degree education have the highest percentage of unemployment, with 10.6% or 10 of them being unemployed.
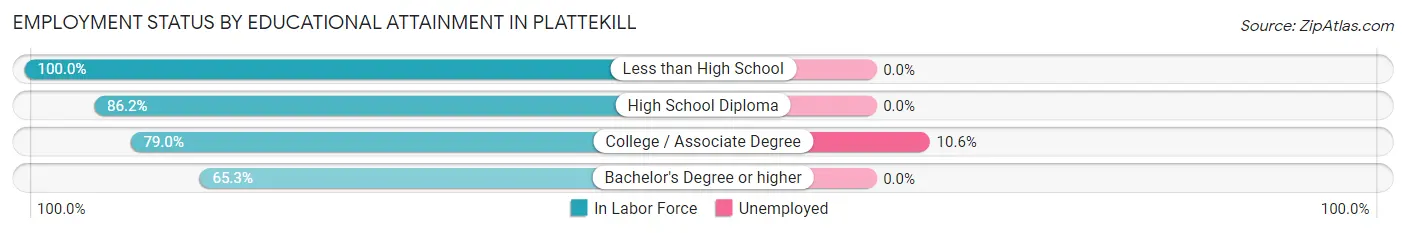
| Educational Attainment | In Labor Force | Unemployed |
| Less than High School | 43 (100.0%) | 0 (0.0%) |
| High School Diploma | 356 (86.2%) | 0 (0.0%) |
| College / Associate Degree | 94 (79.0%) | 13 (10.6%) |
| Bachelor's Degree or higher | 77 (65.3%) | 0 (0.0%) |
| Total | 570 (82.3%) | 12 (1.8%) |
Employment Occupations by Sex in Plattekill
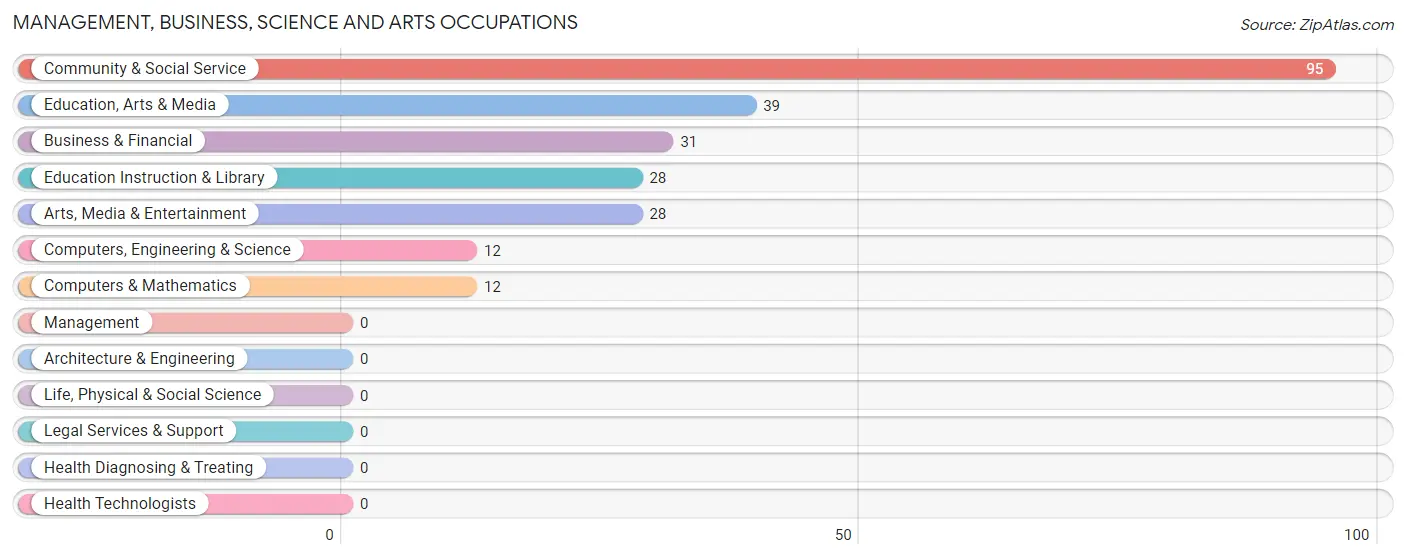
Management, Business, Science and Arts Occupations
The most common Management, Business, Science and Arts occupations in Plattekill are Community & Social Service (95 | 12.5%), Education, Arts & Media (39 | 5.1%), Business & Financial (31 | 4.1%), Education Instruction & Library (28 | 3.7%), and Arts, Media & Entertainment (28 | 3.7%).
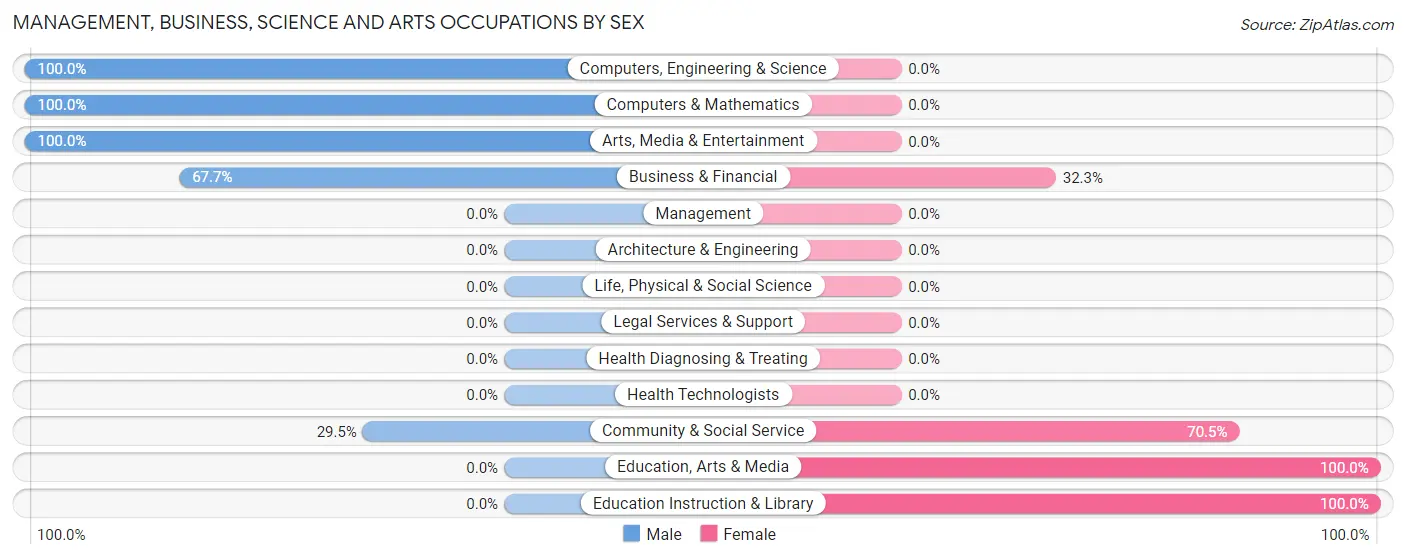
Management, Business, Science and Arts Occupations by Sex
Within the Management, Business, Science and Arts occupations in Plattekill, the most male-oriented occupations are Computers, Engineering & Science (100.0%), Computers & Mathematics (100.0%), and Arts, Media & Entertainment (100.0%), while the most female-oriented occupations are Education, Arts & Media (100.0%), Education Instruction & Library (100.0%), and Community & Social Service (70.5%).
| Occupation | Male | Female |
| Management | 0 (0.0%) | 0 (0.0%) |
| Business & Financial | 21 (67.7%) | 10 (32.3%) |
| Computers, Engineering & Science | 12 (100.0%) | 0 (0.0%) |
| Computers & Mathematics | 12 (100.0%) | 0 (0.0%) |
| Architecture & Engineering | 0 (0.0%) | 0 (0.0%) |
| Life, Physical & Social Science | 0 (0.0%) | 0 (0.0%) |
| Community & Social Service | 28 (29.5%) | 67 (70.5%) |
| Education, Arts & Media | 0 (0.0%) | 39 (100.0%) |
| Legal Services & Support | 0 (0.0%) | 0 (0.0%) |
| Education Instruction & Library | 0 (0.0%) | 28 (100.0%) |
| Arts, Media & Entertainment | 28 (100.0%) | 0 (0.0%) |
| Health Diagnosing & Treating | 0 (0.0%) | 0 (0.0%) |
| Health Technologists | 0 (0.0%) | 0 (0.0%) |
| Total (Category) | 61 (44.2%) | 77 (55.8%) |
| Total (Overall) | 416 (54.6%) | 346 (45.4%) |
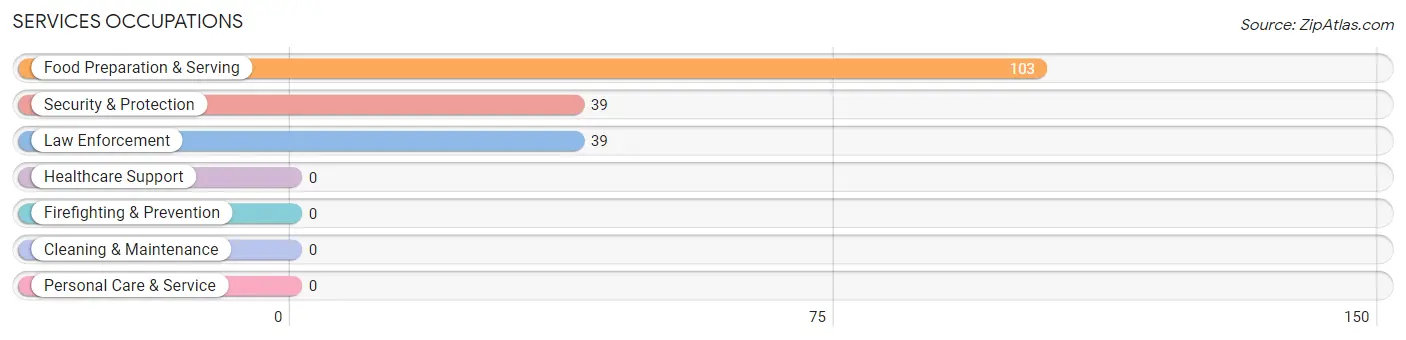
Services Occupations
The most common Services occupations in Plattekill are Food Preparation & Serving (103 | 13.5%), Security & Protection (39 | 5.1%), and Law Enforcement (39 | 5.1%).
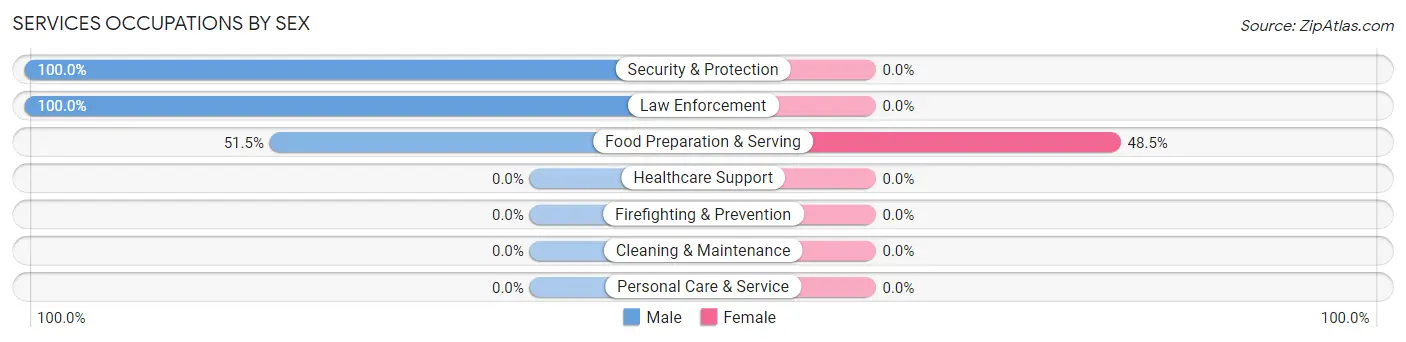
Services Occupations by Sex
| Occupation | Male | Female |
| Healthcare Support | 0 (0.0%) | 0 (0.0%) |
| Security & Protection | 39 (100.0%) | 0 (0.0%) |
| Firefighting & Prevention | 0 (0.0%) | 0 (0.0%) |
| Law Enforcement | 39 (100.0%) | 0 (0.0%) |
| Food Preparation & Serving | 53 (51.5%) | 50 (48.5%) |
| Cleaning & Maintenance | 0 (0.0%) | 0 (0.0%) |
| Personal Care & Service | 0 (0.0%) | 0 (0.0%) |
| Total (Category) | 92 (64.8%) | 50 (35.2%) |
| Total (Overall) | 416 (54.6%) | 346 (45.4%) |
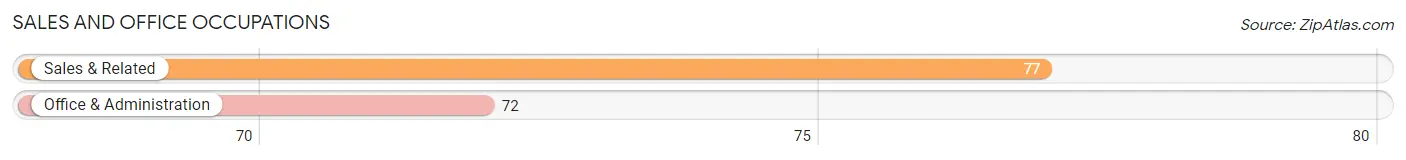
Sales and Office Occupations
The most common Sales and Office occupations in Plattekill are Sales & Related (77 | 10.1%), and Office & Administration (72 | 9.5%).
Sales and Office Occupations by Sex
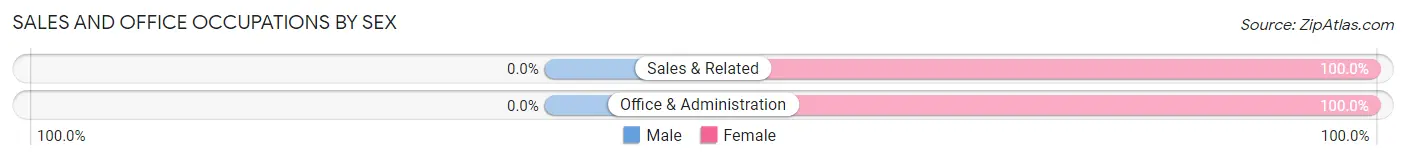
| Occupation | Male | Female |
| Sales & Related | 0 (0.0%) | 77 (100.0%) |
| Office & Administration | 0 (0.0%) | 72 (100.0%) |
| Total (Category) | 0 (0.0%) | 149 (100.0%) |
| Total (Overall) | 416 (54.6%) | 346 (45.4%) |
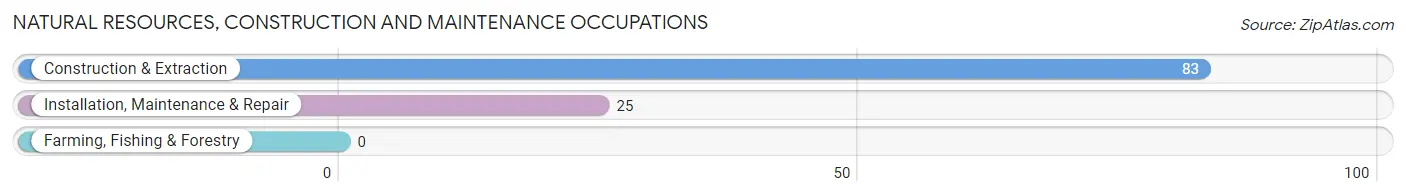
Natural Resources, Construction and Maintenance Occupations
The most common Natural Resources, Construction and Maintenance occupations in Plattekill are Construction & Extraction (83 | 10.9%), and Installation, Maintenance & Repair (25 | 3.3%).
Natural Resources, Construction and Maintenance Occupations by Sex
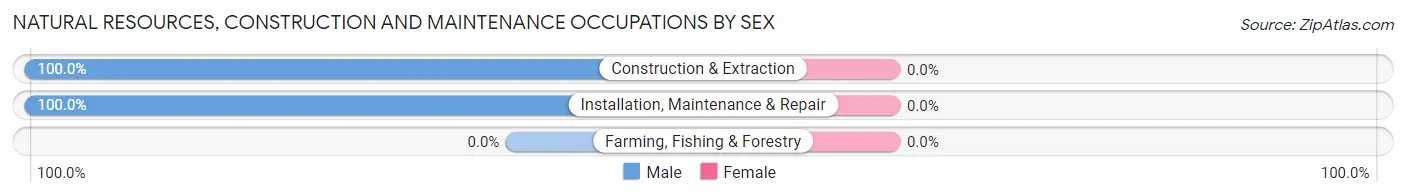
| Occupation | Male | Female |
| Farming, Fishing & Forestry | 0 (0.0%) | 0 (0.0%) |
| Construction & Extraction | 83 (100.0%) | 0 (0.0%) |
| Installation, Maintenance & Repair | 25 (100.0%) | 0 (0.0%) |
| Total (Category) | 108 (100.0%) | 0 (0.0%) |
| Total (Overall) | 416 (54.6%) | 346 (45.4%) |
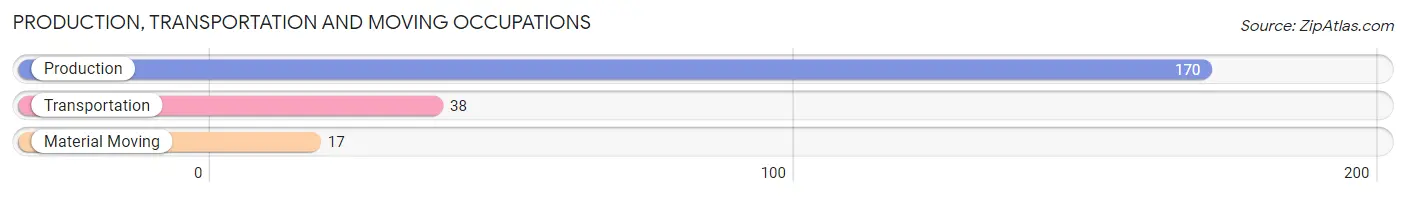
Production, Transportation and Moving Occupations
The most common Production, Transportation and Moving occupations in Plattekill are Production (170 | 22.3%), Transportation (38 | 5.0%), and Material Moving (17 | 2.2%).
Production, Transportation and Moving Occupations by Sex
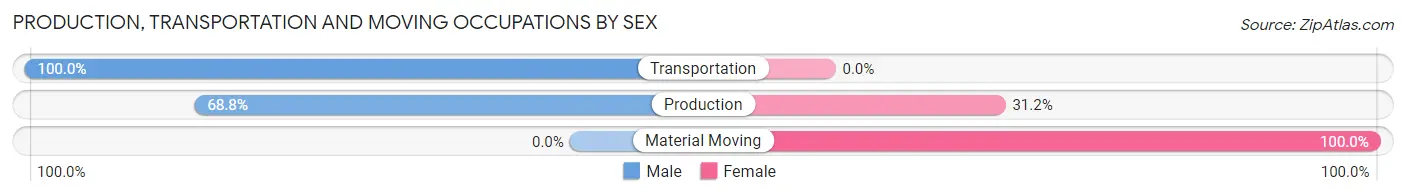
| Occupation | Male | Female |
| Production | 117 (68.8%) | 53 (31.2%) |
| Transportation | 38 (100.0%) | 0 (0.0%) |
| Material Moving | 0 (0.0%) | 17 (100.0%) |
| Total (Category) | 155 (68.9%) | 70 (31.1%) |
| Total (Overall) | 416 (54.6%) | 346 (45.4%) |
Employment Industries by Sex in Plattekill
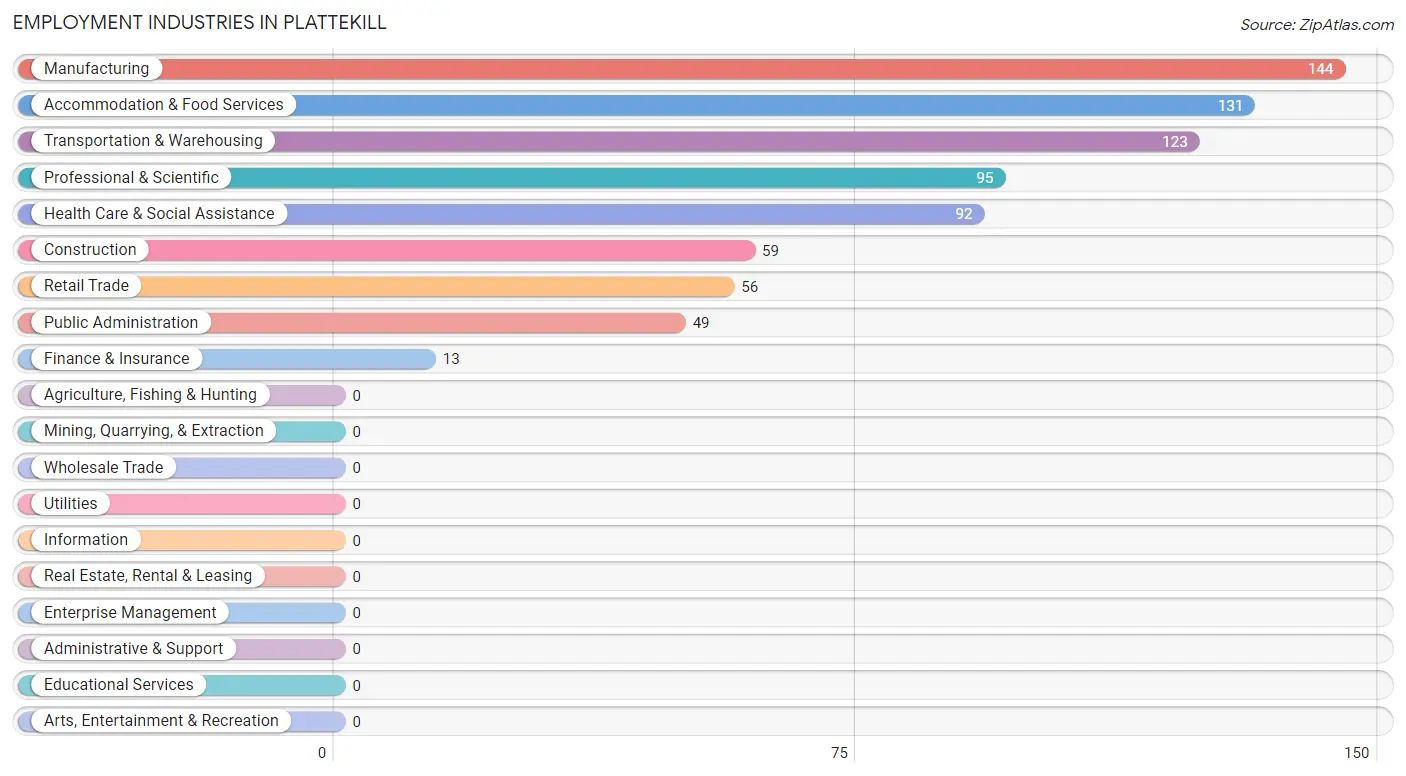
Employment Industries in Plattekill
The major employment industries in Plattekill include Manufacturing (144 | 18.9%), Accommodation & Food Services (131 | 17.2%), Transportation & Warehousing (123 | 16.1%), Professional & Scientific (95 | 12.5%), and Health Care & Social Assistance (92 | 12.1%).
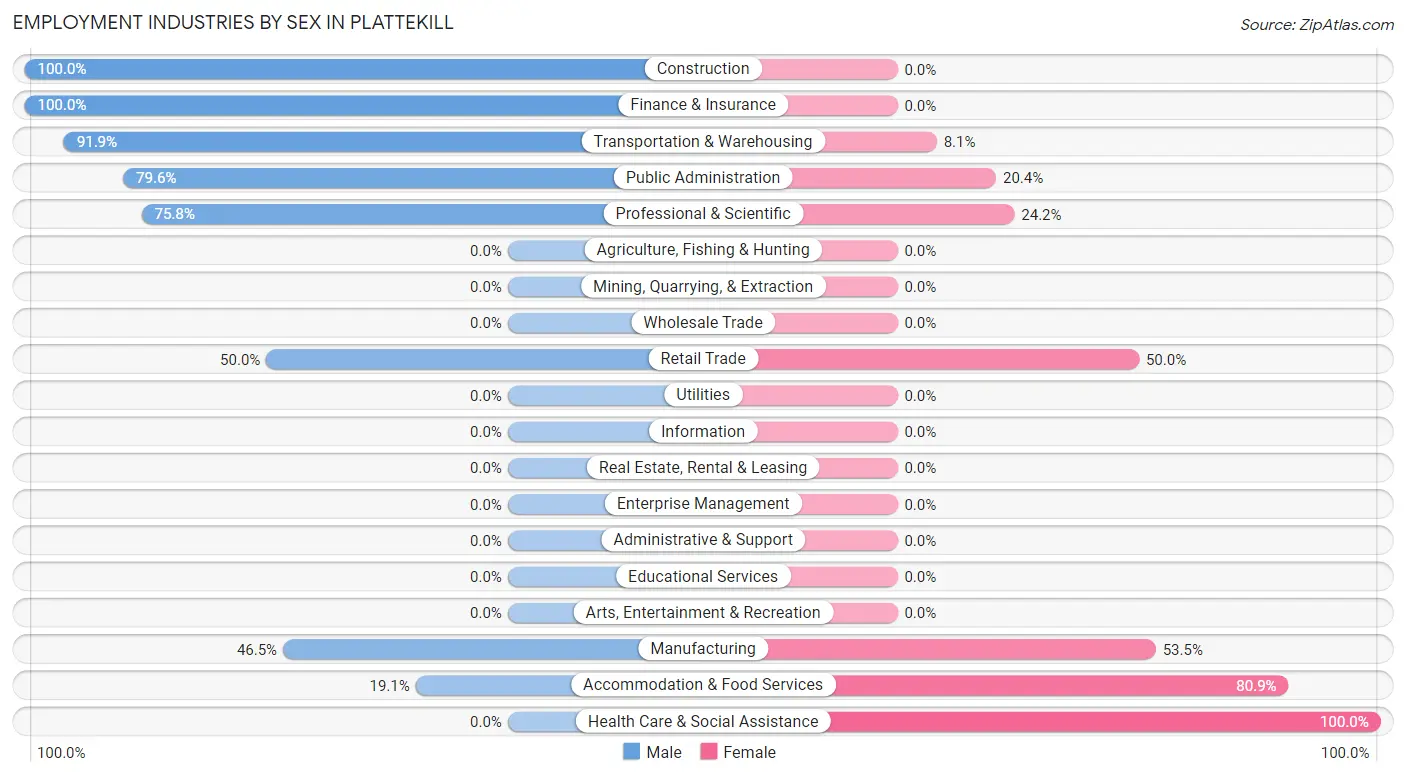
Employment Industries by Sex in Plattekill
The Plattekill industries that see more men than women are Construction (100.0%), Finance & Insurance (100.0%), and Transportation & Warehousing (91.9%), whereas the industries that tend to have a higher number of women are Health Care & Social Assistance (100.0%), Accommodation & Food Services (80.9%), and Manufacturing (53.5%).
| Industry | Male | Female |
| Agriculture, Fishing & Hunting | 0 (0.0%) | 0 (0.0%) |
| Mining, Quarrying, & Extraction | 0 (0.0%) | 0 (0.0%) |
| Construction | 59 (100.0%) | 0 (0.0%) |
| Manufacturing | 67 (46.5%) | 77 (53.5%) |
| Wholesale Trade | 0 (0.0%) | 0 (0.0%) |
| Retail Trade | 28 (50.0%) | 28 (50.0%) |
| Transportation & Warehousing | 113 (91.9%) | 10 (8.1%) |
| Utilities | 0 (0.0%) | 0 (0.0%) |
| Information | 0 (0.0%) | 0 (0.0%) |
| Finance & Insurance | 13 (100.0%) | 0 (0.0%) |
| Real Estate, Rental & Leasing | 0 (0.0%) | 0 (0.0%) |
| Professional & Scientific | 72 (75.8%) | 23 (24.2%) |
| Enterprise Management | 0 (0.0%) | 0 (0.0%) |
| Administrative & Support | 0 (0.0%) | 0 (0.0%) |
| Educational Services | 0 (0.0%) | 0 (0.0%) |
| Health Care & Social Assistance | 0 (0.0%) | 92 (100.0%) |
| Arts, Entertainment & Recreation | 0 (0.0%) | 0 (0.0%) |
| Accommodation & Food Services | 25 (19.1%) | 106 (80.9%) |
| Public Administration | 39 (79.6%) | 10 (20.4%) |
| Total | 416 (54.6%) | 346 (45.4%) |
Education in Plattekill
School Enrollment in Plattekill
The most common levels of schooling among the 412 students in Plattekill are elementary school (128 | 31.1%), high school (104 | 25.2%), and college / undergraduate (82 | 19.9%).
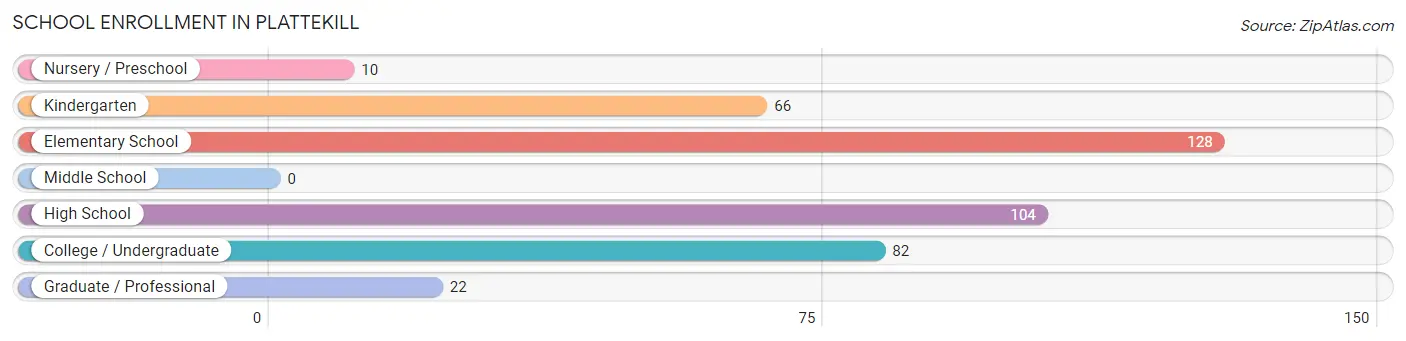
| School Level | # Students | % Students |
| Nursery / Preschool | 10 | 2.4% |
| Kindergarten | 66 | 16.0% |
| Elementary School | 128 | 31.1% |
| Middle School | 0 | 0.0% |
| High School | 104 | 25.2% |
| College / Undergraduate | 82 | 19.9% |
| Graduate / Professional | 22 | 5.3% |
| Total | 412 | 100.0% |
School Enrollment by Age by Funding Source in Plattekill
Out of a total of 412 students who are enrolled in schools in Plattekill, 19 (4.6%) attend a private institution, while the remaining 393 (95.4%) are enrolled in public schools. The age group of 20 to 24 year olds has the highest likelihood of being enrolled in private schools, with 19 (23.5% in the age bracket) enrolled. Conversely, the age group of 3 to 4 year olds has the lowest likelihood of being enrolled in a private school, with 10 (100.0% in the age bracket) attending a public institution.
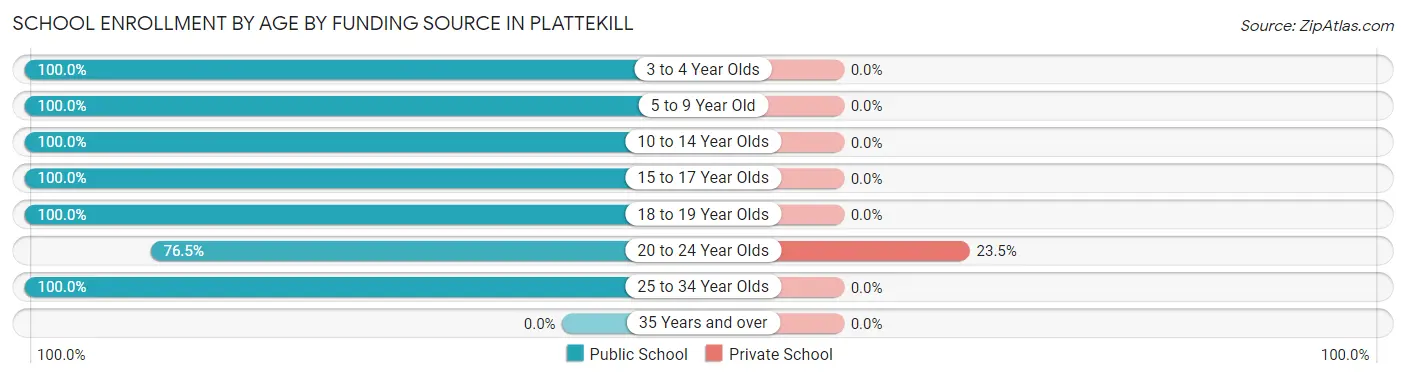
| Age Bracket | Public School | Private School |
| 3 to 4 Year Olds | 10 (100.0%) | 0 (0.0%) |
| 5 to 9 Year Old | 194 (100.0%) | 0 (0.0%) |
| 10 to 14 Year Olds | 10 (100.0%) | 0 (0.0%) |
| 15 to 17 Year Olds | 70 (100.0%) | 0 (0.0%) |
| 18 to 19 Year Olds | 34 (100.0%) | 0 (0.0%) |
| 20 to 24 Year Olds | 62 (76.5%) | 19 (23.5%) |
| 25 to 34 Year Olds | 13 (100.0%) | 0 (0.0%) |
| 35 Years and over | 0 (0.0%) | 0 (0.0%) |
| Total | 393 (95.4%) | 19 (4.6%) |
Educational Attainment by Field of Study in Plattekill
Science & technology (30 | 25.4%), engineering (28 | 23.7%), visual & performing arts (28 | 23.7%), business (19 | 16.1%), and arts & humanities (13 | 11.0%) are the most common fields of study among 118 individuals in Plattekill who have obtained a bachelor's degree or higher.
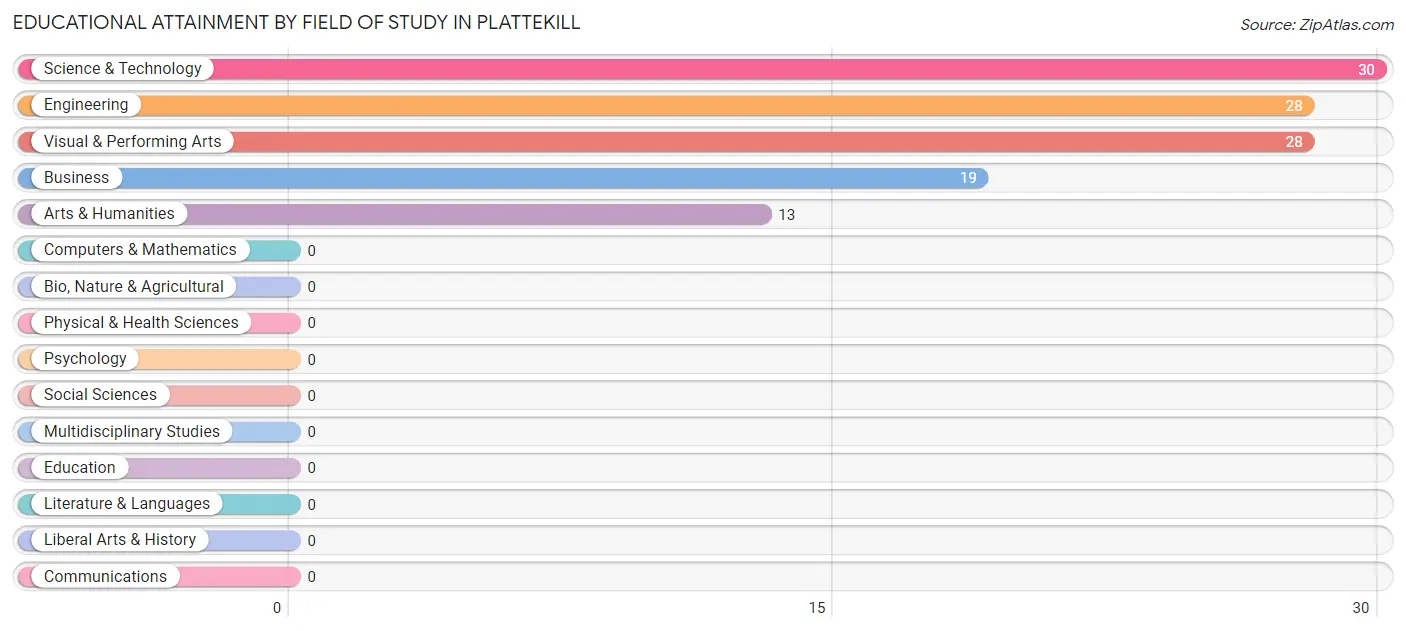
| Field of Study | # Graduates | % Graduates |
| Computers & Mathematics | 0 | 0.0% |
| Bio, Nature & Agricultural | 0 | 0.0% |
| Physical & Health Sciences | 0 | 0.0% |
| Psychology | 0 | 0.0% |
| Social Sciences | 0 | 0.0% |
| Engineering | 28 | 23.7% |
| Multidisciplinary Studies | 0 | 0.0% |
| Science & Technology | 30 | 25.4% |
| Business | 19 | 16.1% |
| Education | 0 | 0.0% |
| Literature & Languages | 0 | 0.0% |
| Liberal Arts & History | 0 | 0.0% |
| Visual & Performing Arts | 28 | 23.7% |
| Communications | 0 | 0.0% |
| Arts & Humanities | 13 | 11.0% |
| Total | 118 | 100.0% |
Transportation & Commute in Plattekill
Vehicle Availability by Sex in Plattekill
The most prevalent vehicle ownership categories in Plattekill are males with 2 vehicles (153, accounting for 36.8%) and females with 2 vehicles (86, making up 44.2%).
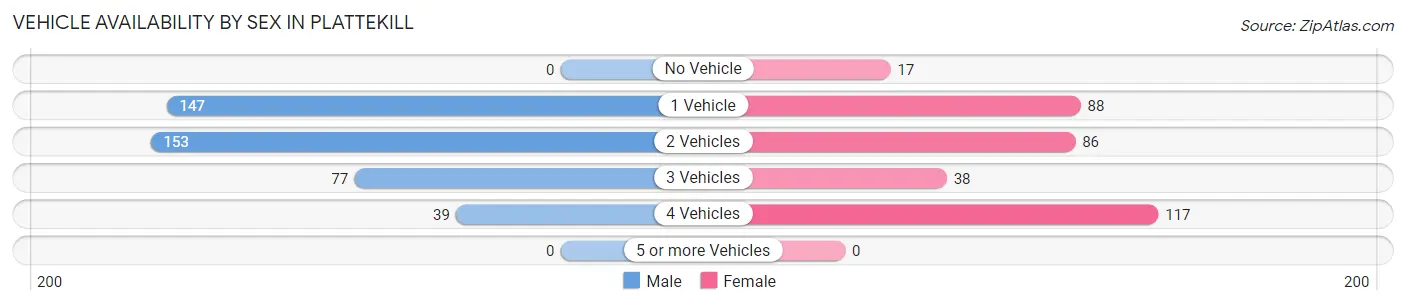
| Vehicles Available | Male | Female |
| No Vehicle | 0 (0.0%) | 17 (4.9%) |
| 1 Vehicle | 147 (35.3%) | 88 (25.4%) |
| 2 Vehicles | 153 (36.8%) | 86 (24.9%) |
| 3 Vehicles | 77 (18.5%) | 38 (11.0%) |
| 4 Vehicles | 39 (9.4%) | 117 (33.8%) |
| 5 or more Vehicles | 0 (0.0%) | 0 (0.0%) |
| Total | 416 (100.0%) | 346 (100.0%) |
Commute Time in Plattekill
The most frequently occuring commute durations in Plattekill are 10 to 14 minutes (124 commuters, 17.7%), 15 to 19 minutes (113 commuters, 16.1%), and 45 to 59 minutes (95 commuters, 13.6%).
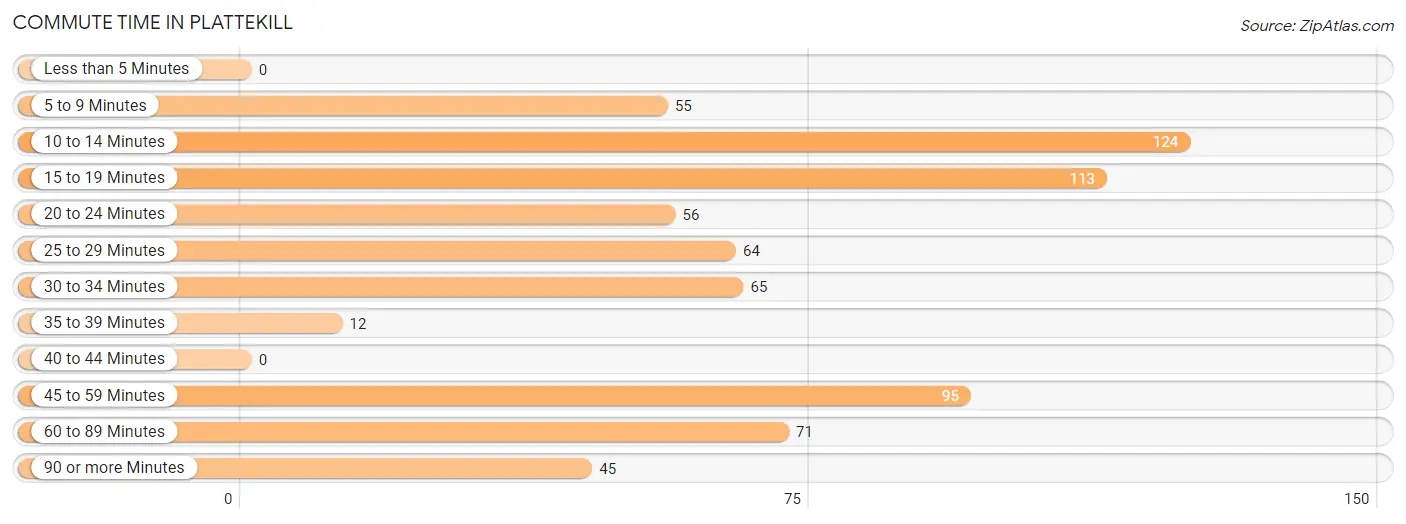
| Commute Time | # Commuters | % Commuters |
| Less than 5 Minutes | 0 | 0.0% |
| 5 to 9 Minutes | 55 | 7.9% |
| 10 to 14 Minutes | 124 | 17.7% |
| 15 to 19 Minutes | 113 | 16.1% |
| 20 to 24 Minutes | 56 | 8.0% |
| 25 to 29 Minutes | 64 | 9.1% |
| 30 to 34 Minutes | 65 | 9.3% |
| 35 to 39 Minutes | 12 | 1.7% |
| 40 to 44 Minutes | 0 | 0.0% |
| 45 to 59 Minutes | 95 | 13.6% |
| 60 to 89 Minutes | 71 | 10.1% |
| 90 or more Minutes | 45 | 6.4% |
Commute Time by Sex in Plattekill
The most common commute times in Plattekill are 45 to 59 minutes (95 commuters, 26.8%) for males and 15 to 19 minutes (113 commuters, 32.7%) for females.
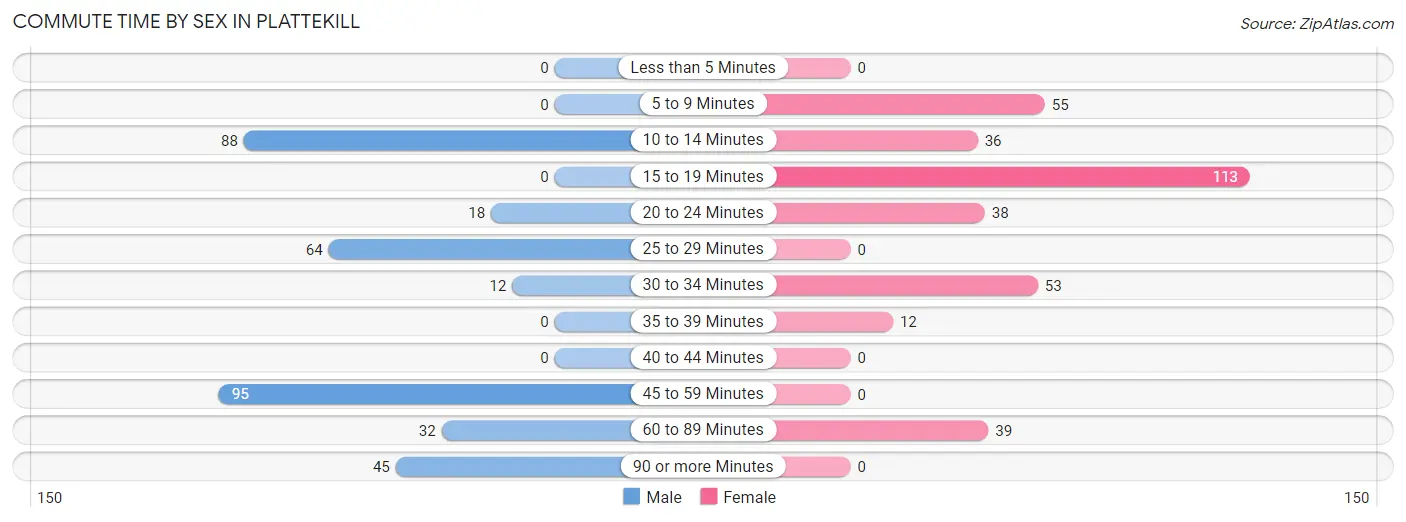
| Commute Time | Male | Female |
| Less than 5 Minutes | 0 (0.0%) | 0 (0.0%) |
| 5 to 9 Minutes | 0 (0.0%) | 55 (15.9%) |
| 10 to 14 Minutes | 88 (24.9%) | 36 (10.4%) |
| 15 to 19 Minutes | 0 (0.0%) | 113 (32.7%) |
| 20 to 24 Minutes | 18 (5.1%) | 38 (11.0%) |
| 25 to 29 Minutes | 64 (18.1%) | 0 (0.0%) |
| 30 to 34 Minutes | 12 (3.4%) | 53 (15.3%) |
| 35 to 39 Minutes | 0 (0.0%) | 12 (3.5%) |
| 40 to 44 Minutes | 0 (0.0%) | 0 (0.0%) |
| 45 to 59 Minutes | 95 (26.8%) | 0 (0.0%) |
| 60 to 89 Minutes | 32 (9.0%) | 39 (11.3%) |
| 90 or more Minutes | 45 (12.7%) | 0 (0.0%) |
Time of Departure to Work by Sex in Plattekill
The most frequent times of departure to work in Plattekill are 9:00 AM to 9:59 AM (95, 26.8%) for males and 5:00 AM to 5:29 AM (81, 23.4%) for females.
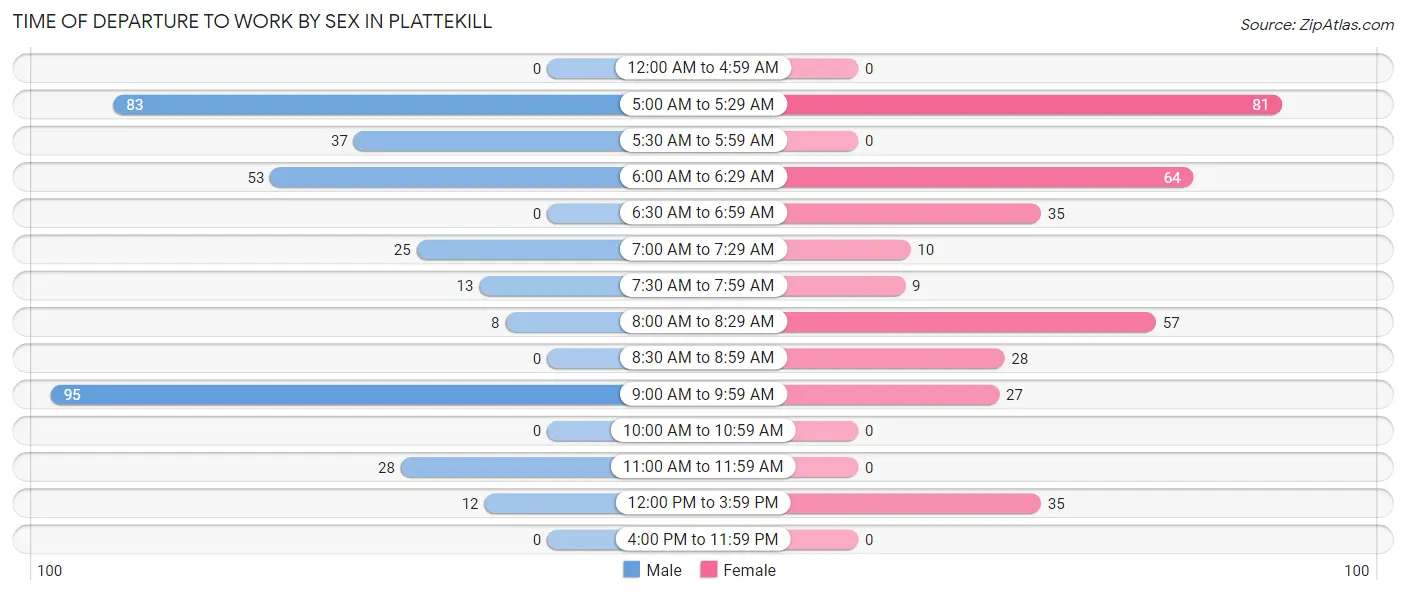
| Time of Departure | Male | Female |
| 12:00 AM to 4:59 AM | 0 (0.0%) | 0 (0.0%) |
| 5:00 AM to 5:29 AM | 83 (23.4%) | 81 (23.4%) |
| 5:30 AM to 5:59 AM | 37 (10.4%) | 0 (0.0%) |
| 6:00 AM to 6:29 AM | 53 (15.0%) | 64 (18.5%) |
| 6:30 AM to 6:59 AM | 0 (0.0%) | 35 (10.1%) |
| 7:00 AM to 7:29 AM | 25 (7.1%) | 10 (2.9%) |
| 7:30 AM to 7:59 AM | 13 (3.7%) | 9 (2.6%) |
| 8:00 AM to 8:29 AM | 8 (2.3%) | 57 (16.5%) |
| 8:30 AM to 8:59 AM | 0 (0.0%) | 28 (8.1%) |
| 9:00 AM to 9:59 AM | 95 (26.8%) | 27 (7.8%) |
| 10:00 AM to 10:59 AM | 0 (0.0%) | 0 (0.0%) |
| 11:00 AM to 11:59 AM | 28 (7.9%) | 0 (0.0%) |
| 12:00 PM to 3:59 PM | 12 (3.4%) | 35 (10.1%) |
| 4:00 PM to 11:59 PM | 0 (0.0%) | 0 (0.0%) |
| Total | 354 (100.0%) | 346 (100.0%) |
Housing Occupancy in Plattekill
Occupancy by Ownership in Plattekill
Of the total 520 dwellings in Plattekill, owner-occupied units account for 220 (42.3%), while renter-occupied units make up 300 (57.7%).
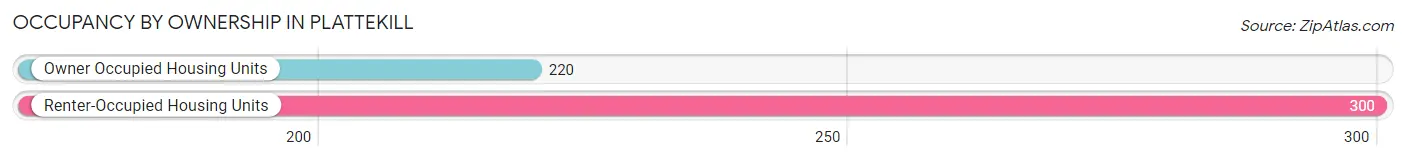
| Occupancy | # Housing Units | % Housing Units |
| Owner Occupied Housing Units | 220 | 42.3% |
| Renter-Occupied Housing Units | 300 | 57.7% |
| Total Occupied Housing Units | 520 | 100.0% |
Occupancy by Household Size in Plattekill
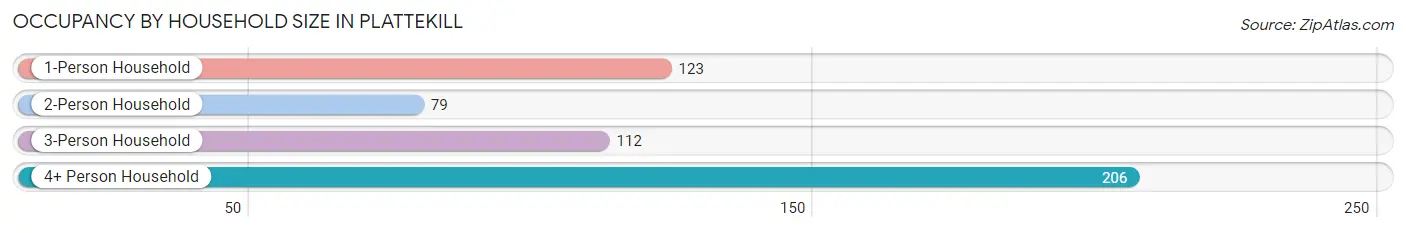
| Household Size | # Housing Units | % Housing Units |
| 1-Person Household | 123 | 23.6% |
| 2-Person Household | 79 | 15.2% |
| 3-Person Household | 112 | 21.5% |
| 4+ Person Household | 206 | 39.6% |
| Total Housing Units | 520 | 100.0% |
Occupancy by Ownership by Household Size in Plattekill
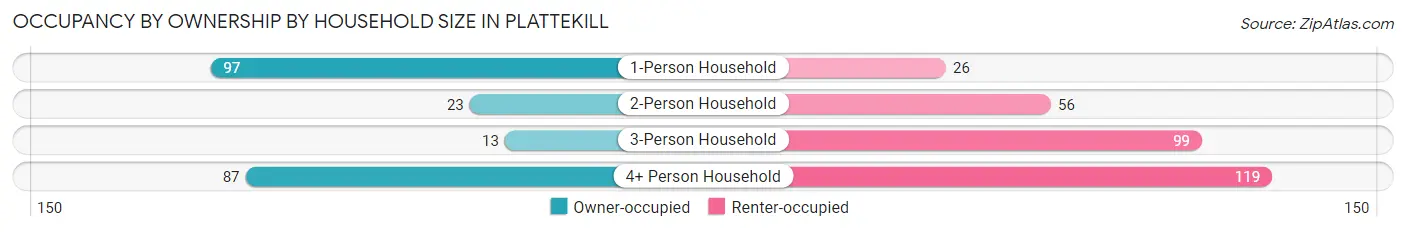
| Household Size | Owner-occupied | Renter-occupied |
| 1-Person Household | 97 (78.9%) | 26 (21.1%) |
| 2-Person Household | 23 (29.1%) | 56 (70.9%) |
| 3-Person Household | 13 (11.6%) | 99 (88.4%) |
| 4+ Person Household | 87 (42.2%) | 119 (57.8%) |
| Total Housing Units | 220 (42.3%) | 300 (57.7%) |
Occupancy by Educational Attainment in Plattekill
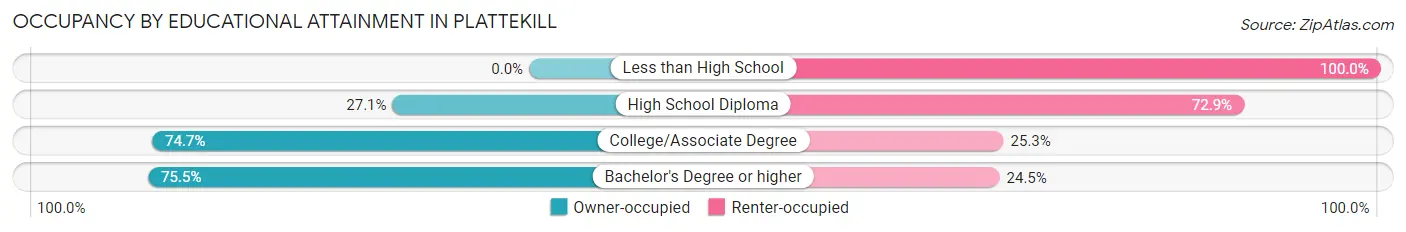
| Household Size | Owner-occupied | Renter-occupied |
| Less than High School | 0 (0.0%) | 36 (100.0%) |
| High School Diploma | 81 (27.1%) | 218 (72.9%) |
| College/Associate Degree | 68 (74.7%) | 23 (25.3%) |
| Bachelor's Degree or higher | 71 (75.5%) | 23 (24.5%) |
Occupancy by Age of Householder in Plattekill
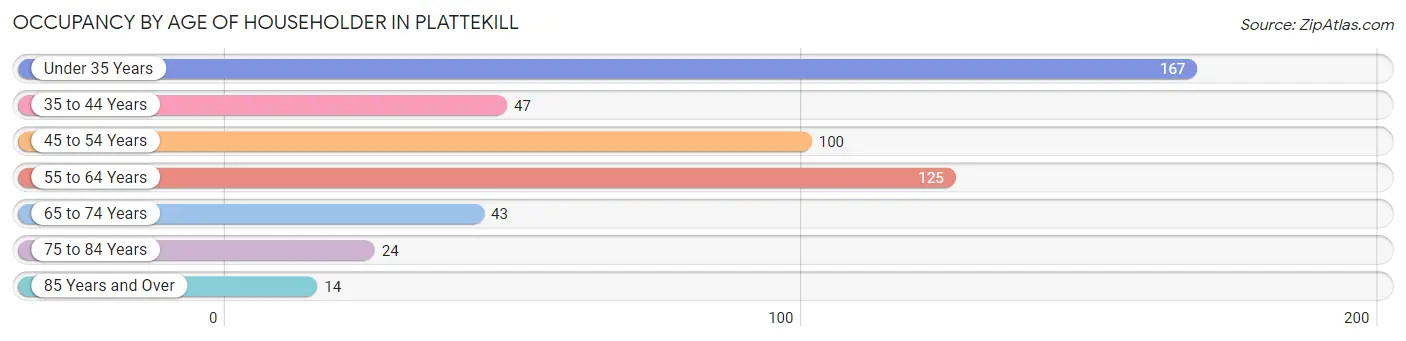
| Age Bracket | # Households | % Households |
| Under 35 Years | 167 | 32.1% |
| 35 to 44 Years | 47 | 9.0% |
| 45 to 54 Years | 100 | 19.2% |
| 55 to 64 Years | 125 | 24.0% |
| 65 to 74 Years | 43 | 8.3% |
| 75 to 84 Years | 24 | 4.6% |
| 85 Years and Over | 14 | 2.7% |
| Total | 520 | 100.0% |
Housing Finances in Plattekill
Median Income by Occupancy in Plattekill
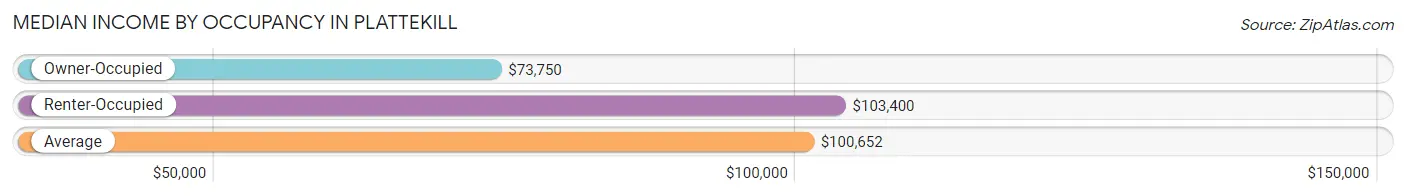
| Occupancy Type | # Households | Median Income |
| Owner-Occupied | 220 (42.3%) | $73,750 |
| Renter-Occupied | 300 (57.7%) | $103,400 |
| Average | 520 (100.0%) | $100,652 |
Occupancy by Householder Income Bracket in Plattekill
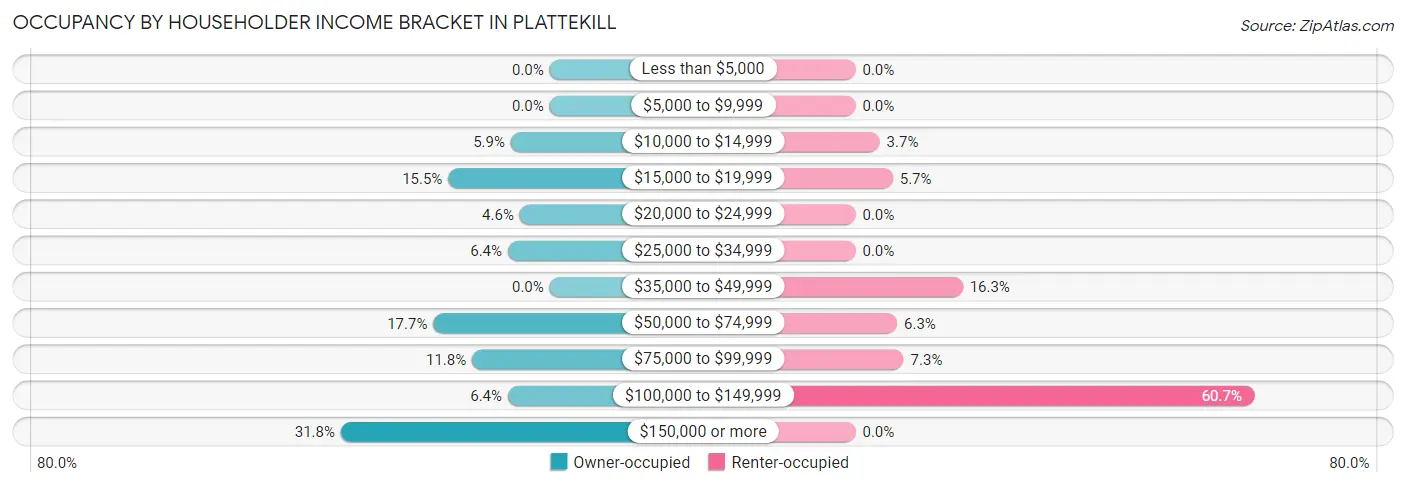
| Income Bracket | Owner-occupied | Renter-occupied |
| Less than $5,000 | 0 (0.0%) | 0 (0.0%) |
| $5,000 to $9,999 | 0 (0.0%) | 0 (0.0%) |
| $10,000 to $14,999 | 13 (5.9%) | 11 (3.7%) |
| $15,000 to $19,999 | 34 (15.4%) | 17 (5.7%) |
| $20,000 to $24,999 | 10 (4.5%) | 0 (0.0%) |
| $25,000 to $34,999 | 14 (6.4%) | 0 (0.0%) |
| $35,000 to $49,999 | 0 (0.0%) | 49 (16.3%) |
| $50,000 to $74,999 | 39 (17.7%) | 19 (6.3%) |
| $75,000 to $99,999 | 26 (11.8%) | 22 (7.3%) |
| $100,000 to $149,999 | 14 (6.4%) | 182 (60.7%) |
| $150,000 or more | 70 (31.8%) | 0 (0.0%) |
| Total | 220 (100.0%) | 300 (100.0%) |
Monthly Housing Cost Tiers in Plattekill
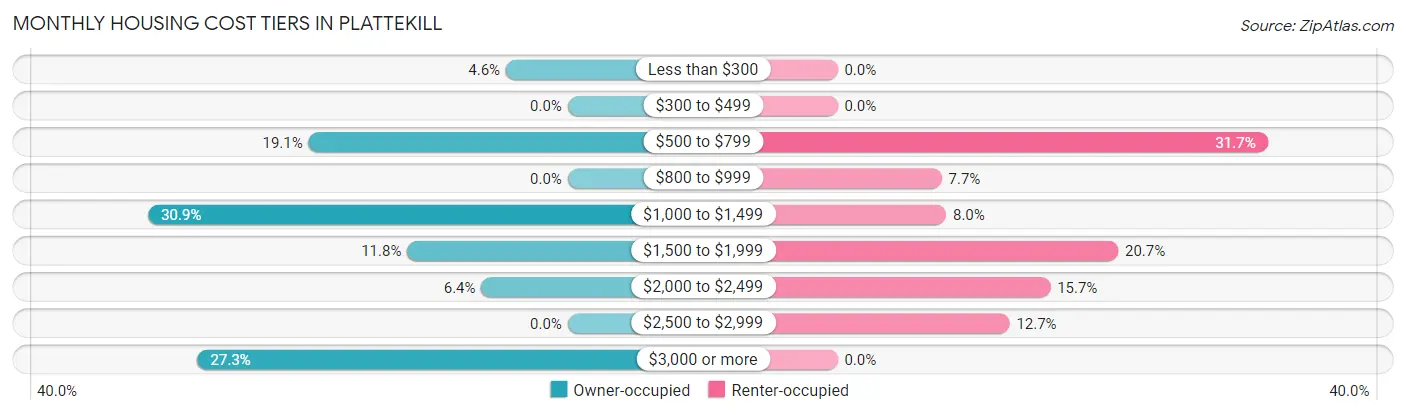
| Monthly Cost | Owner-occupied | Renter-occupied |
| Less than $300 | 10 (4.5%) | 0 (0.0%) |
| $300 to $499 | 0 (0.0%) | 0 (0.0%) |
| $500 to $799 | 42 (19.1%) | 95 (31.7%) |
| $800 to $999 | 0 (0.0%) | 23 (7.7%) |
| $1,000 to $1,499 | 68 (30.9%) | 24 (8.0%) |
| $1,500 to $1,999 | 26 (11.8%) | 62 (20.7%) |
| $2,000 to $2,499 | 14 (6.4%) | 47 (15.7%) |
| $2,500 to $2,999 | 0 (0.0%) | 38 (12.7%) |
| $3,000 or more | 60 (27.3%) | 0 (0.0%) |
| Total | 220 (100.0%) | 300 (100.0%) |
Physical Housing Characteristics in Plattekill
Housing Structures in Plattekill
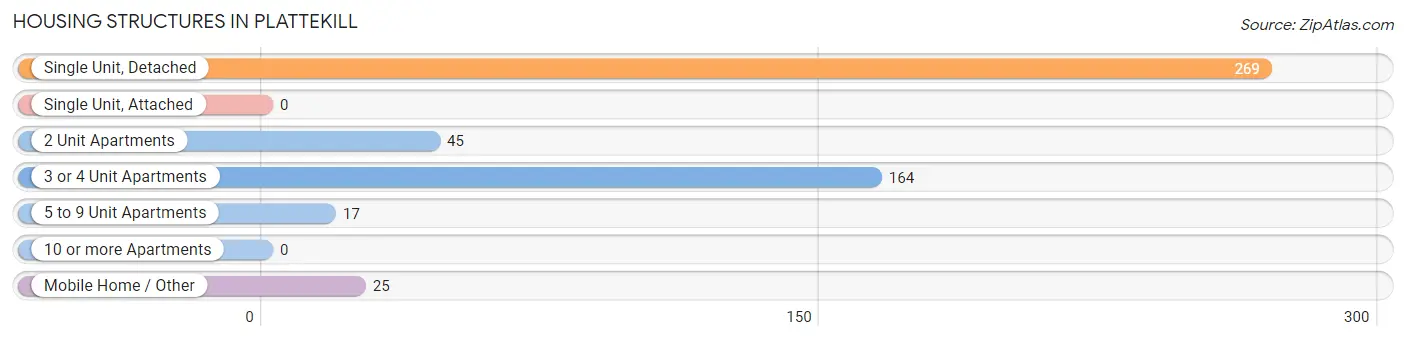
| Structure Type | # Housing Units | % Housing Units |
| Single Unit, Detached | 269 | 51.7% |
| Single Unit, Attached | 0 | 0.0% |
| 2 Unit Apartments | 45 | 8.6% |
| 3 or 4 Unit Apartments | 164 | 31.5% |
| 5 to 9 Unit Apartments | 17 | 3.3% |
| 10 or more Apartments | 0 | 0.0% |
| Mobile Home / Other | 25 | 4.8% |
| Total | 520 | 100.0% |
Housing Structures by Occupancy in Plattekill
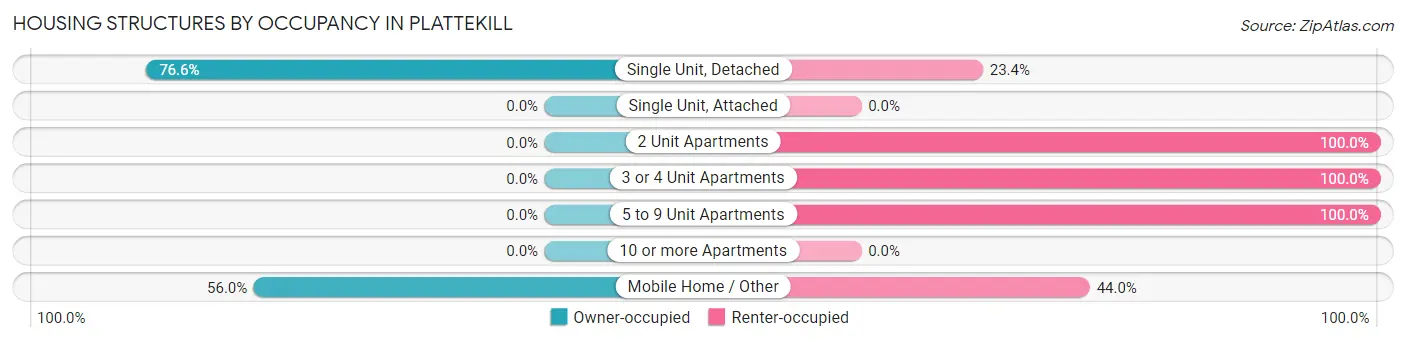
| Structure Type | Owner-occupied | Renter-occupied |
| Single Unit, Detached | 206 (76.6%) | 63 (23.4%) |
| Single Unit, Attached | 0 (0.0%) | 0 (0.0%) |
| 2 Unit Apartments | 0 (0.0%) | 45 (100.0%) |
| 3 or 4 Unit Apartments | 0 (0.0%) | 164 (100.0%) |
| 5 to 9 Unit Apartments | 0 (0.0%) | 17 (100.0%) |
| 10 or more Apartments | 0 (0.0%) | 0 (0.0%) |
| Mobile Home / Other | 14 (56.0%) | 11 (44.0%) |
| Total | 220 (42.3%) | 300 (57.7%) |
Housing Structures by Number of Rooms in Plattekill
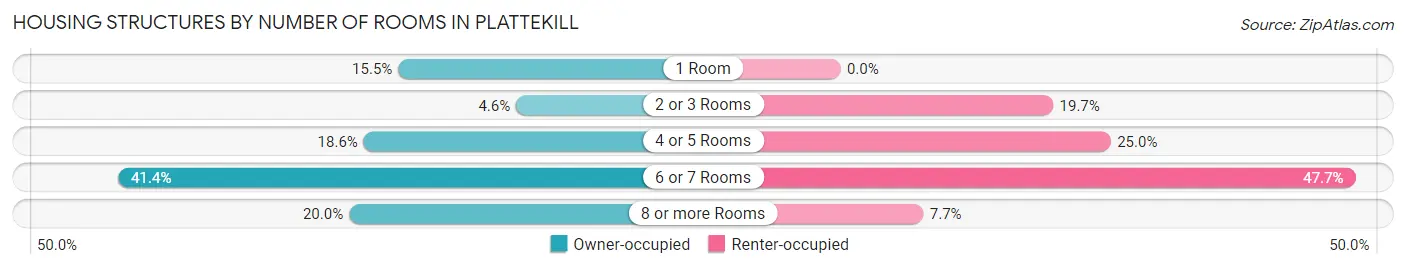
| Number of Rooms | Owner-occupied | Renter-occupied |
| 1 Room | 34 (15.4%) | 0 (0.0%) |
| 2 or 3 Rooms | 10 (4.5%) | 59 (19.7%) |
| 4 or 5 Rooms | 41 (18.6%) | 75 (25.0%) |
| 6 or 7 Rooms | 91 (41.4%) | 143 (47.7%) |
| 8 or more Rooms | 44 (20.0%) | 23 (7.7%) |
| Total | 220 (100.0%) | 300 (100.0%) |
Housing Structure by Heating Type in Plattekill
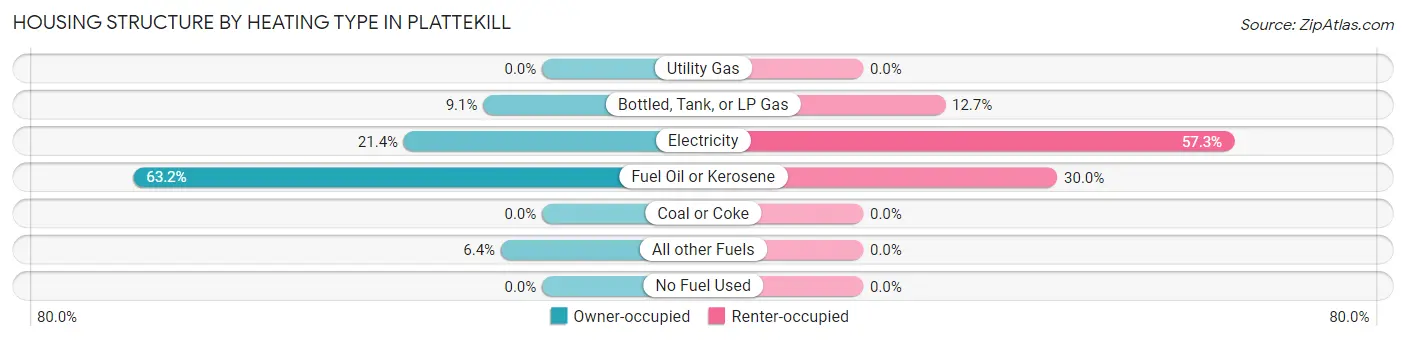
| Heating Type | Owner-occupied | Renter-occupied |
| Utility Gas | 0 (0.0%) | 0 (0.0%) |
| Bottled, Tank, or LP Gas | 20 (9.1%) | 38 (12.7%) |
| Electricity | 47 (21.4%) | 172 (57.3%) |
| Fuel Oil or Kerosene | 139 (63.2%) | 90 (30.0%) |
| Coal or Coke | 0 (0.0%) | 0 (0.0%) |
| All other Fuels | 14 (6.4%) | 0 (0.0%) |
| No Fuel Used | 0 (0.0%) | 0 (0.0%) |
| Total | 220 (100.0%) | 300 (100.0%) |
Household Vehicle Usage in Plattekill
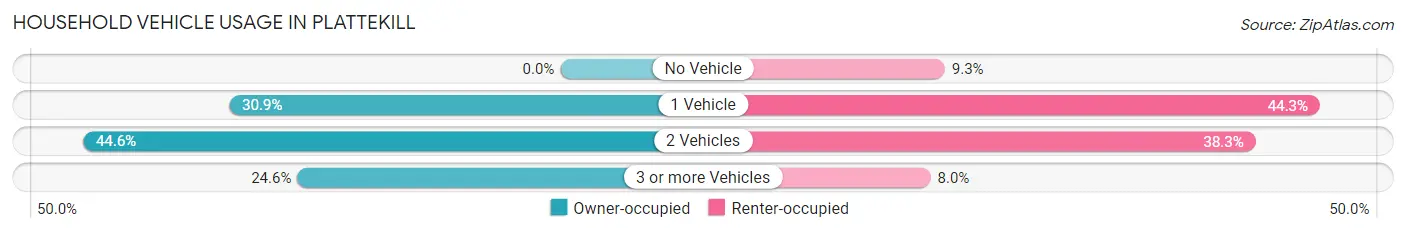
| Vehicles per Household | Owner-occupied | Renter-occupied |
| No Vehicle | 0 (0.0%) | 28 (9.3%) |
| 1 Vehicle | 68 (30.9%) | 133 (44.3%) |
| 2 Vehicles | 98 (44.6%) | 115 (38.3%) |
| 3 or more Vehicles | 54 (24.5%) | 24 (8.0%) |
| Total | 220 (100.0%) | 300 (100.0%) |
Real Estate & Mortgages in Plattekill
Real Estate and Mortgage Overview in Plattekill
| Characteristic | Without Mortgage | With Mortgage |
| Housing Units | 65 | 155 |
| Median Property Value | $191,300 | $319,100 |
| Median Household Income | $58,259 | $70 |
| Monthly Housing Costs | $654 | $60 |
| Real Estate Taxes | - | - |
Property Value by Mortgage Status in Plattekill
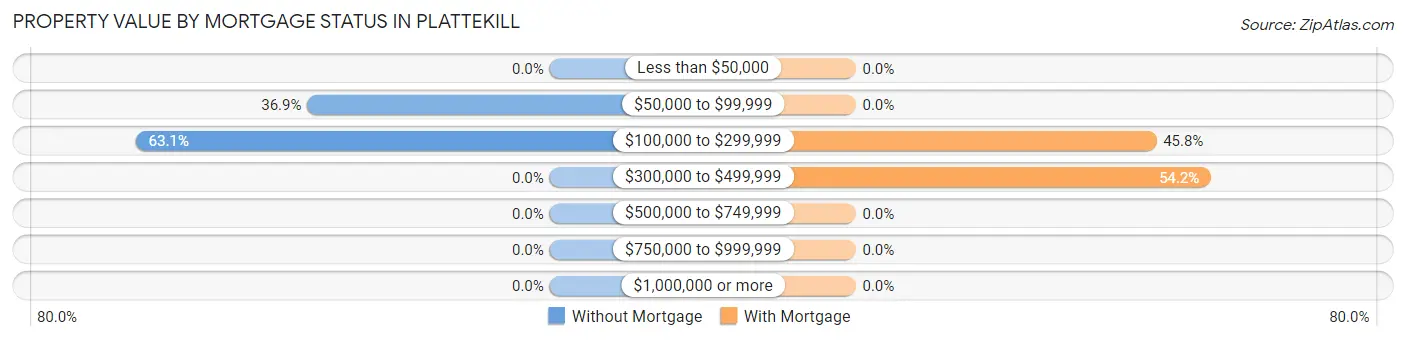
| Property Value | Without Mortgage | With Mortgage |
| Less than $50,000 | 0 (0.0%) | 0 (0.0%) |
| $50,000 to $99,999 | 24 (36.9%) | 0 (0.0%) |
| $100,000 to $299,999 | 41 (63.1%) | 71 (45.8%) |
| $300,000 to $499,999 | 0 (0.0%) | 84 (54.2%) |
| $500,000 to $749,999 | 0 (0.0%) | 0 (0.0%) |
| $750,000 to $999,999 | 0 (0.0%) | 0 (0.0%) |
| $1,000,000 or more | 0 (0.0%) | 0 (0.0%) |
| Total | 65 (100.0%) | 155 (100.0%) |
Household Income by Mortgage Status in Plattekill
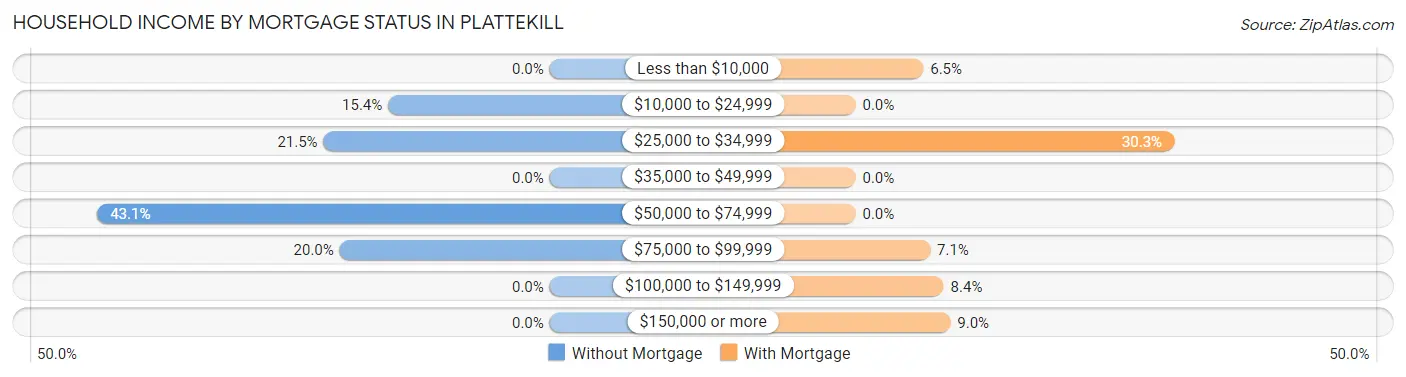
| Household Income | Without Mortgage | With Mortgage |
| Less than $10,000 | 0 (0.0%) | 10 (6.5%) |
| $10,000 to $24,999 | 10 (15.4%) | 0 (0.0%) |
| $25,000 to $34,999 | 14 (21.5%) | 47 (30.3%) |
| $35,000 to $49,999 | 0 (0.0%) | 0 (0.0%) |
| $50,000 to $74,999 | 28 (43.1%) | 0 (0.0%) |
| $75,000 to $99,999 | 13 (20.0%) | 11 (7.1%) |
| $100,000 to $149,999 | 0 (0.0%) | 13 (8.4%) |
| $150,000 or more | 0 (0.0%) | 14 (9.0%) |
| Total | 65 (100.0%) | 155 (100.0%) |
Property Value to Household Income Ratio in Plattekill
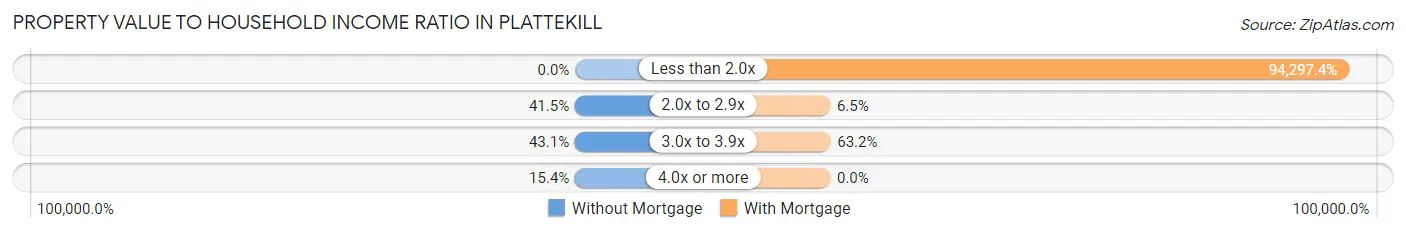
| Value-to-Income Ratio | Without Mortgage | With Mortgage |
| Less than 2.0x | 0 (0.0%) | 146,161 (94,297.4%) |
| 2.0x to 2.9x | 27 (41.5%) | 10 (6.5%) |
| 3.0x to 3.9x | 28 (43.1%) | 98 (63.2%) |
| 4.0x or more | 10 (15.4%) | 0 (0.0%) |
| Total | 65 (100.0%) | 155 (100.0%) |
Real Estate Taxes by Mortgage Status in Plattekill
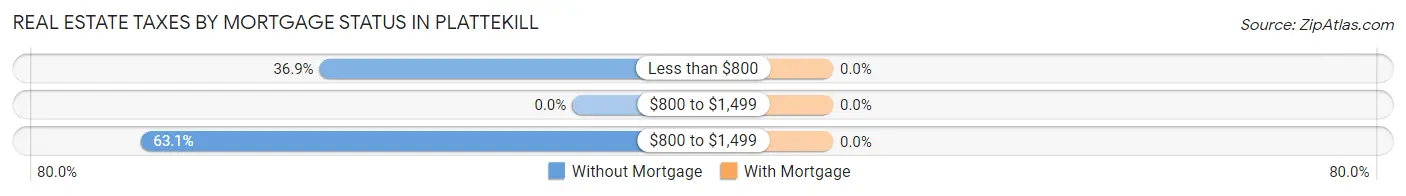
| Property Taxes | Without Mortgage | With Mortgage |
| Less than $800 | 24 (36.9%) | 0 (0.0%) |
| $800 to $1,499 | 0 (0.0%) | 0 (0.0%) |
| $800 to $1,499 | 41 (63.1%) | 0 (0.0%) |
| Total | 65 (100.0%) | 155 (100.0%) |
Health & Disability in Plattekill
Health Insurance Coverage by Age in Plattekill
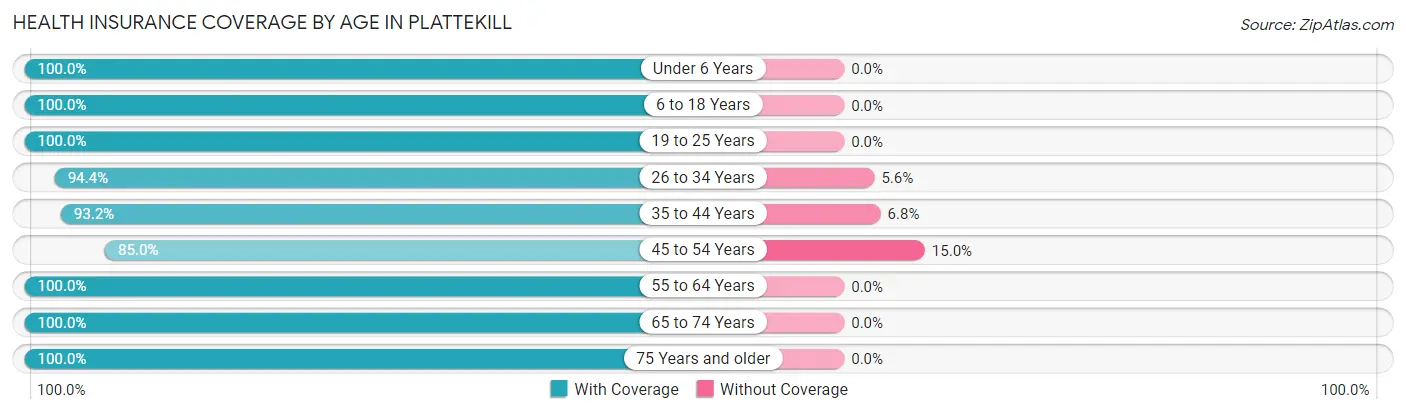
| Age Bracket | With Coverage | Without Coverage |
| Under 6 Years | 145 (100.0%) | 0 (0.0%) |
| 6 to 18 Years | 243 (100.0%) | 0 (0.0%) |
| 19 to 25 Years | 188 (100.0%) | 0 (0.0%) |
| 26 to 34 Years | 218 (94.4%) | 13 (5.6%) |
| 35 to 44 Years | 110 (93.2%) | 8 (6.8%) |
| 45 to 54 Years | 147 (85.0%) | 26 (15.0%) |
| 55 to 64 Years | 171 (100.0%) | 0 (0.0%) |
| 65 to 74 Years | 68 (100.0%) | 0 (0.0%) |
| 75 Years and older | 73 (100.0%) | 0 (0.0%) |
| Total | 1,363 (96.7%) | 47 (3.3%) |
Health Insurance Coverage by Citizenship Status in Plattekill
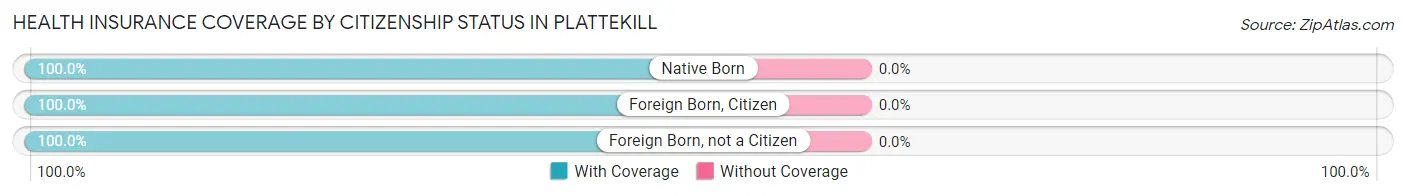
| Citizenship Status | With Coverage | Without Coverage |
| Native Born | 145 (100.0%) | 0 (0.0%) |
| Foreign Born, Citizen | 243 (100.0%) | 0 (0.0%) |
| Foreign Born, not a Citizen | 188 (100.0%) | 0 (0.0%) |
Health Insurance Coverage by Household Income in Plattekill
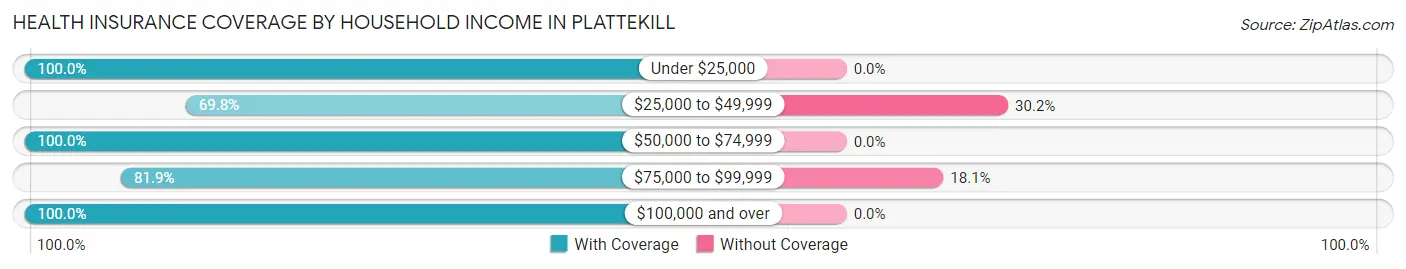
| Household Income | With Coverage | Without Coverage |
| Under $25,000 | 189 (100.0%) | 0 (0.0%) |
| $25,000 to $49,999 | 60 (69.8%) | 26 (30.2%) |
| $50,000 to $74,999 | 107 (100.0%) | 0 (0.0%) |
| $75,000 to $99,999 | 95 (81.9%) | 21 (18.1%) |
| $100,000 and over | 912 (100.0%) | 0 (0.0%) |
Public vs Private Health Insurance Coverage by Age in Plattekill
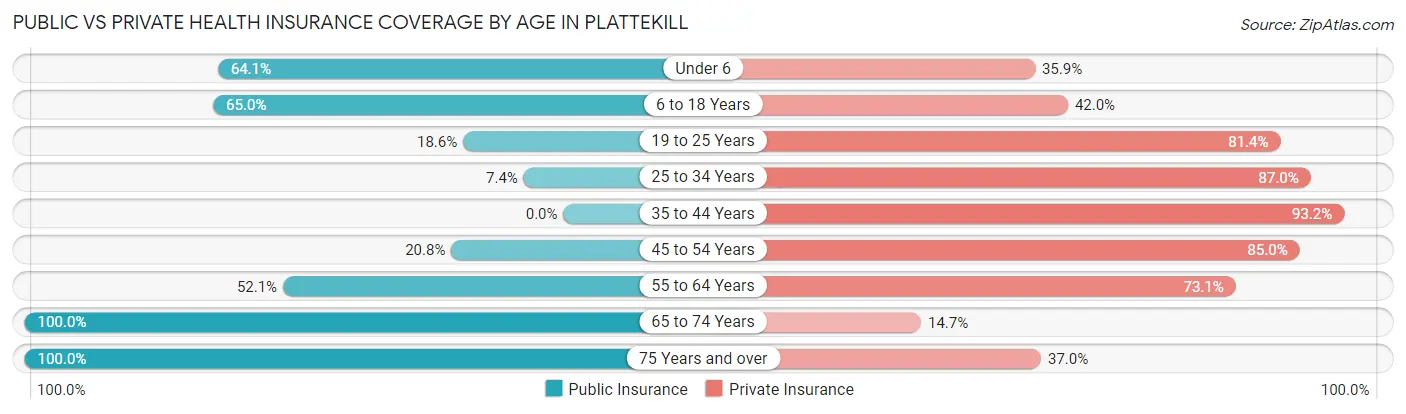
| Age Bracket | Public Insurance | Private Insurance |
| Under 6 | 93 (64.1%) | 52 (35.9%) |
| 6 to 18 Years | 158 (65.0%) | 102 (42.0%) |
| 19 to 25 Years | 35 (18.6%) | 153 (81.4%) |
| 25 to 34 Years | 17 (7.4%) | 201 (87.0%) |
| 35 to 44 Years | 0 (0.0%) | 110 (93.2%) |
| 45 to 54 Years | 36 (20.8%) | 147 (85.0%) |
| 55 to 64 Years | 89 (52.0%) | 125 (73.1%) |
| 65 to 74 Years | 68 (100.0%) | 10 (14.7%) |
| 75 Years and over | 73 (100.0%) | 27 (37.0%) |
| Total | 569 (40.4%) | 927 (65.7%) |
Disability Status by Sex by Age in Plattekill
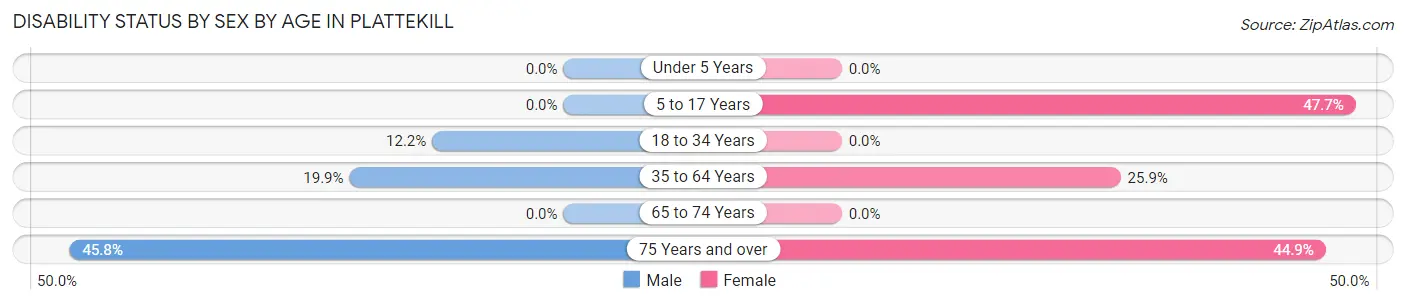
| Age Bracket | Male | Female |
| Under 5 Years | 0 (0.0%) | 0 (0.0%) |
| 5 to 17 Years | 0 (0.0%) | 92 (47.7%) |
| 18 to 34 Years | 24 (12.2%) | 0 (0.0%) |
| 35 to 64 Years | 58 (19.9%) | 44 (25.9%) |
| 65 to 74 Years | 0 (0.0%) | 0 (0.0%) |
| 75 Years and over | 11 (45.8%) | 22 (44.9%) |
Disability Class by Sex by Age in Plattekill
Disability Class: Hearing Difficulty
| Age Bracket | Male | Female |
| Under 5 Years | 0 (0.0%) | 0 (0.0%) |
| 5 to 17 Years | 0 (0.0%) | 0 (0.0%) |
| 18 to 34 Years | 0 (0.0%) | 0 (0.0%) |
| 35 to 64 Years | 0 (0.0%) | 0 (0.0%) |
| 65 to 74 Years | 0 (0.0%) | 0 (0.0%) |
| 75 Years and over | 0 (0.0%) | 0 (0.0%) |
Disability Class: Vision Difficulty
| Age Bracket | Male | Female |
| Under 5 Years | 0 (0.0%) | 0 (0.0%) |
| 5 to 17 Years | 0 (0.0%) | 0 (0.0%) |
| 18 to 34 Years | 0 (0.0%) | 0 (0.0%) |
| 35 to 64 Years | 0 (0.0%) | 0 (0.0%) |
| 65 to 74 Years | 0 (0.0%) | 0 (0.0%) |
| 75 Years and over | 0 (0.0%) | 0 (0.0%) |
Disability Class: Cognitive Difficulty
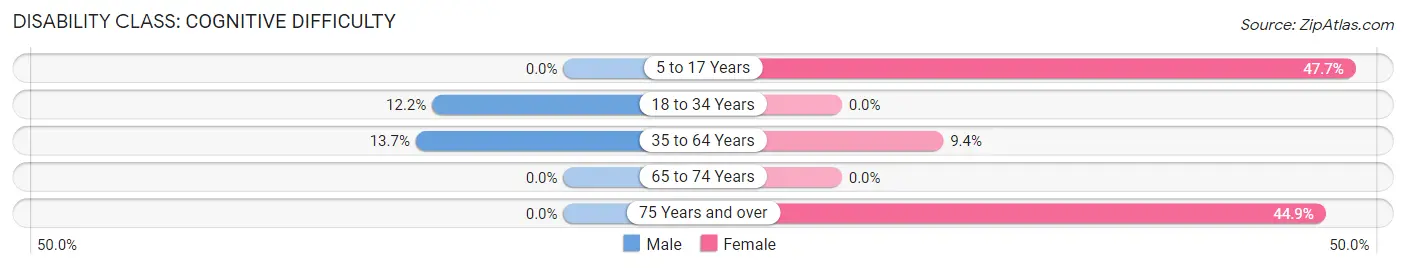
| Age Bracket | Male | Female |
| 5 to 17 Years | 0 (0.0%) | 92 (47.7%) |
| 18 to 34 Years | 24 (12.2%) | 0 (0.0%) |
| 35 to 64 Years | 40 (13.7%) | 16 (9.4%) |
| 65 to 74 Years | 0 (0.0%) | 0 (0.0%) |
| 75 Years and over | 0 (0.0%) | 22 (44.9%) |
Disability Class: Ambulatory Difficulty
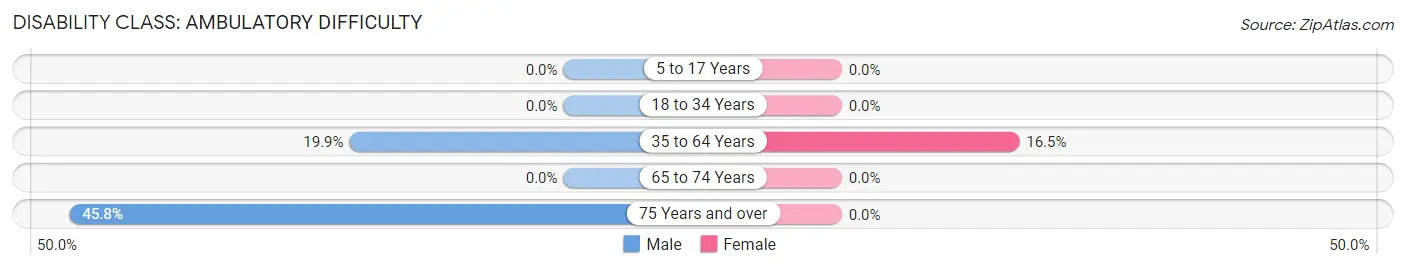
| Age Bracket | Male | Female |
| 5 to 17 Years | 0 (0.0%) | 0 (0.0%) |
| 18 to 34 Years | 0 (0.0%) | 0 (0.0%) |
| 35 to 64 Years | 58 (19.9%) | 28 (16.5%) |
| 65 to 74 Years | 0 (0.0%) | 0 (0.0%) |
| 75 Years and over | 11 (45.8%) | 0 (0.0%) |
Disability Class: Self-Care Difficulty
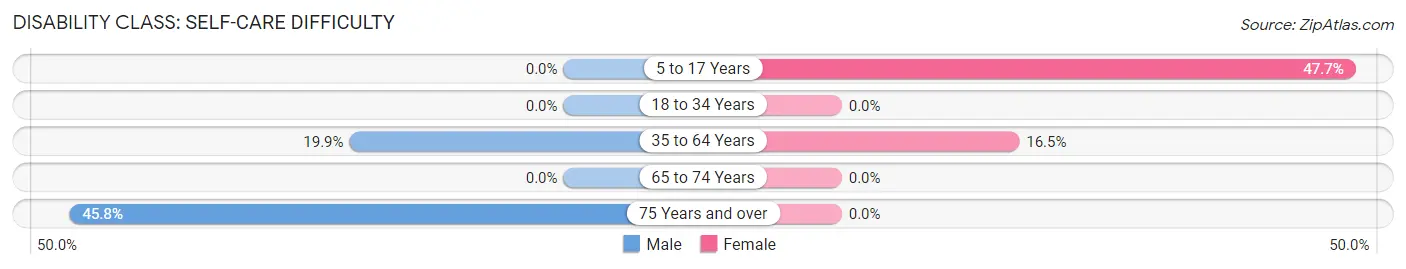
| Age Bracket | Male | Female |
| 5 to 17 Years | 0 (0.0%) | 92 (47.7%) |
| 18 to 34 Years | 0 (0.0%) | 0 (0.0%) |
| 35 to 64 Years | 58 (19.9%) | 28 (16.5%) |
| 65 to 74 Years | 0 (0.0%) | 0 (0.0%) |
| 75 Years and over | 11 (45.8%) | 0 (0.0%) |
Technology Access in Plattekill
Computing Device Access in Plattekill
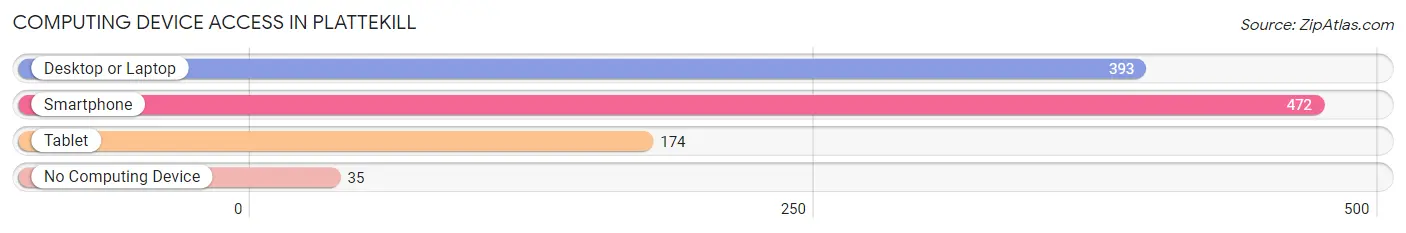
| Device Type | # Households | % Households |
| Desktop or Laptop | 393 | 75.6% |
| Smartphone | 472 | 90.8% |
| Tablet | 174 | 33.5% |
| No Computing Device | 35 | 6.7% |
| Total | 520 | 100.0% |
Internet Access in Plattekill
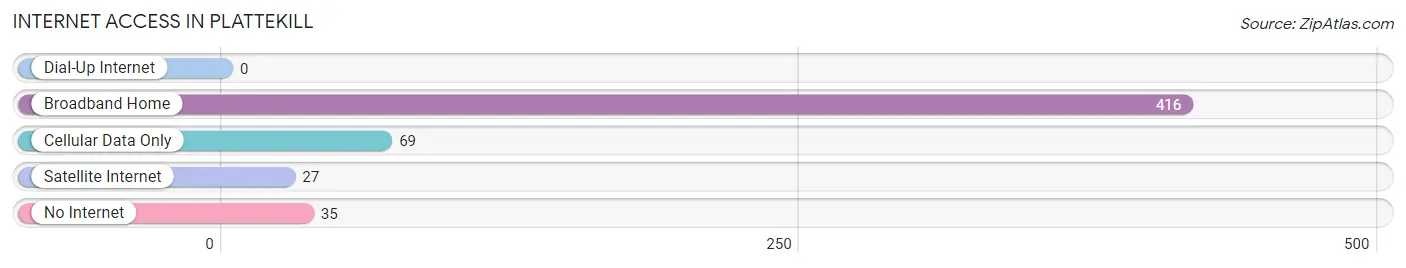
| Internet Type | # Households | % Households |
| Dial-Up Internet | 0 | 0.0% |
| Broadband Home | 416 | 80.0% |
| Cellular Data Only | 69 | 13.3% |
| Satellite Internet | 27 | 5.2% |
| No Internet | 35 | 6.7% |
| Total | 520 | 100.0% |
Plattekill Summary
Plattekill is a town located in Ulster County, New York, United States. The population was 5,717 at the 2010 census. The town is in the northwest part of the county, northwest of Newburgh.
History
The area that is now Plattekill was first settled around 1750 by Dutch and German immigrants. The town was formed in 1788 from the Town of Shawangunk. The town was named after the Plattekill Creek, which was named after the Dutch word for "flat creek".
In the early 19th century, the town was known for its iron ore deposits. The ore was mined and shipped to Newburgh, where it was used to make cannons and other weapons for the Revolutionary War.
In the late 19th century, the town was home to several large farms. The farms produced dairy products, fruits, and vegetables, which were shipped to New York City.
Geography
Plattekill is located in the northwest corner of Ulster County, bordered by the towns of Shawangunk to the east, Marlborough to the south, and Wawarsing to the west. The town is located in the Hudson Valley region of New York.
The town has a total area of 33.2 square miles, of which 32.9 square miles is land and 0.3 square miles is water. The terrain is mostly hilly, with some flat areas in the valleys. The highest point in the town is 1,890 feet above sea level.
Economy
The economy of Plattekill is largely based on agriculture. The town is home to several large farms, which produce dairy products, fruits, and vegetables. The farms also raise livestock, including cows, pigs, and chickens.
The town is also home to several small businesses, including restaurants, retail stores, and service providers.
Demographics
As of the 2010 census, there were 5,717 people, 2,072 households, and 1,541 families living in the town. The population density was 173.3 people per square mile. The racial makeup of the town was 94.2% White, 2.2% African American, 0.3% Native American, 0.7% Asian, 0.1% Pacific Islander, 0.9% from other races, and 1.6% from two or more races. Hispanic or Latino of any race were 4.2% of the population.
The median income for a household in the town was $60,938, and the median income for a family was $71,944. The per capita income for the town was $25,945. About 4.2% of families and 6.2% of the population were below the poverty line, including 8.2% of those under age 18 and 4.2% of those age 65 or over.
Common Questions
What is Per Capita Income in Plattekill?
Per Capita income in Plattekill is $30,389.
What is the Median Household income in Plattekill?
Median Household Income in Plattekill is $100,652.
What is Income or Wage Gap in Plattekill?
Income or Wage Gap in Plattekill is 40.0%.
Women in Plattekill earn 60.0 cents for every dollar earned by a man.
What is Inequality or Gini Index in Plattekill?
Inequality or Gini Index in Plattekill is 0.32.
What is the Total Population of Plattekill?
Total Population of Plattekill is 1,410.
What is the Total Male Population of Plattekill?
Total Male Population of Plattekill is 699.
What is the Total Female Population of Plattekill?
Total Female Population of Plattekill is 711.
What is the Ratio of Males per 100 Females in Plattekill?
There are 98.31 Males per 100 Females in Plattekill.
What is the Ratio of Females per 100 Males in Plattekill?
There are 101.72 Females per 100 Males in Plattekill.
What is the Median Population Age in Plattekill?
Median Population Age in Plattekill is 28.8 Years.
What is the Average Family Size in Plattekill
Average Family Size in Plattekill is 3.2 People.
What is the Average Household Size in Plattekill
Average Household Size in Plattekill is 2.7 People.
How Large is the Labor Force in Plattekill?
There are 772 People in the Labor Forcein in Plattekill.
What is the Percentage of People in the Labor Force in Plattekill?
71.0% of People are in the Labor Force in Plattekill.
What is the Unemployment Rate in Plattekill?
Unemployment Rate in Plattekill is 1.3%.