Munsons Corners, NY Map & Demographics
Munsons Corners Map
Munsons Corners Overview
$26,148
PER CAPITA INCOME
$79,665
AVG FAMILY INCOME
$64,167
AVG HOUSEHOLD INCOME
0.45
INEQUALITY / GINI INDEX
2,680
TOTAL POPULATION
1,091
MALE POPULATION
1,589
FEMALE POPULATION
68.66
MALES / 100 FEMALES
145.65
FEMALES / 100 MALES
27.1
MEDIAN AGE
3.0
AVG FAMILY SIZE
2.3
AVG HOUSEHOLD SIZE
1,188
LABOR FORCE [ PEOPLE ]
51.4%
PERCENT IN LABOR FORCE
2.6%
UNEMPLOYMENT RATE
Income in Munsons Corners
Income Overview in Munsons Corners
Per Capita Income in Munsons Corners is $26,148, while median incomes of families and households are $79,665 and $64,167 respectively.
| Characteristic | Number | Measure |
| Per Capita Income | 2,680 | $26,148 |
| Median Family Income | 553 | $79,665 |
| Mean Family Income | 553 | $98,418 |
| Median Household Income | 984 | $64,167 |
| Mean Household Income | 984 | $69,988 |
| Income Deficit | 553 | $0 |
| Wage / Income Gap (%) | 2,680 | 0.00% |
| Wage / Income Gap ($) | 2,680 | 100.00¢ per $1 |
| Gini / Inequality Index | 2,680 | 0.45 |
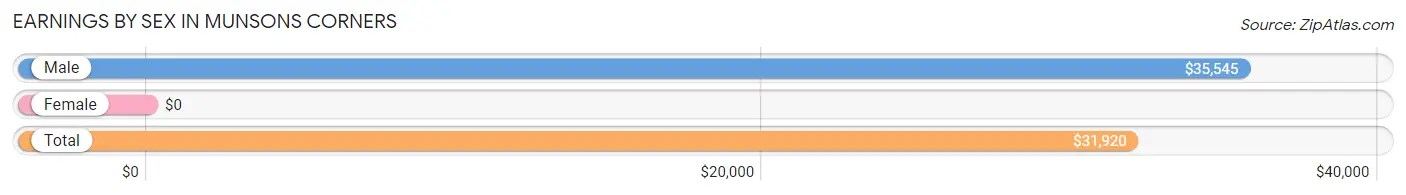
Earnings by Sex in Munsons Corners
| Sex | Number | Average Earnings |
| Male | 629 (43.2%) | $35,545 |
| Female | 826 (56.8%) | $0 |
| Total | 1,455 (100.0%) | $31,920 |
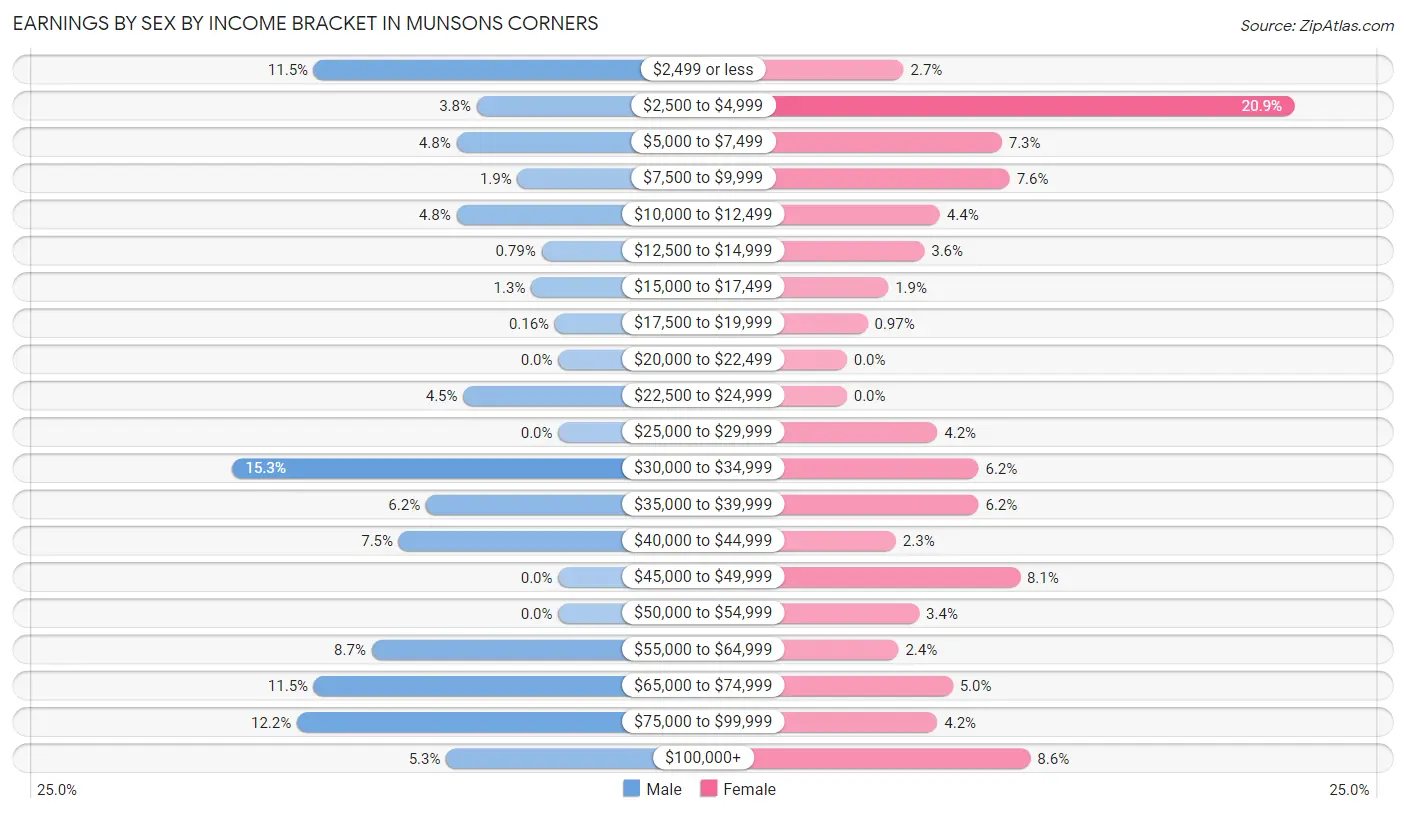
Earnings by Sex by Income Bracket in Munsons Corners
The most common earnings brackets in Munsons Corners are $30,000 to $34,999 for men (96 | 15.3%) and $2,500 to $4,999 for women (173 | 20.9%).
| Income | Male | Female |
| $2,499 or less | 72 (11.5%) | 22 (2.7%) |
| $2,500 to $4,999 | 24 (3.8%) | 173 (20.9%) |
| $5,000 to $7,499 | 30 (4.8%) | 60 (7.3%) |
| $7,500 to $9,999 | 12 (1.9%) | 63 (7.6%) |
| $10,000 to $12,499 | 30 (4.8%) | 36 (4.4%) |
| $12,500 to $14,999 | 5 (0.8%) | 30 (3.6%) |
| $15,000 to $17,499 | 8 (1.3%) | 16 (1.9%) |
| $17,500 to $19,999 | 1 (0.2%) | 8 (1.0%) |
| $20,000 to $22,499 | 0 (0.0%) | 0 (0.0%) |
| $22,500 to $24,999 | 28 (4.4%) | 0 (0.0%) |
| $25,000 to $29,999 | 0 (0.0%) | 35 (4.2%) |
| $30,000 to $34,999 | 96 (15.3%) | 51 (6.2%) |
| $35,000 to $39,999 | 39 (6.2%) | 51 (6.2%) |
| $40,000 to $44,999 | 47 (7.5%) | 19 (2.3%) |
| $45,000 to $49,999 | 0 (0.0%) | 67 (8.1%) |
| $50,000 to $54,999 | 0 (0.0%) | 28 (3.4%) |
| $55,000 to $64,999 | 55 (8.7%) | 20 (2.4%) |
| $65,000 to $74,999 | 72 (11.5%) | 41 (5.0%) |
| $75,000 to $99,999 | 77 (12.2%) | 35 (4.2%) |
| $100,000+ | 33 (5.2%) | 71 (8.6%) |
| Total | 629 (100.0%) | 826 (100.0%) |
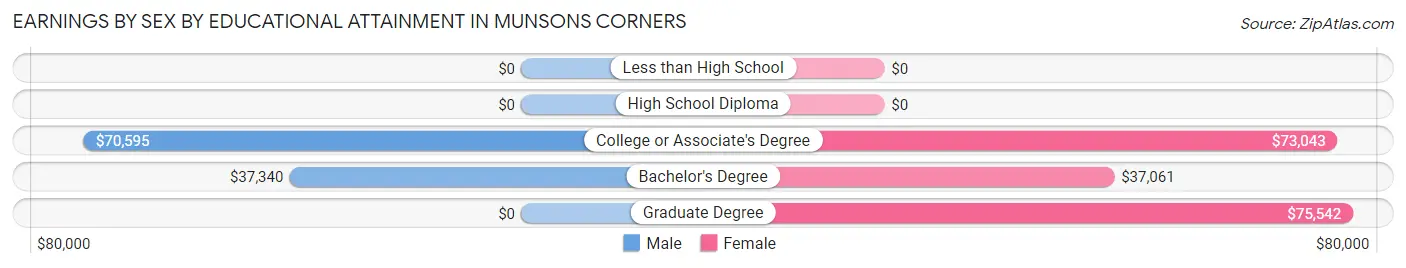
Earnings by Sex by Educational Attainment in Munsons Corners
Average earnings in Munsons Corners are $67,574 for men and $45,625 for women, a difference of 32.5%. Men with an educational attainment of college or associate's degree enjoy the highest average annual earnings of $70,595, while those with bachelor's degree education earn the least with $37,340. Women with an educational attainment of graduate degree earn the most with the average annual earnings of $75,542, while those with bachelor's degree education have the smallest earnings of $37,061.
| Educational Attainment | Male Income | Female Income |
| Less than High School | - | - |
| High School Diploma | - | - |
| College or Associate's Degree | $70,595 | $73,043 |
| Bachelor's Degree | $37,340 | $37,061 |
| Graduate Degree | - | - |
| Total | $67,574 | $45,625 |
Family Income in Munsons Corners
Family Income Brackets in Munsons Corners
According to the Munsons Corners family income data, there are 175 families falling into the $75,000 to $99,999 income range, which is the most common income bracket and makes up 31.7% of all families. Conversely, the less than $10,000 income bracket is the least frequent group with only 7 families (1.3%) belonging to this category.
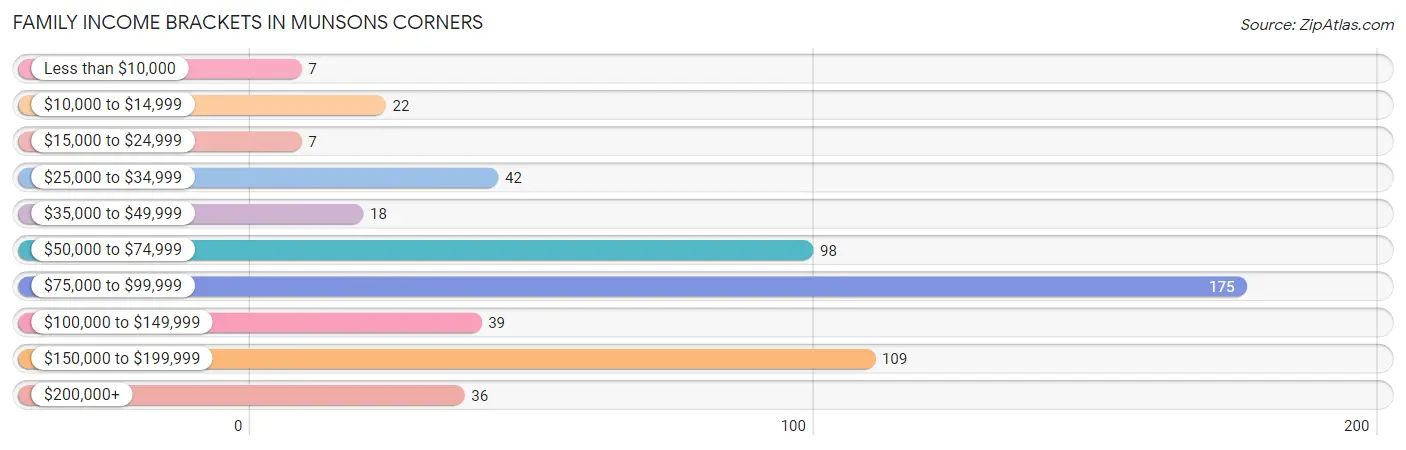
| Income Bracket | # Families | % Families |
| Less than $10,000 | 7 | 1.3% |
| $10,000 to $14,999 | 22 | 4.0% |
| $15,000 to $24,999 | 7 | 1.3% |
| $25,000 to $34,999 | 42 | 7.6% |
| $35,000 to $49,999 | 18 | 3.3% |
| $50,000 to $74,999 | 98 | 17.7% |
| $75,000 to $99,999 | 175 | 31.6% |
| $100,000 to $149,999 | 39 | 7.1% |
| $150,000 to $199,999 | 109 | 19.7% |
| $200,000+ | 36 | 6.5% |
Family Income by Famaliy Size in Munsons Corners
3-person families (51 | 9.2%) account for the highest median family income in Munsons Corners with $172,723 per family, while 3-person families (51 | 9.2%) have the highest median income of $57,574 per family member.
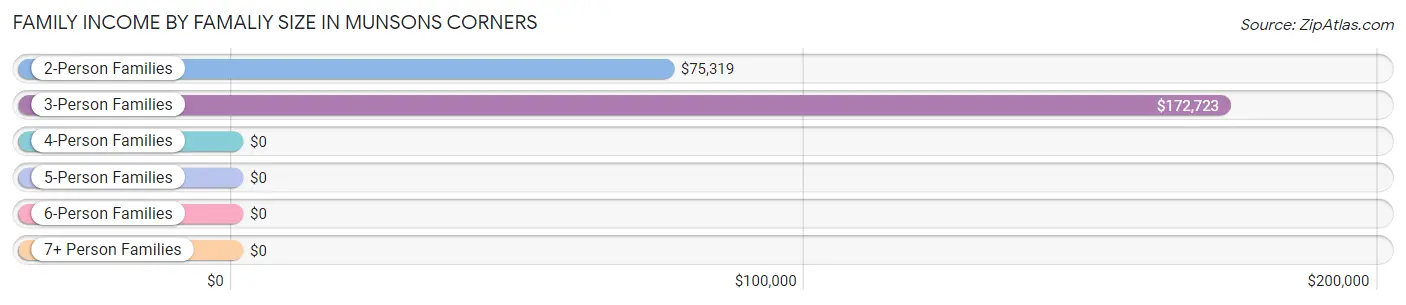
| Income Bracket | # Families | Median Income |
| 2-Person Families | 336 (60.8%) | $75,319 |
| 3-Person Families | 51 (9.2%) | $172,723 |
| 4-Person Families | 30 (5.4%) | $0 |
| 5-Person Families | 120 (21.7%) | $0 |
| 6-Person Families | 16 (2.9%) | $0 |
| 7+ Person Families | 0 (0.0%) | $0 |
| Total | 553 (100.0%) | $79,665 |
Family Income by Number of Earners in Munsons Corners
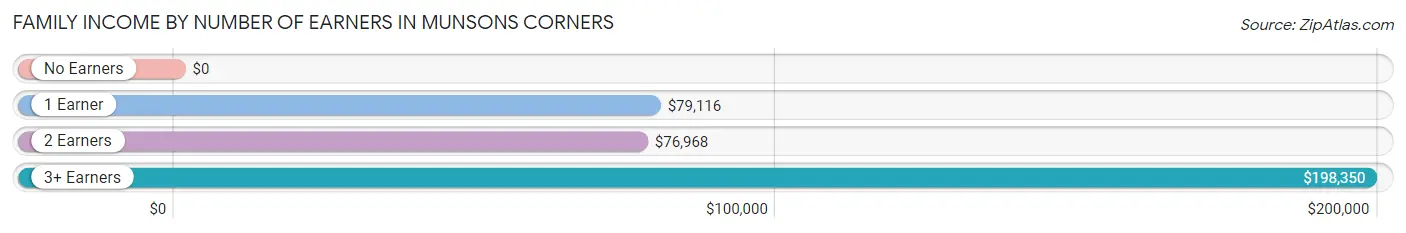
| Number of Earners | # Families | Median Income |
| No Earners | 73 (13.2%) | $0 |
| 1 Earner | 117 (21.2%) | $79,116 |
| 2 Earners | 276 (49.9%) | $76,968 |
| 3+ Earners | 87 (15.7%) | $198,350 |
| Total | 553 (100.0%) | $79,665 |
Household Income in Munsons Corners
Household Income Brackets in Munsons Corners
With 228 households falling in the category, the $50,000 to $74,999 income range is the most frequent in Munsons Corners, accounting for 23.2% of all households. In contrast, only 33 households (3.4%) fall into the $35,000 to $49,999 income bracket, making it the least populous group.
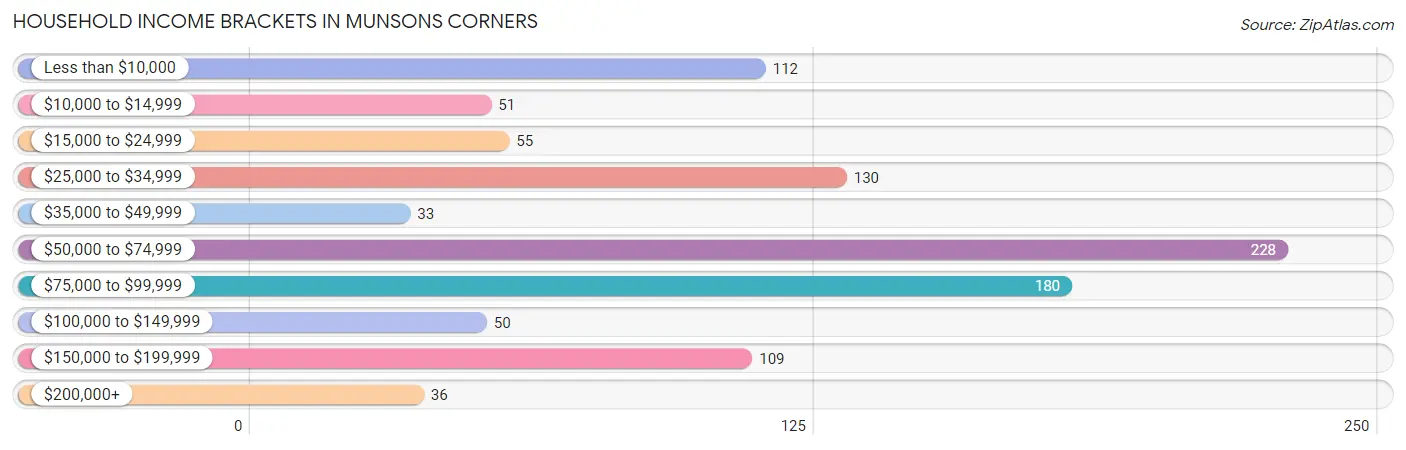
| Income Bracket | # Households | % Households |
| Less than $10,000 | 112 | 11.4% |
| $10,000 to $14,999 | 51 | 5.2% |
| $15,000 to $24,999 | 55 | 5.6% |
| $25,000 to $34,999 | 130 | 13.2% |
| $35,000 to $49,999 | 33 | 3.4% |
| $50,000 to $74,999 | 228 | 23.2% |
| $75,000 to $99,999 | 180 | 18.3% |
| $100,000 to $149,999 | 50 | 5.1% |
| $150,000 to $199,999 | 109 | 11.1% |
| $200,000+ | 36 | 3.7% |
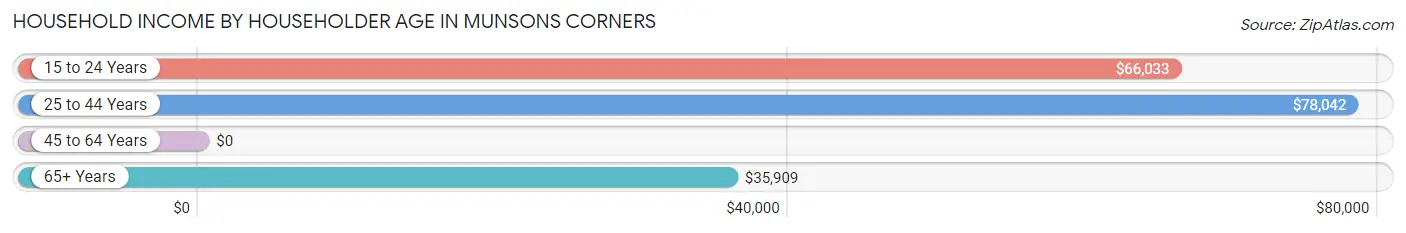
Household Income by Householder Age in Munsons Corners
The median household income in Munsons Corners is $64,167, with the highest median household income of $78,042 found in the 25 to 44 years age bracket for the primary householder. A total of 239 households (24.3%) fall into this category. Meanwhile, the 45 to 64 years age bracket for the primary householder has the lowest median household income of $0, with 384 households (39.0%) in this group.
| Income Bracket | # Households | Median Income |
| 15 to 24 Years | 121 (12.3%) | $66,033 |
| 25 to 44 Years | 239 (24.3%) | $78,042 |
| 45 to 64 Years | 384 (39.0%) | $0 |
| 65+ Years | 240 (24.4%) | $35,909 |
| Total | 984 (100.0%) | $64,167 |
Poverty in Munsons Corners
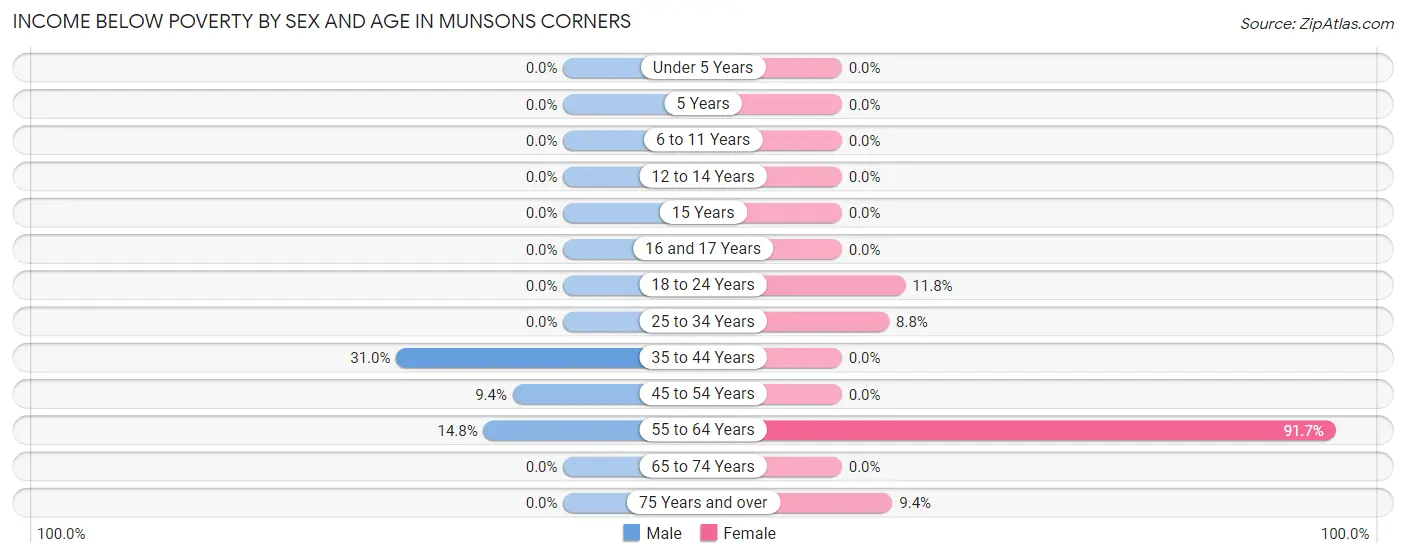
Income Below Poverty by Sex and Age in Munsons Corners
With 6.8% poverty level for males and 14.3% for females among the residents of Munsons Corners, 35 to 44 year old males and 55 to 64 year old females are the most vulnerable to poverty, with 31 males (31.0%) and 132 females (91.7%) in their respective age groups living below the poverty level.
| Age Bracket | Male | Female |
| Under 5 Years | 0 (0.0%) | 0 (0.0%) |
| 5 Years | 0 (0.0%) | 0 (0.0%) |
| 6 to 11 Years | 0 (0.0%) | 0 (0.0%) |
| 12 to 14 Years | 0 (0.0%) | 0 (0.0%) |
| 15 Years | 0 (0.0%) | 0 (0.0%) |
| 16 and 17 Years | 0 (0.0%) | 0 (0.0%) |
| 18 to 24 Years | 0 (0.0%) | 28 (11.8%) |
| 25 to 34 Years | 0 (0.0%) | 13 (8.8%) |
| 35 to 44 Years | 31 (31.0%) | 0 (0.0%) |
| 45 to 54 Years | 12 (9.4%) | 0 (0.0%) |
| 55 to 64 Years | 20 (14.8%) | 132 (91.7%) |
| 65 to 74 Years | 0 (0.0%) | 0 (0.0%) |
| 75 Years and over | 0 (0.0%) | 12 (9.4%) |
| Total | 63 (6.8%) | 185 (14.3%) |
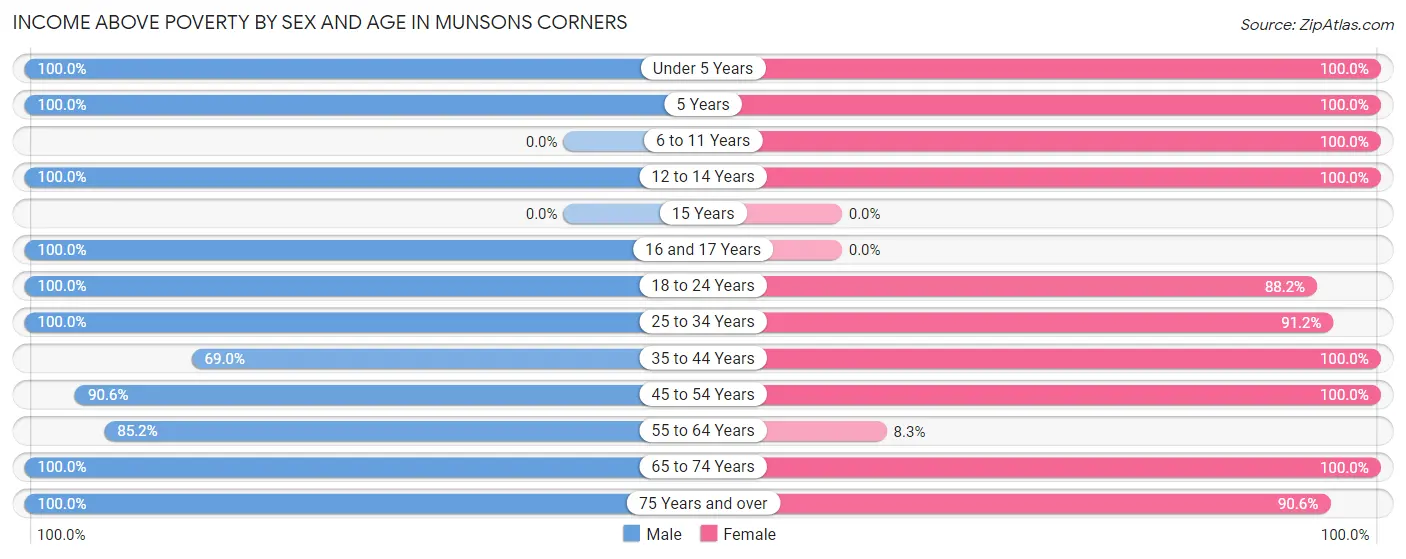
Income Above Poverty by Sex and Age in Munsons Corners
According to the poverty statistics in Munsons Corners, males aged under 5 years and females aged under 5 years are the age groups that are most secure financially, with 100.0% of males and 100.0% of females in these age groups living above the poverty line.
| Age Bracket | Male | Female |
| Under 5 Years | 49 (100.0%) | 75 (100.0%) |
| 5 Years | 32 (100.0%) | 28 (100.0%) |
| 6 to 11 Years | 0 (0.0%) | 94 (100.0%) |
| 12 to 14 Years | 63 (100.0%) | 28 (100.0%) |
| 15 Years | 0 (0.0%) | 0 (0.0%) |
| 16 and 17 Years | 117 (100.0%) | 0 (0.0%) |
| 18 to 24 Years | 121 (100.0%) | 209 (88.2%) |
| 25 to 34 Years | 110 (100.0%) | 135 (91.2%) |
| 35 to 44 Years | 69 (69.0%) | 139 (100.0%) |
| 45 to 54 Years | 116 (90.6%) | 107 (100.0%) |
| 55 to 64 Years | 115 (85.2%) | 12 (8.3%) |
| 65 to 74 Years | 38 (100.0%) | 168 (100.0%) |
| 75 Years and over | 30 (100.0%) | 116 (90.6%) |
| Total | 860 (93.2%) | 1,111 (85.7%) |
Income Below Poverty Among Married-Couple Families in Munsons Corners
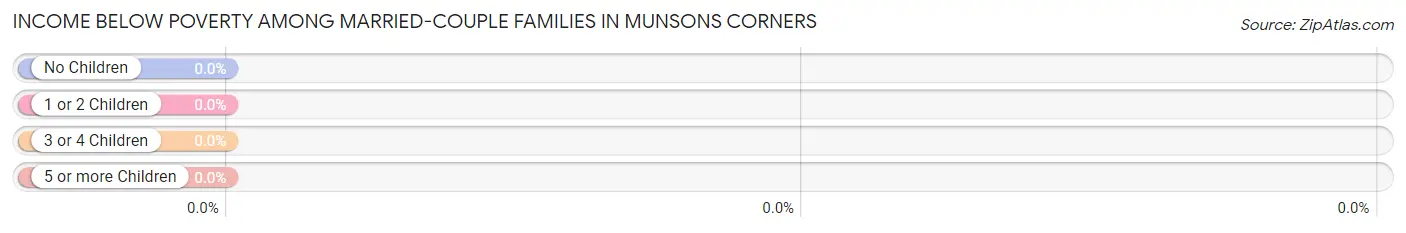
| Children | Above Poverty | Below Poverty |
| No Children | 228 (100.0%) | 0 (0.0%) |
| 1 or 2 Children | 119 (100.0%) | 0 (0.0%) |
| 3 or 4 Children | 91 (100.0%) | 0 (0.0%) |
| 5 or more Children | 0 (0.0%) | 0 (0.0%) |
| Total | 438 (100.0%) | 0 (0.0%) |
Income Below Poverty Among Single-Parent Households in Munsons Corners
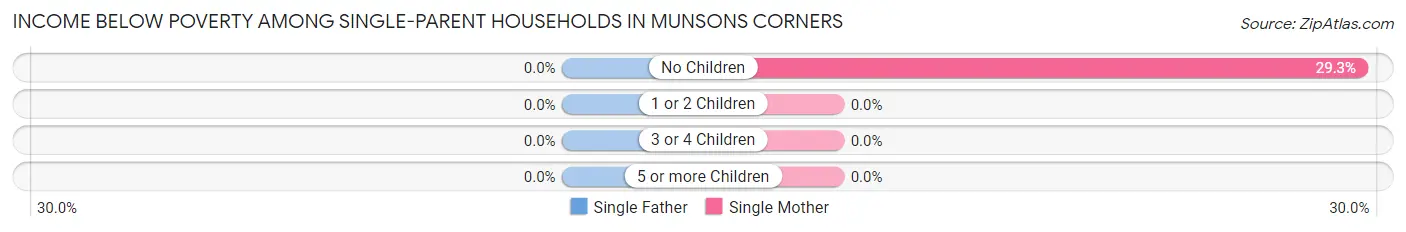
| Children | Single Father | Single Mother |
| No Children | 0 (0.0%) | 29 (29.3%) |
| 1 or 2 Children | 0 (0.0%) | 0 (0.0%) |
| 3 or 4 Children | 0 (0.0%) | 0 (0.0%) |
| 5 or more Children | 0 (0.0%) | 0 (0.0%) |
| Total | 0 (0.0%) | 29 (29.3%) |
Income Below Poverty Among Married-Couple vs Single-Parent Households in Munsons Corners
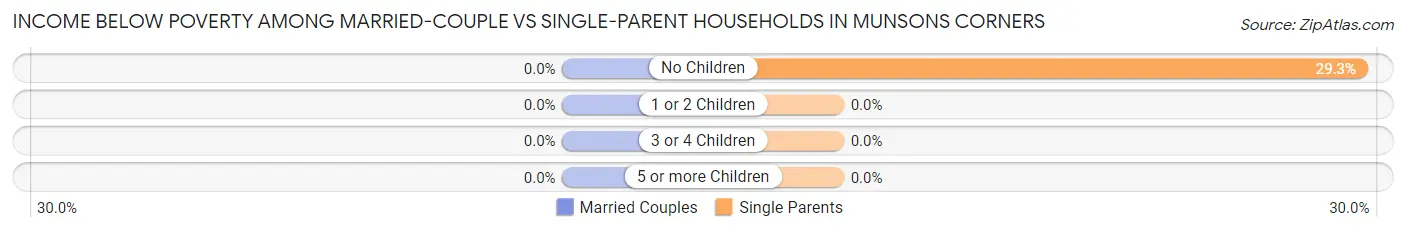
| Children | Married-Couple Families | Single-Parent Households |
| No Children | 0 (0.0%) | 29 (29.3%) |
| 1 or 2 Children | 0 (0.0%) | 0 (0.0%) |
| 3 or 4 Children | 0 (0.0%) | 0 (0.0%) |
| 5 or more Children | 0 (0.0%) | 0 (0.0%) |
| Total | 0 (0.0%) | 29 (25.2%) |
Race in Munsons Corners
The most populous races in Munsons Corners are White / Caucasian (2,326 | 86.8%), Some other Race (177 | 6.6%), and Hispanic or Latino (110 | 4.1%).
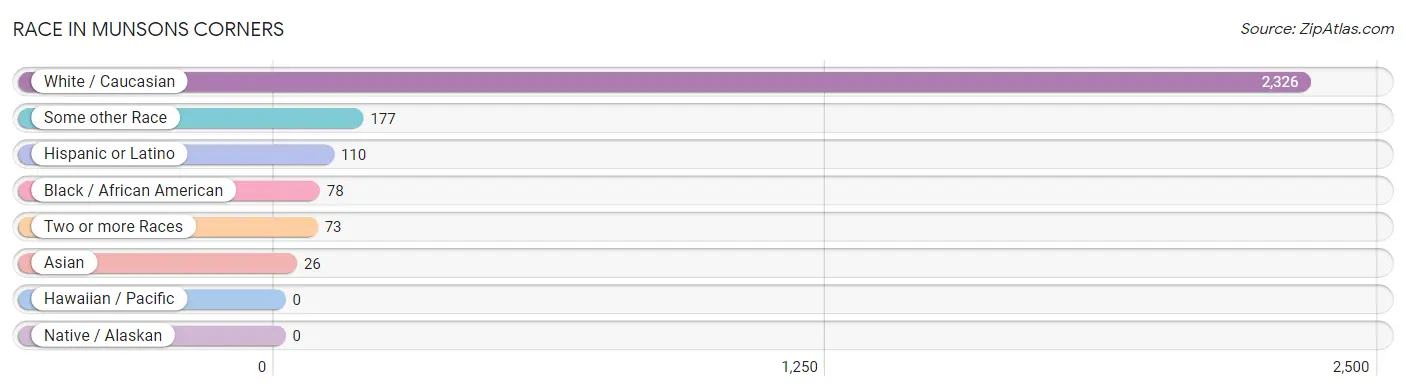
| Race | # Population | % Population |
| Asian | 26 | 1.0% |
| Black / African American | 78 | 2.9% |
| Hawaiian / Pacific | 0 | 0.0% |
| Hispanic or Latino | 110 | 4.1% |
| Native / Alaskan | 0 | 0.0% |
| White / Caucasian | 2,326 | 86.8% |
| Two or more Races | 73 | 2.7% |
| Some other Race | 177 | 6.6% |
| Total | 2,680 | 100.0% |
Ancestry in Munsons Corners
The most populous ancestries reported in Munsons Corners are English (469 | 17.5%), Italian (370 | 13.8%), German (354 | 13.2%), Irish (342 | 12.8%), and American (127 | 4.7%), together accounting for 62.0% of all Munsons Corners residents.
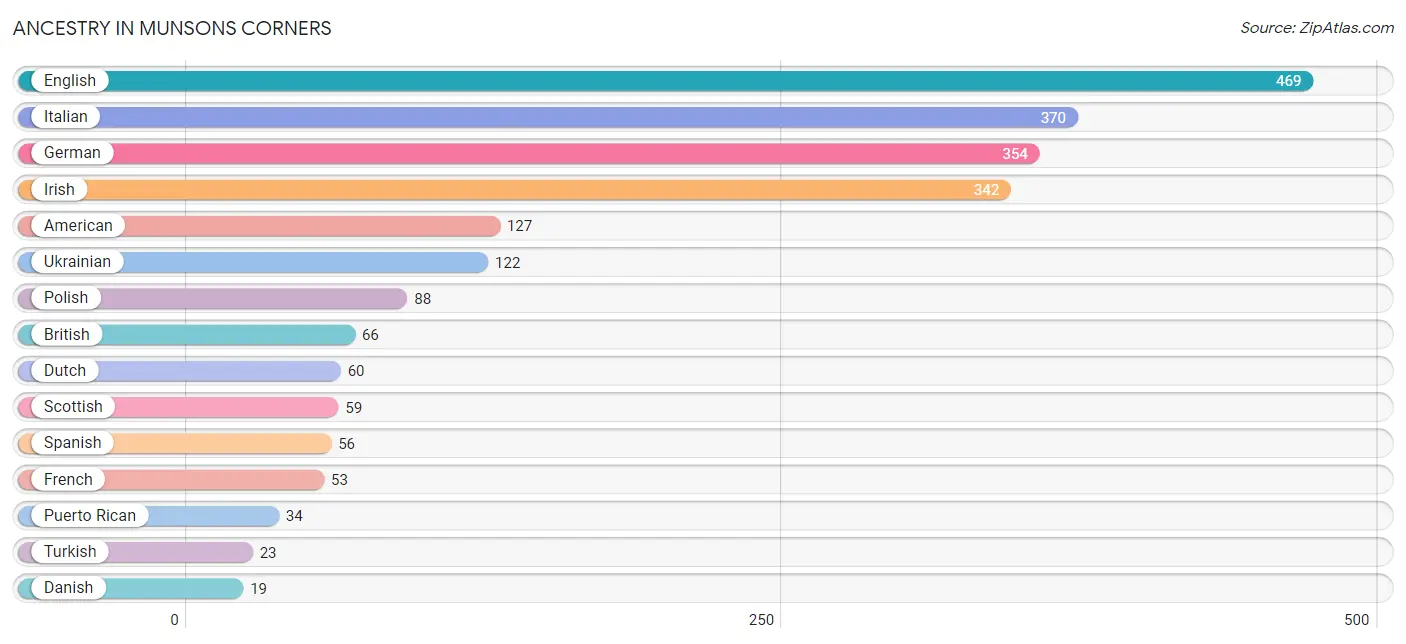
| Ancestry | # Population | % Population |
| American | 127 | 4.7% |
| Bhutanese | 17 | 0.6% |
| British | 66 | 2.5% |
| Central American | 5 | 0.2% |
| Croatian | 18 | 0.7% |
| Danish | 19 | 0.7% |
| Dutch | 60 | 2.2% |
| English | 469 | 17.5% |
| European | 13 | 0.5% |
| French | 53 | 2.0% |
| German | 354 | 13.2% |
| Indian (Asian) | 9 | 0.3% |
| Irish | 342 | 12.8% |
| Italian | 370 | 13.8% |
| Northern European | 11 | 0.4% |
| Panamanian | 5 | 0.2% |
| Polish | 88 | 3.3% |
| Puerto Rican | 34 | 1.3% |
| Scotch-Irish | 8 | 0.3% |
| Scottish | 59 | 2.2% |
| Spaniard | 9 | 0.3% |
| Spanish | 56 | 2.1% |
| Turkish | 23 | 0.9% |
| Ukrainian | 122 | 4.5% | View All 24 Rows |
Immigrants in Munsons Corners
The most numerous immigrant groups reported in Munsons Corners came from Eastern Europe (67 | 2.5%), Europe (67 | 2.5%), Ukraine (67 | 2.5%), Asia (17 | 0.6%), and Canada (17 | 0.6%), together accounting for 8.8% of all Munsons Corners residents.
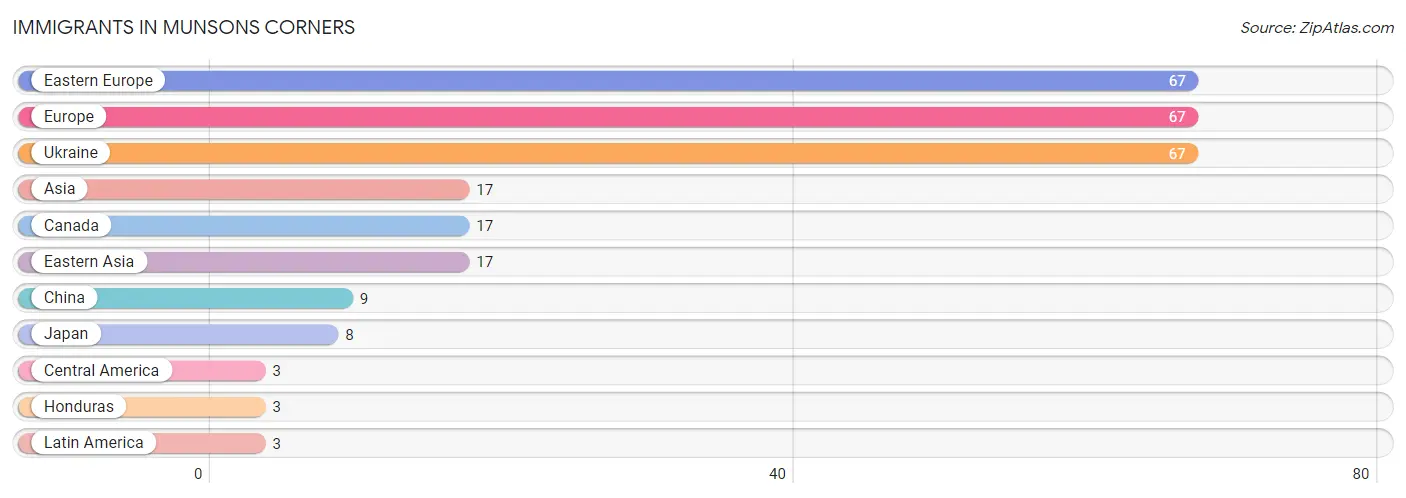
| Immigration Origin | # Population | % Population |
| Asia | 17 | 0.6% |
| Canada | 17 | 0.6% |
| Central America | 3 | 0.1% |
| China | 9 | 0.3% |
| Eastern Asia | 17 | 0.6% |
| Eastern Europe | 67 | 2.5% |
| Europe | 67 | 2.5% |
| Honduras | 3 | 0.1% |
| Japan | 8 | 0.3% |
| Latin America | 3 | 0.1% |
| Ukraine | 67 | 2.5% | View All 11 Rows |
Sex and Age in Munsons Corners
Sex and Age in Munsons Corners
The most populous age groups in Munsons Corners are 15 to 19 Years (205 | 18.8%) for men and 20 to 24 Years (287 | 18.1%) for women.
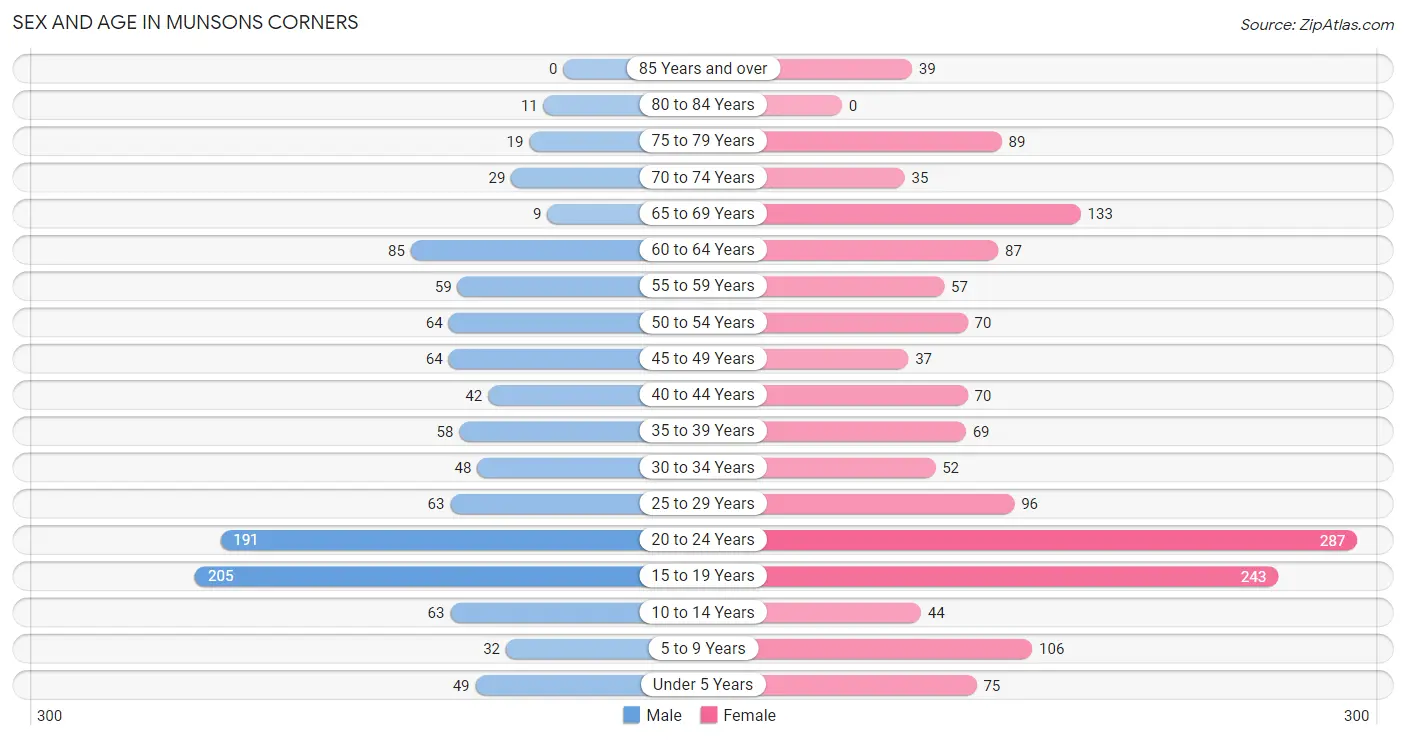
| Age Bracket | Male | Female |
| Under 5 Years | 49 (4.5%) | 75 (4.7%) |
| 5 to 9 Years | 32 (2.9%) | 106 (6.7%) |
| 10 to 14 Years | 63 (5.8%) | 44 (2.8%) |
| 15 to 19 Years | 205 (18.8%) | 243 (15.3%) |
| 20 to 24 Years | 191 (17.5%) | 287 (18.1%) |
| 25 to 29 Years | 63 (5.8%) | 96 (6.0%) |
| 30 to 34 Years | 48 (4.4%) | 52 (3.3%) |
| 35 to 39 Years | 58 (5.3%) | 69 (4.3%) |
| 40 to 44 Years | 42 (3.8%) | 70 (4.4%) |
| 45 to 49 Years | 64 (5.9%) | 37 (2.3%) |
| 50 to 54 Years | 64 (5.9%) | 70 (4.4%) |
| 55 to 59 Years | 59 (5.4%) | 57 (3.6%) |
| 60 to 64 Years | 85 (7.8%) | 87 (5.5%) |
| 65 to 69 Years | 9 (0.8%) | 133 (8.4%) |
| 70 to 74 Years | 29 (2.7%) | 35 (2.2%) |
| 75 to 79 Years | 19 (1.7%) | 89 (5.6%) |
| 80 to 84 Years | 11 (1.0%) | 0 (0.0%) |
| 85 Years and over | 0 (0.0%) | 39 (2.5%) |
| Total | 1,091 (100.0%) | 1,589 (100.0%) |
Families and Households in Munsons Corners
Median Family Size in Munsons Corners
The median family size in Munsons Corners is 3.05 persons per family, with married-couple families (438 | 79.2%) accounting for the largest median family size of 3.35 persons per family. On the other hand, single female/mother families (99 | 17.9%) represent the smallest median family size with 1.85 persons per family.
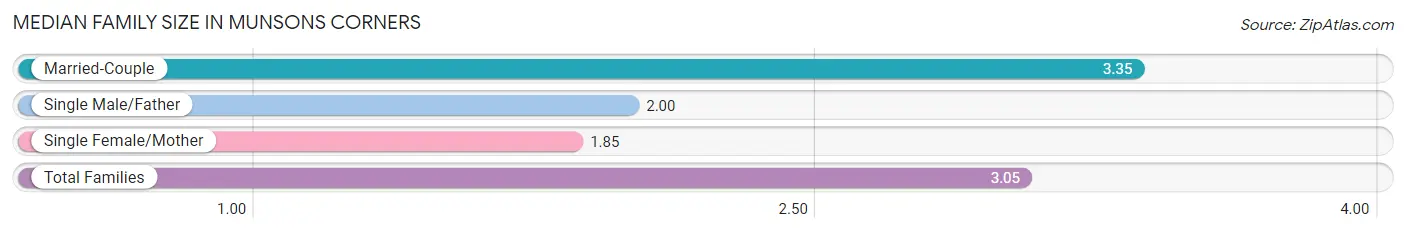
| Family Type | # Families | Family Size |
| Married-Couple | 438 (79.2%) | 3.35 |
| Single Male/Father | 16 (2.9%) | 2.00 |
| Single Female/Mother | 99 (17.9%) | 1.85 |
| Total Families | 553 (100.0%) | 3.05 |
Median Household Size in Munsons Corners
The median household size in Munsons Corners is 2.26 persons per household, with married-couple households (438 | 44.5%) accounting for the largest median household size of 3.35 persons per household. non-family households (431 | 43.8%) represent the smallest median household size with 1.24 persons per household.
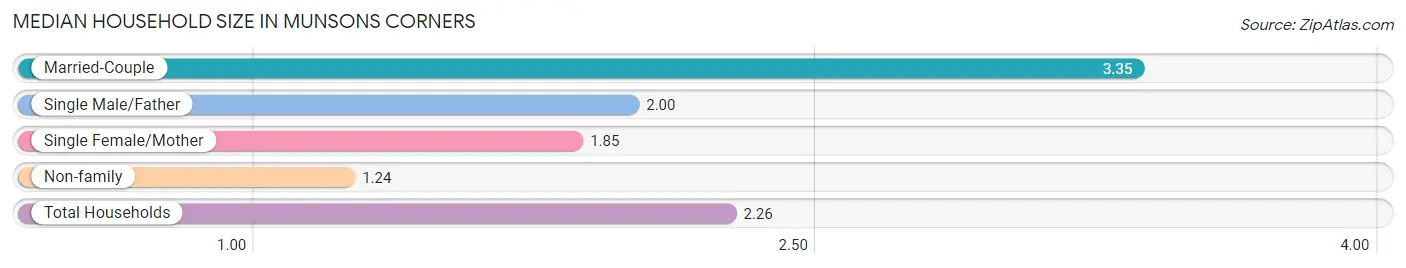
| Household Type | # Households | Household Size |
| Married-Couple | 438 (44.5%) | 3.35 |
| Single Male/Father | 16 (1.6%) | 2.00 |
| Single Female/Mother | 99 (10.1%) | 1.85 |
| Non-family | 431 (43.8%) | 1.24 |
| Total Households | 984 (100.0%) | 2.26 |
Household Size by Marriage Status in Munsons Corners
Out of a total of 984 households in Munsons Corners, 553 (56.2%) are family households, while 431 (43.8%) are nonfamily households. The most numerous type of family households are 2-person households, comprising 336, and the most common type of nonfamily households are 1-person households, comprising 330.
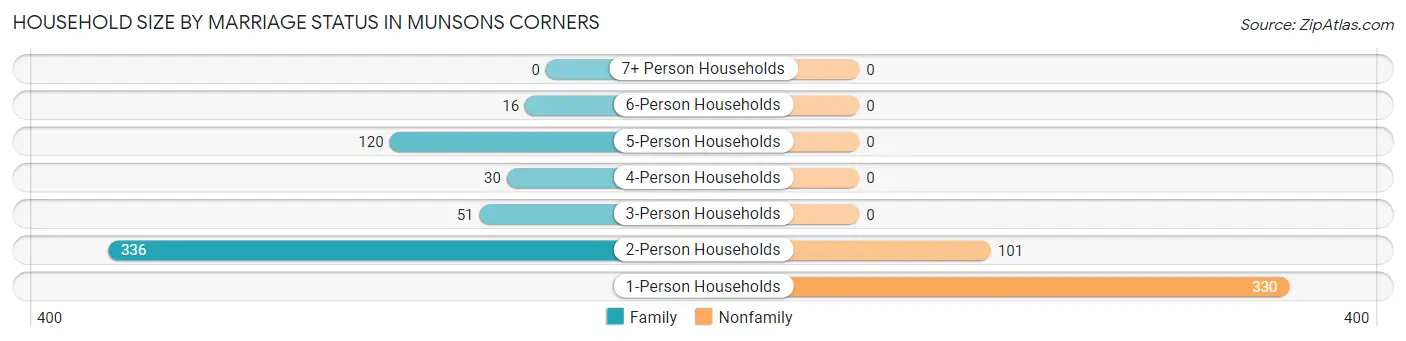
| Household Size | Family Households | Nonfamily Households |
| 1-Person Households | - | 330 (33.5%) |
| 2-Person Households | 336 (34.2%) | 101 (10.3%) |
| 3-Person Households | 51 (5.2%) | 0 (0.0%) |
| 4-Person Households | 30 (3.0%) | 0 (0.0%) |
| 5-Person Households | 120 (12.2%) | 0 (0.0%) |
| 6-Person Households | 16 (1.6%) | 0 (0.0%) |
| 7+ Person Households | 0 (0.0%) | 0 (0.0%) |
| Total | 553 (56.2%) | 431 (43.8%) |
Female Fertility in Munsons Corners
Fertility by Age in Munsons Corners
Average fertility rate in Munsons Corners is 19.0 births per 1,000 women. Women in the age bracket of 35 to 50 years have the highest fertility rate with 83.0 births per 1,000 women. Women in the age bracket of 35 to 50 years acount for 100.0% of all women with births.
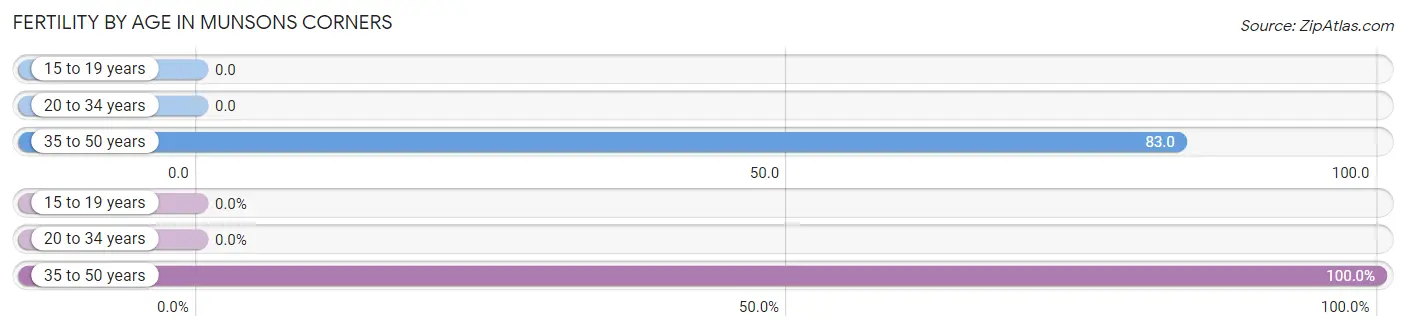
| Age Bracket | Women with Births | Births / 1,000 Women |
| 15 to 19 years | 0 (0.0%) | 0.0 |
| 20 to 34 years | 0 (0.0%) | 0.0 |
| 35 to 50 years | 17 (100.0%) | 83.0 |
| Total | 17 (100.0%) | 19.0 |
Fertility by Age by Marriage Status in Munsons Corners
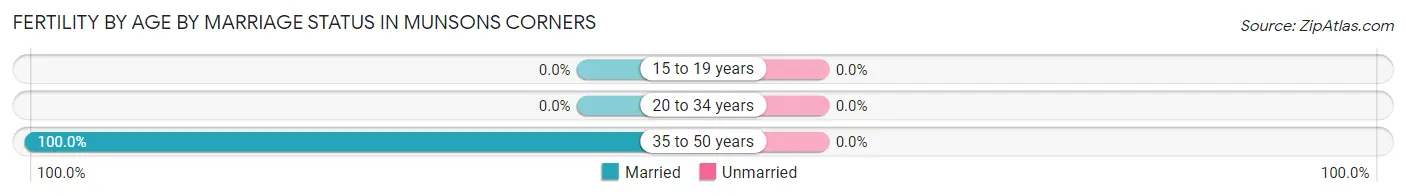
| Age Bracket | Married | Unmarried |
| 15 to 19 years | 0 (0.0%) | 0 (0.0%) |
| 20 to 34 years | 0 (0.0%) | 0 (0.0%) |
| 35 to 50 years | 17 (100.0%) | 0 (0.0%) |
| Total | 17 (100.0%) | 0 (0.0%) |
Fertility by Education in Munsons Corners
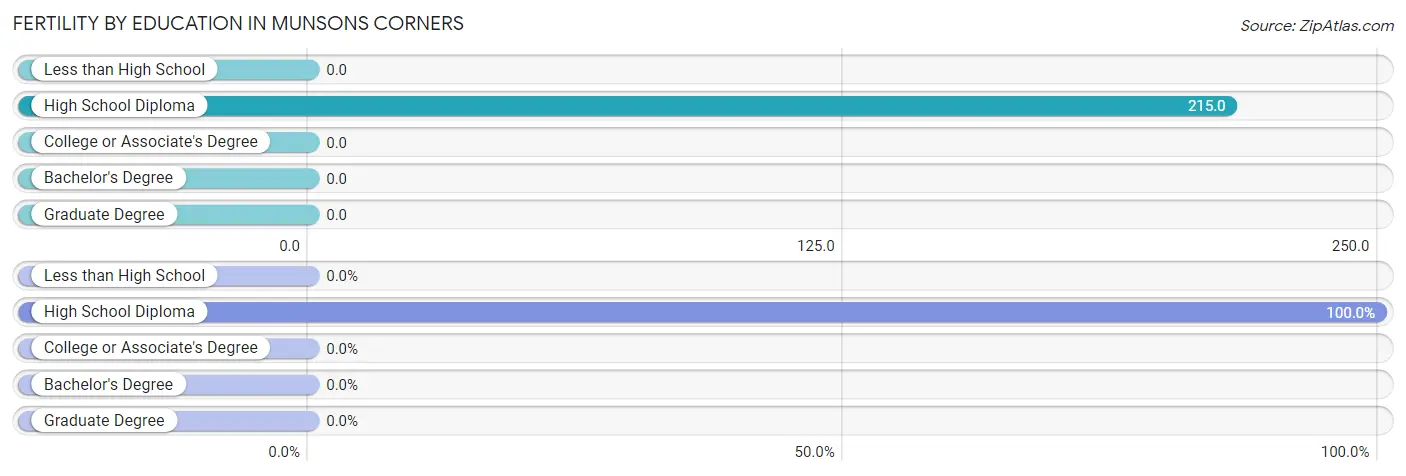
| Educational Attainment | Women with Births | Births / 1,000 Women |
| Less than High School | 0 (0.0%) | 0.0 |
| High School Diploma | 17 (100.0%) | 215.0 |
| College or Associate's Degree | 0 (0.0%) | 0.0 |
| Bachelor's Degree | 0 (0.0%) | 0.0 |
| Graduate Degree | 0 (0.0%) | 0.0 |
| Total | 17 (100.0%) | 19.0 |
Fertility by Education by Marriage Status in Munsons Corners
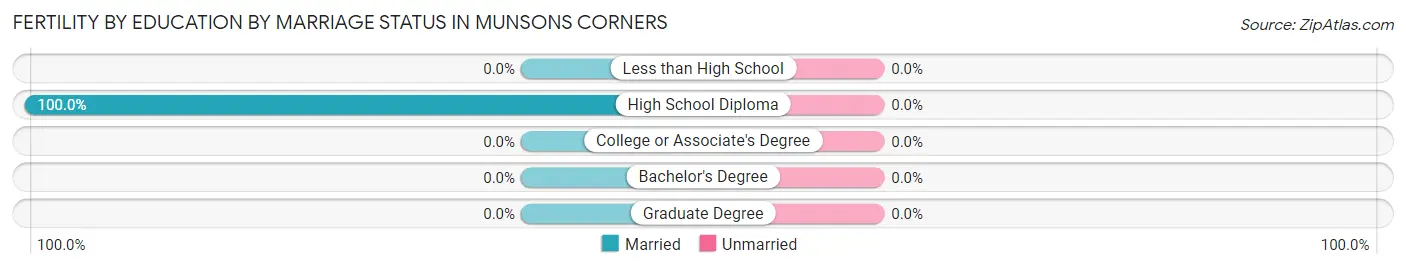
| Educational Attainment | Married | Unmarried |
| Less than High School | 0 (0.0%) | 0 (0.0%) |
| High School Diploma | 17 (100.0%) | 0 (0.0%) |
| College or Associate's Degree | 0 (0.0%) | 0 (0.0%) |
| Bachelor's Degree | 0 (0.0%) | 0 (0.0%) |
| Graduate Degree | 0 (0.0%) | 0 (0.0%) |
| Total | 17 (100.0%) | 0 (0.0%) |
Employment Characteristics in Munsons Corners
Employment by Class of Employer in Munsons Corners
Among the 1,158 employed individuals in Munsons Corners, private company employees (748 | 64.6%), local government employees (176 | 15.2%), and not-for-profit organizations (94 | 8.1%) make up the most common classes of employment.
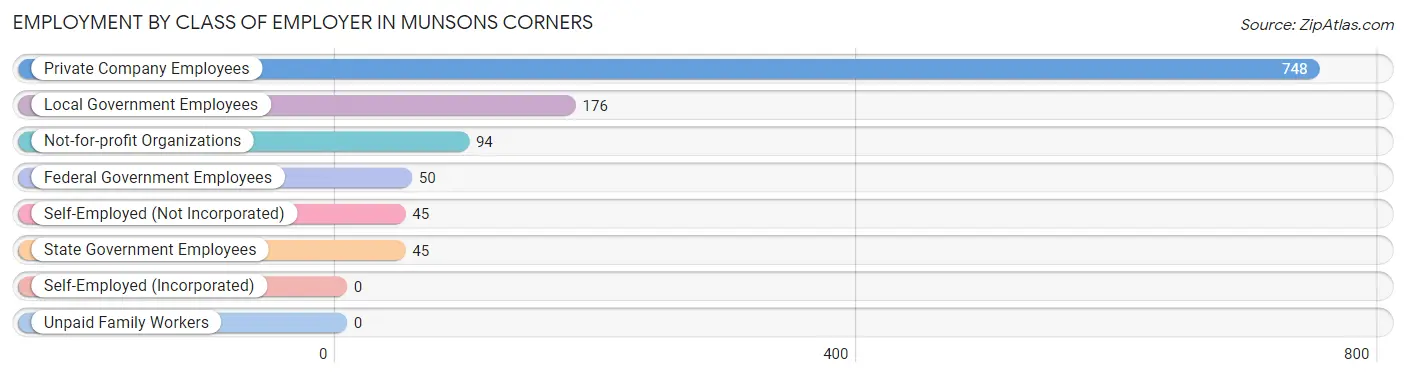
| Employer Class | # Employees | % Employees |
| Private Company Employees | 748 | 64.6% |
| Self-Employed (Incorporated) | 0 | 0.0% |
| Self-Employed (Not Incorporated) | 45 | 3.9% |
| Not-for-profit Organizations | 94 | 8.1% |
| Local Government Employees | 176 | 15.2% |
| State Government Employees | 45 | 3.9% |
| Federal Government Employees | 50 | 4.3% |
| Unpaid Family Workers | 0 | 0.0% |
| Total | 1,158 | 100.0% |
Employment Status by Age in Munsons Corners
According to the labor force statistics for Munsons Corners, out of the total population over 16 years of age (2,311), 51.4% or 1,188 individuals are in the labor force, with 2.6% or 31 of them unemployed. The age group with the highest labor force participation rate is 25 to 29 years, with 100.0% or 159 individuals in the labor force. Within the labor force, the 65 to 74 years age range has the highest percentage of unemployed individuals, with 13.1% or 11 of them being unemployed.
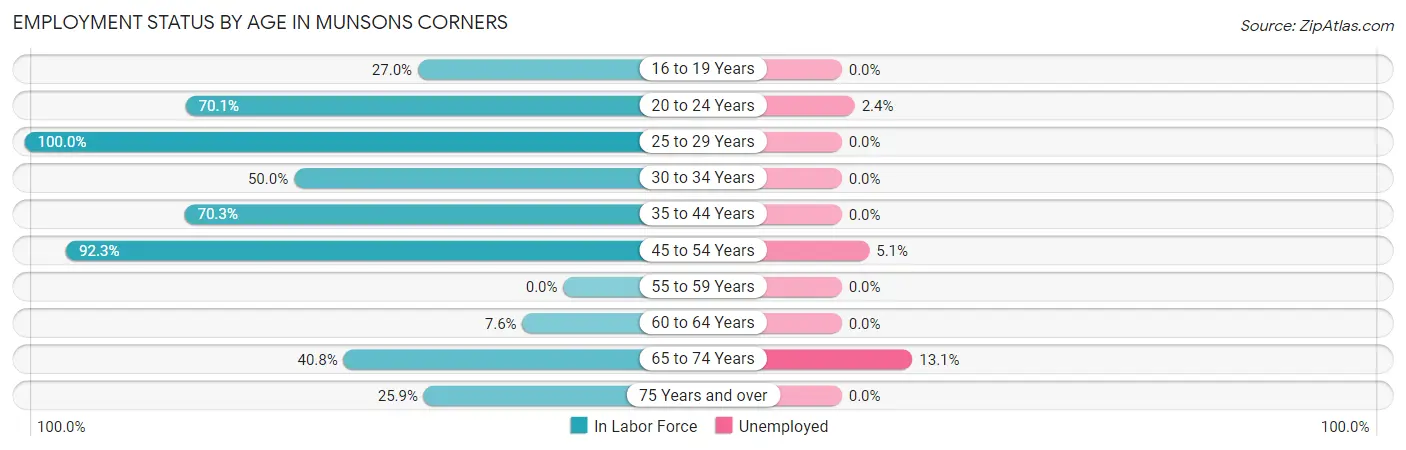
| Age Bracket | In Labor Force | Unemployed |
| 16 to 19 Years | 121 (27.0%) | 0 (0.0%) |
| 20 to 24 Years | 335 (70.1%) | 8 (2.4%) |
| 25 to 29 Years | 159 (100.0%) | 0 (0.0%) |
| 30 to 34 Years | 50 (50.0%) | 0 (0.0%) |
| 35 to 44 Years | 168 (70.3%) | 0 (0.0%) |
| 45 to 54 Years | 217 (92.3%) | 11 (5.1%) |
| 55 to 59 Years | 0 (0.0%) | 0 (0.0%) |
| 60 to 64 Years | 13 (7.6%) | 0 (0.0%) |
| 65 to 74 Years | 84 (40.8%) | 11 (13.1%) |
| 75 Years and over | 41 (25.9%) | 0 (0.0%) |
| Total | 1,188 (51.4%) | 31 (2.6%) |
Employment Status by Educational Attainment in Munsons Corners
According to labor force statistics for Munsons Corners, 59.5% of individuals (607) out of the total population between 25 and 64 years of age (1,021) are in the labor force, with 1.9% or 12 of them being unemployed. The group with the highest labor force participation rate are those with the educational attainment of bachelor's degree or higher, with 84.4% or 342 individuals in the labor force. Within the labor force, individuals with high school diploma education have the highest percentage of unemployment, with 19.3% or 11 of them being unemployed.
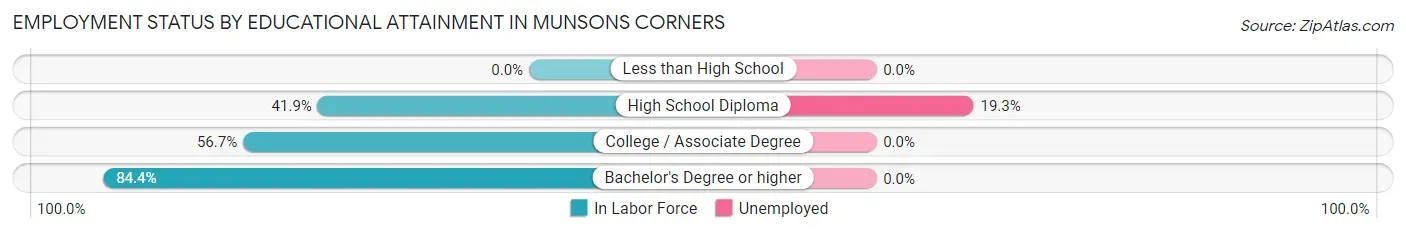
| Educational Attainment | In Labor Force | Unemployed |
| Less than High School | 0 (0.0%) | 0 (0.0%) |
| High School Diploma | 57 (41.9%) | 26 (19.3%) |
| College / Associate Degree | 208 (56.7%) | 0 (0.0%) |
| Bachelor's Degree or higher | 342 (84.4%) | 0 (0.0%) |
| Total | 607 (59.5%) | 19 (1.9%) |
Employment Occupations by Sex in Munsons Corners
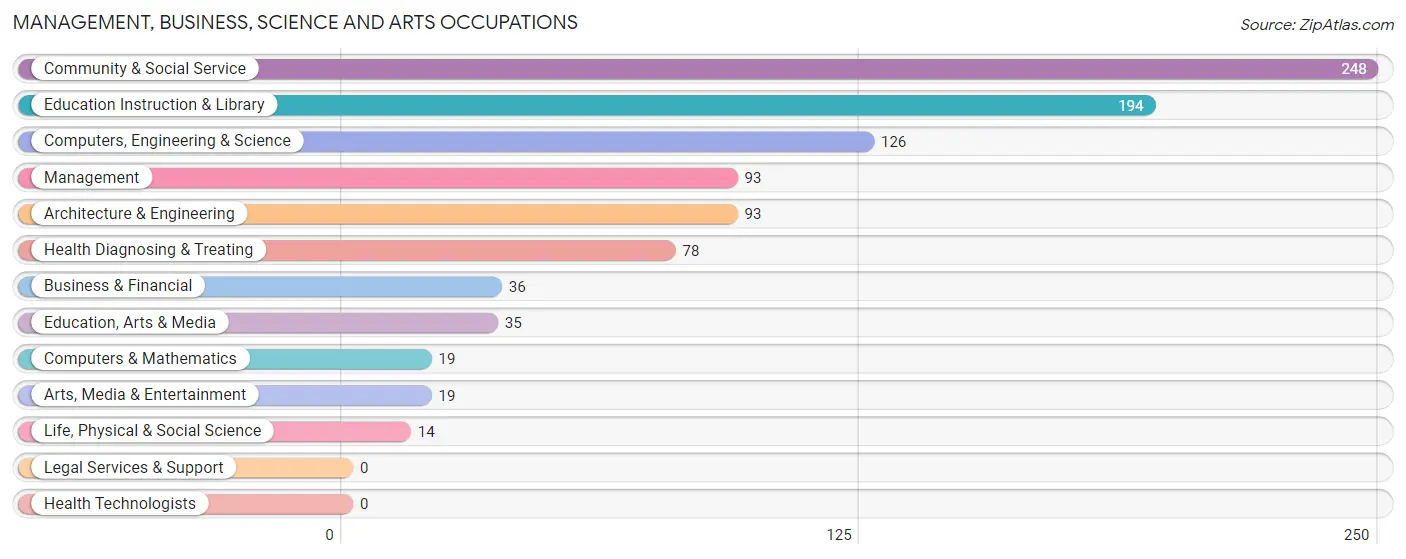
Management, Business, Science and Arts Occupations
The most common Management, Business, Science and Arts occupations in Munsons Corners are Community & Social Service (248 | 22.0%), Education Instruction & Library (194 | 17.2%), Computers, Engineering & Science (126 | 11.2%), Management (93 | 8.2%), and Architecture & Engineering (93 | 8.2%).
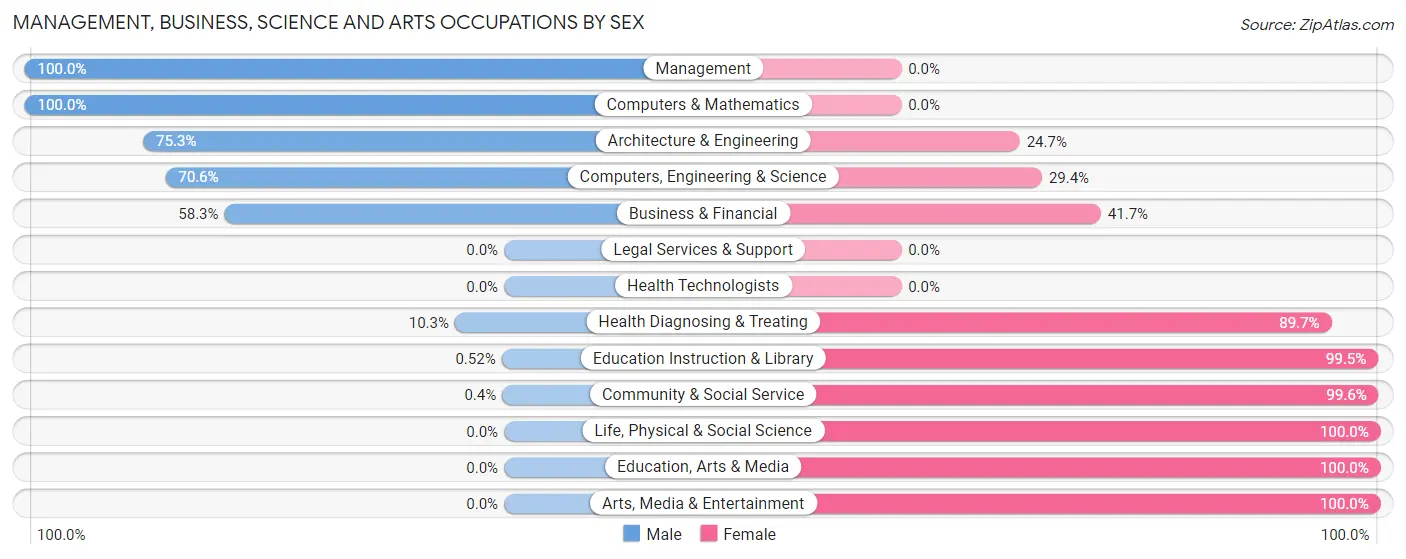
Management, Business, Science and Arts Occupations by Sex
Within the Management, Business, Science and Arts occupations in Munsons Corners, the most male-oriented occupations are Management (100.0%), Computers & Mathematics (100.0%), and Architecture & Engineering (75.3%), while the most female-oriented occupations are Life, Physical & Social Science (100.0%), Education, Arts & Media (100.0%), and Arts, Media & Entertainment (100.0%).
| Occupation | Male | Female |
| Management | 93 (100.0%) | 0 (0.0%) |
| Business & Financial | 21 (58.3%) | 15 (41.7%) |
| Computers, Engineering & Science | 89 (70.6%) | 37 (29.4%) |
| Computers & Mathematics | 19 (100.0%) | 0 (0.0%) |
| Architecture & Engineering | 70 (75.3%) | 23 (24.7%) |
| Life, Physical & Social Science | 0 (0.0%) | 14 (100.0%) |
| Community & Social Service | 1 (0.4%) | 247 (99.6%) |
| Education, Arts & Media | 0 (0.0%) | 35 (100.0%) |
| Legal Services & Support | 0 (0.0%) | 0 (0.0%) |
| Education Instruction & Library | 1 (0.5%) | 193 (99.5%) |
| Arts, Media & Entertainment | 0 (0.0%) | 19 (100.0%) |
| Health Diagnosing & Treating | 8 (10.3%) | 70 (89.7%) |
| Health Technologists | 0 (0.0%) | 0 (0.0%) |
| Total (Category) | 212 (36.5%) | 369 (63.5%) |
| Total (Overall) | 465 (41.2%) | 663 (58.8%) |
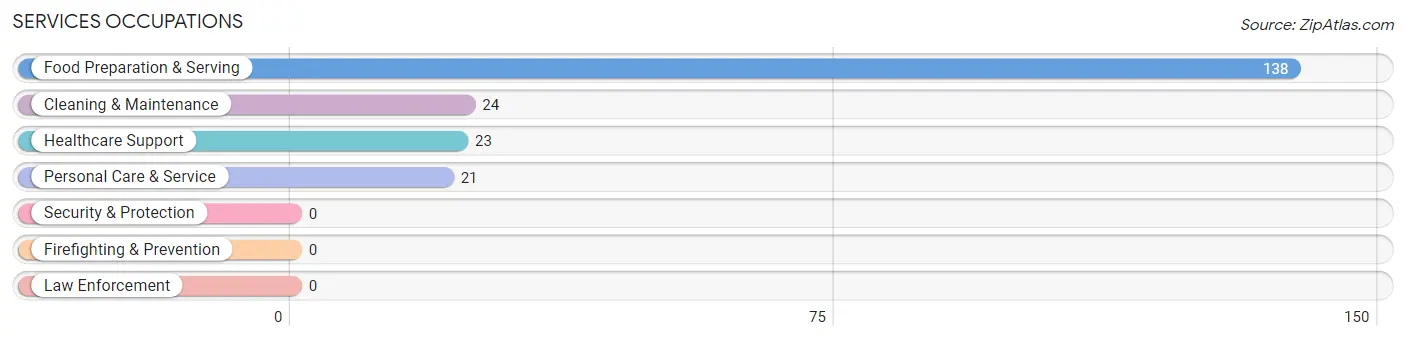
Services Occupations
The most common Services occupations in Munsons Corners are Food Preparation & Serving (138 | 12.2%), Cleaning & Maintenance (24 | 2.1%), Healthcare Support (23 | 2.0%), and Personal Care & Service (21 | 1.9%).
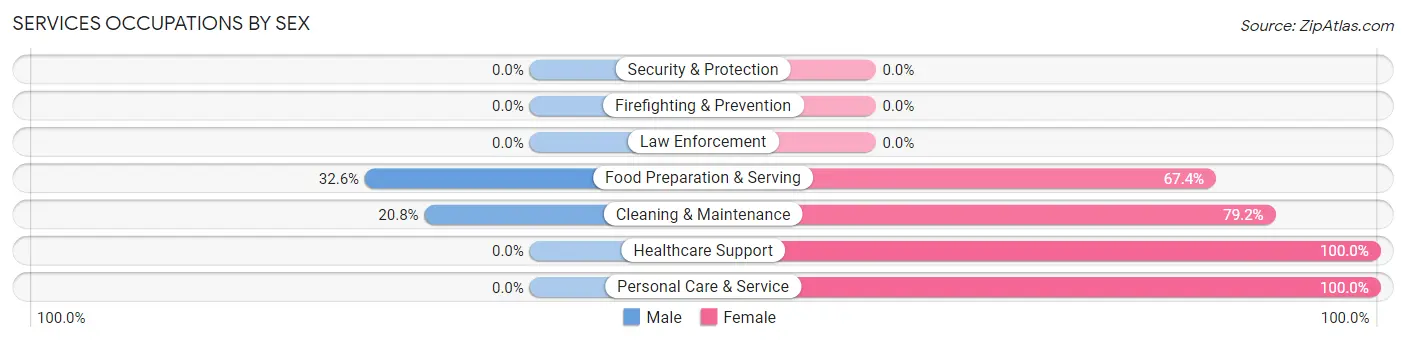
Services Occupations by Sex
Within the Services occupations in Munsons Corners, the most male-oriented occupations are Food Preparation & Serving (32.6%), and Cleaning & Maintenance (20.8%), while the most female-oriented occupations are Healthcare Support (100.0%), Personal Care & Service (100.0%), and Cleaning & Maintenance (79.2%).
| Occupation | Male | Female |
| Healthcare Support | 0 (0.0%) | 23 (100.0%) |
| Security & Protection | 0 (0.0%) | 0 (0.0%) |
| Firefighting & Prevention | 0 (0.0%) | 0 (0.0%) |
| Law Enforcement | 0 (0.0%) | 0 (0.0%) |
| Food Preparation & Serving | 45 (32.6%) | 93 (67.4%) |
| Cleaning & Maintenance | 5 (20.8%) | 19 (79.2%) |
| Personal Care & Service | 0 (0.0%) | 21 (100.0%) |
| Total (Category) | 50 (24.3%) | 156 (75.7%) |
| Total (Overall) | 465 (41.2%) | 663 (58.8%) |
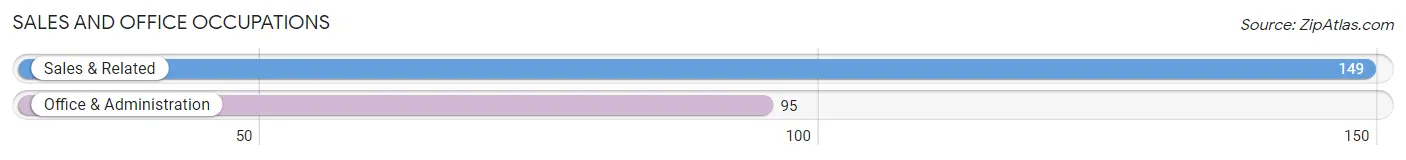
Sales and Office Occupations
The most common Sales and Office occupations in Munsons Corners are Sales & Related (149 | 13.2%), and Office & Administration (95 | 8.4%).
Sales and Office Occupations by Sex
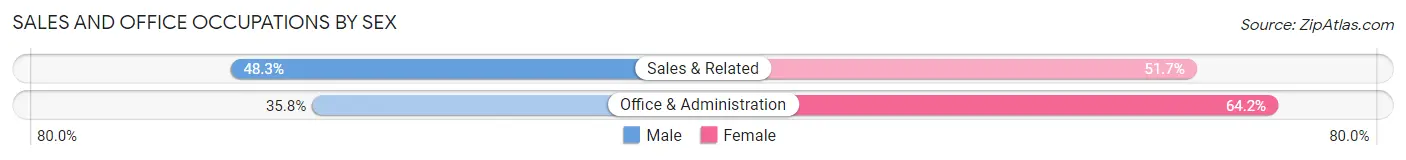
| Occupation | Male | Female |
| Sales & Related | 72 (48.3%) | 77 (51.7%) |
| Office & Administration | 34 (35.8%) | 61 (64.2%) |
| Total (Category) | 106 (43.4%) | 138 (56.6%) |
| Total (Overall) | 465 (41.2%) | 663 (58.8%) |
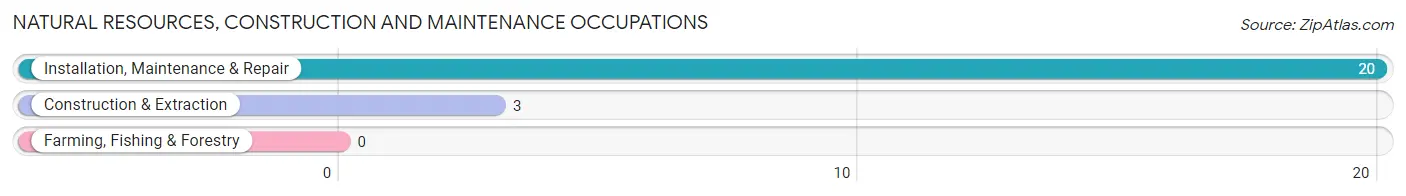
Natural Resources, Construction and Maintenance Occupations
The most common Natural Resources, Construction and Maintenance occupations in Munsons Corners are Installation, Maintenance & Repair (20 | 1.8%), and Construction & Extraction (3 | 0.3%).
Natural Resources, Construction and Maintenance Occupations by Sex
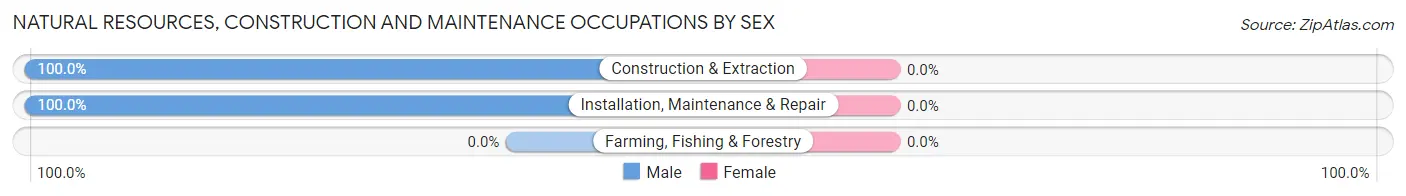
| Occupation | Male | Female |
| Farming, Fishing & Forestry | 0 (0.0%) | 0 (0.0%) |
| Construction & Extraction | 3 (100.0%) | 0 (0.0%) |
| Installation, Maintenance & Repair | 20 (100.0%) | 0 (0.0%) |
| Total (Category) | 23 (100.0%) | 0 (0.0%) |
| Total (Overall) | 465 (41.2%) | 663 (58.8%) |
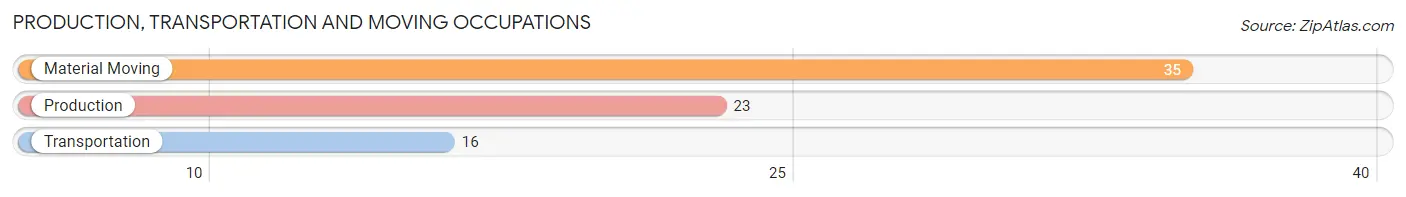
Production, Transportation and Moving Occupations
The most common Production, Transportation and Moving occupations in Munsons Corners are Material Moving (35 | 3.1%), Production (23 | 2.0%), and Transportation (16 | 1.4%).
Production, Transportation and Moving Occupations by Sex
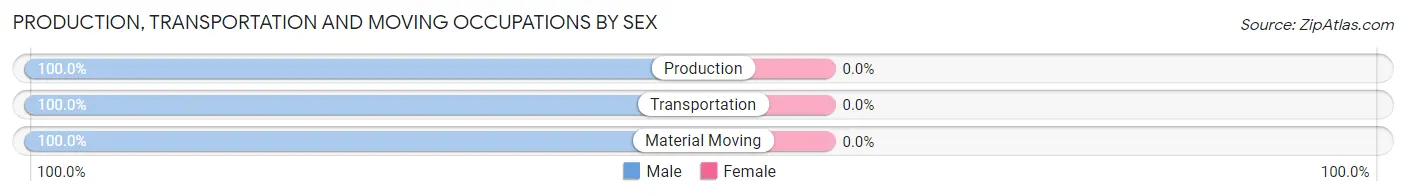
| Occupation | Male | Female |
| Production | 23 (100.0%) | 0 (0.0%) |
| Transportation | 16 (100.0%) | 0 (0.0%) |
| Material Moving | 35 (100.0%) | 0 (0.0%) |
| Total (Category) | 74 (100.0%) | 0 (0.0%) |
| Total (Overall) | 465 (41.2%) | 663 (58.8%) |
Employment Industries by Sex in Munsons Corners
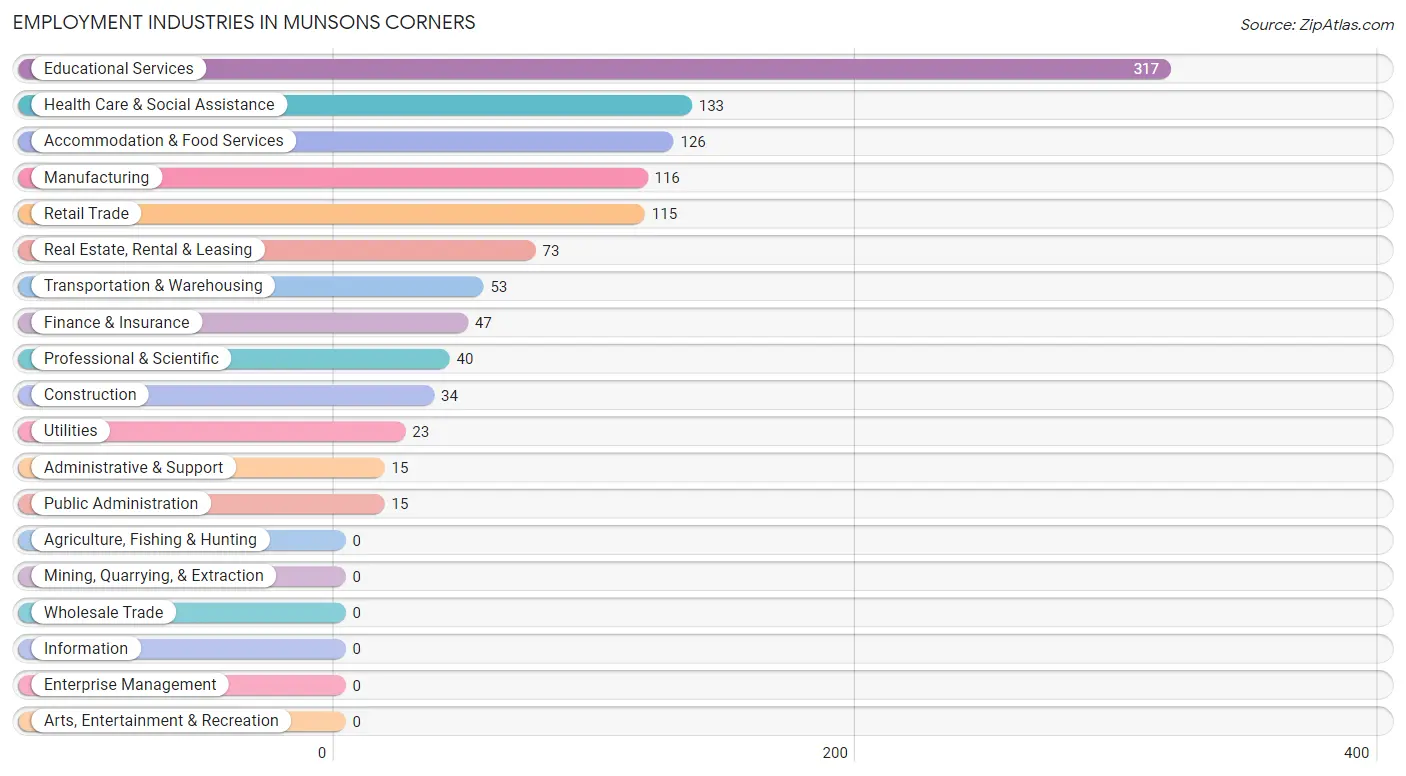
Employment Industries in Munsons Corners
The major employment industries in Munsons Corners include Educational Services (317 | 28.1%), Health Care & Social Assistance (133 | 11.8%), Accommodation & Food Services (126 | 11.2%), Manufacturing (116 | 10.3%), and Retail Trade (115 | 10.2%).
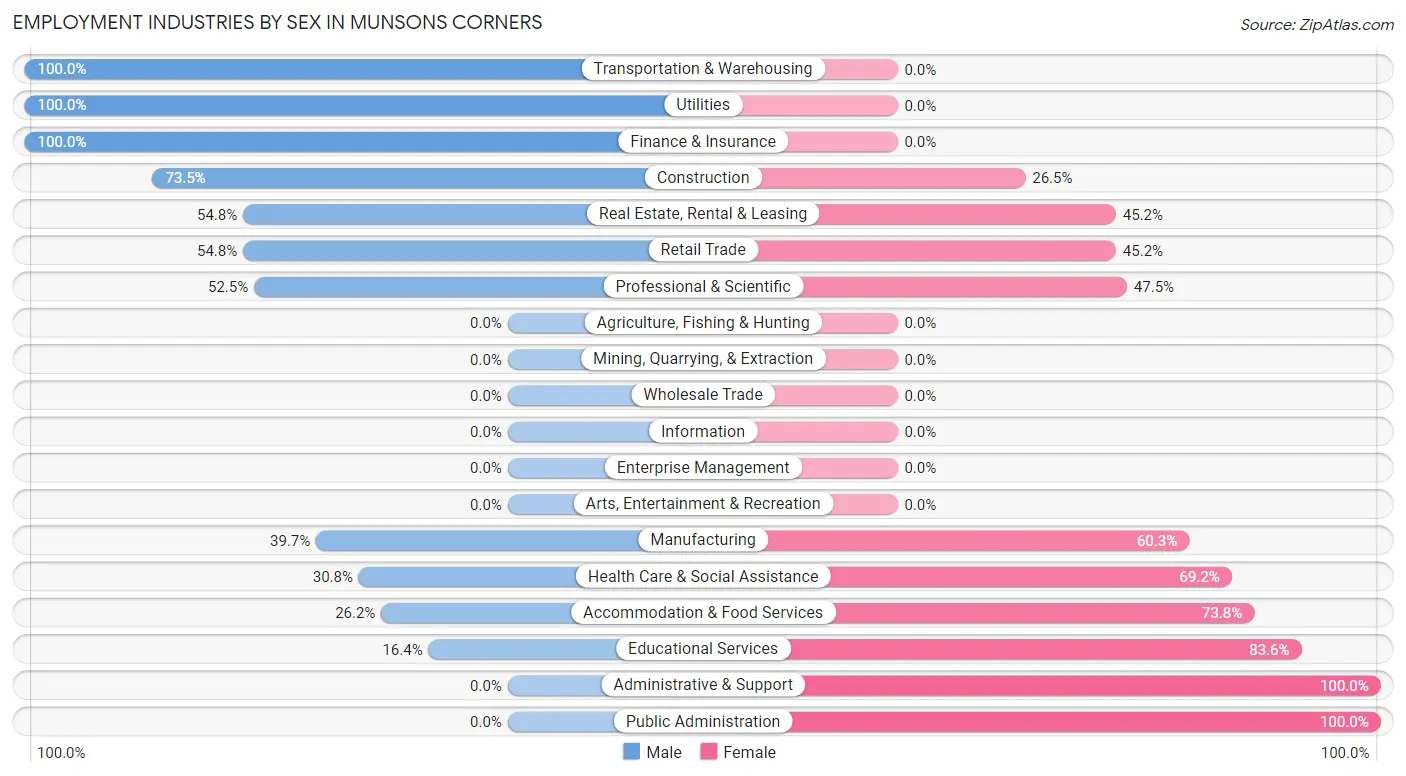
Employment Industries by Sex in Munsons Corners
The Munsons Corners industries that see more men than women are Transportation & Warehousing (100.0%), Utilities (100.0%), and Finance & Insurance (100.0%), whereas the industries that tend to have a higher number of women are Administrative & Support (100.0%), Public Administration (100.0%), and Educational Services (83.6%).
| Industry | Male | Female |
| Agriculture, Fishing & Hunting | 0 (0.0%) | 0 (0.0%) |
| Mining, Quarrying, & Extraction | 0 (0.0%) | 0 (0.0%) |
| Construction | 25 (73.5%) | 9 (26.5%) |
| Manufacturing | 46 (39.7%) | 70 (60.3%) |
| Wholesale Trade | 0 (0.0%) | 0 (0.0%) |
| Retail Trade | 63 (54.8%) | 52 (45.2%) |
| Transportation & Warehousing | 53 (100.0%) | 0 (0.0%) |
| Utilities | 23 (100.0%) | 0 (0.0%) |
| Information | 0 (0.0%) | 0 (0.0%) |
| Finance & Insurance | 47 (100.0%) | 0 (0.0%) |
| Real Estate, Rental & Leasing | 40 (54.8%) | 33 (45.2%) |
| Professional & Scientific | 21 (52.5%) | 19 (47.5%) |
| Enterprise Management | 0 (0.0%) | 0 (0.0%) |
| Administrative & Support | 0 (0.0%) | 15 (100.0%) |
| Educational Services | 52 (16.4%) | 265 (83.6%) |
| Health Care & Social Assistance | 41 (30.8%) | 92 (69.2%) |
| Arts, Entertainment & Recreation | 0 (0.0%) | 0 (0.0%) |
| Accommodation & Food Services | 33 (26.2%) | 93 (73.8%) |
| Public Administration | 0 (0.0%) | 15 (100.0%) |
| Total | 465 (41.2%) | 663 (58.8%) |
Education in Munsons Corners
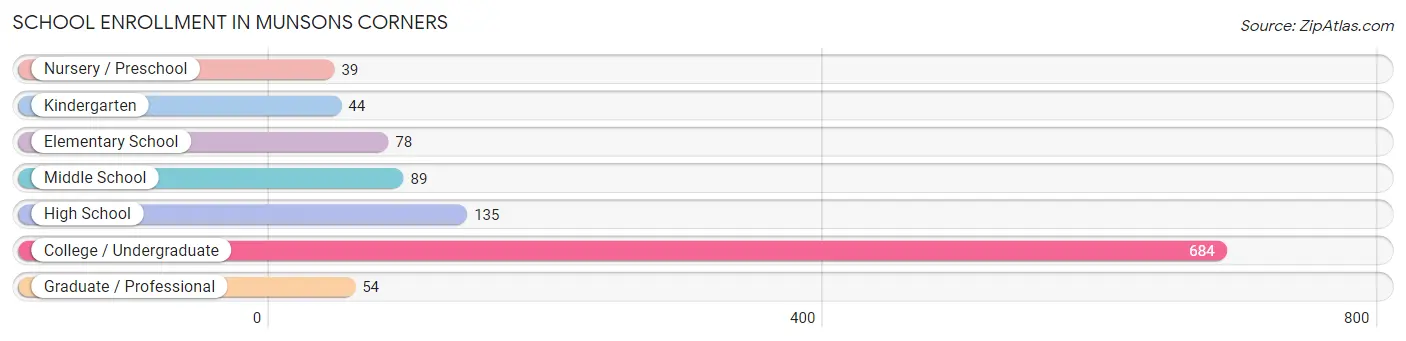
School Enrollment in Munsons Corners
The most common levels of schooling among the 1,123 students in Munsons Corners are college / undergraduate (684 | 60.9%), high school (135 | 12.0%), and middle school (89 | 7.9%).
| School Level | # Students | % Students |
| Nursery / Preschool | 39 | 3.5% |
| Kindergarten | 44 | 3.9% |
| Elementary School | 78 | 7.0% |
| Middle School | 89 | 7.9% |
| High School | 135 | 12.0% |
| College / Undergraduate | 684 | 60.9% |
| Graduate / Professional | 54 | 4.8% |
| Total | 1,123 | 100.0% |
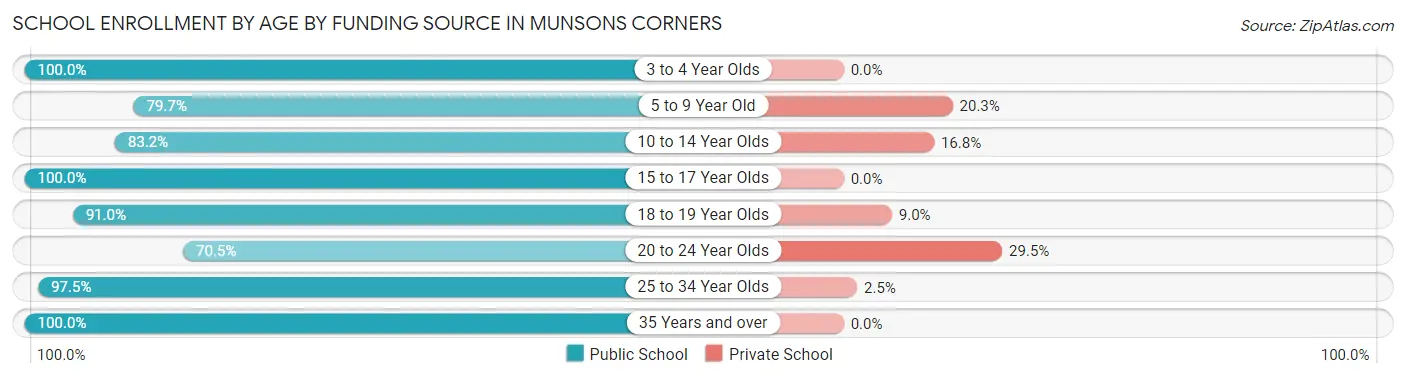
School Enrollment by Age by Funding Source in Munsons Corners
Out of a total of 1,123 students who are enrolled in schools in Munsons Corners, 168 (15.0%) attend a private institution, while the remaining 955 (85.0%) are enrolled in public schools. The age group of 20 to 24 year olds has the highest likelihood of being enrolled in private schools, with 93 (29.5% in the age bracket) enrolled. Conversely, the age group of 3 to 4 year olds has the lowest likelihood of being enrolled in a private school, with 23 (100.0% in the age bracket) attending a public institution.
| Age Bracket | Public School | Private School |
| 3 to 4 Year Olds | 23 (100.0%) | 0 (0.0%) |
| 5 to 9 Year Old | 110 (79.7%) | 28 (20.3%) |
| 10 to 14 Year Olds | 89 (83.2%) | 18 (16.8%) |
| 15 to 17 Year Olds | 136 (100.0%) | 0 (0.0%) |
| 18 to 19 Year Olds | 284 (91.0%) | 28 (9.0%) |
| 20 to 24 Year Olds | 222 (70.5%) | 93 (29.5%) |
| 25 to 34 Year Olds | 39 (97.5%) | 1 (2.5%) |
| 35 Years and over | 52 (100.0%) | 0 (0.0%) |
| Total | 955 (85.0%) | 168 (15.0%) |
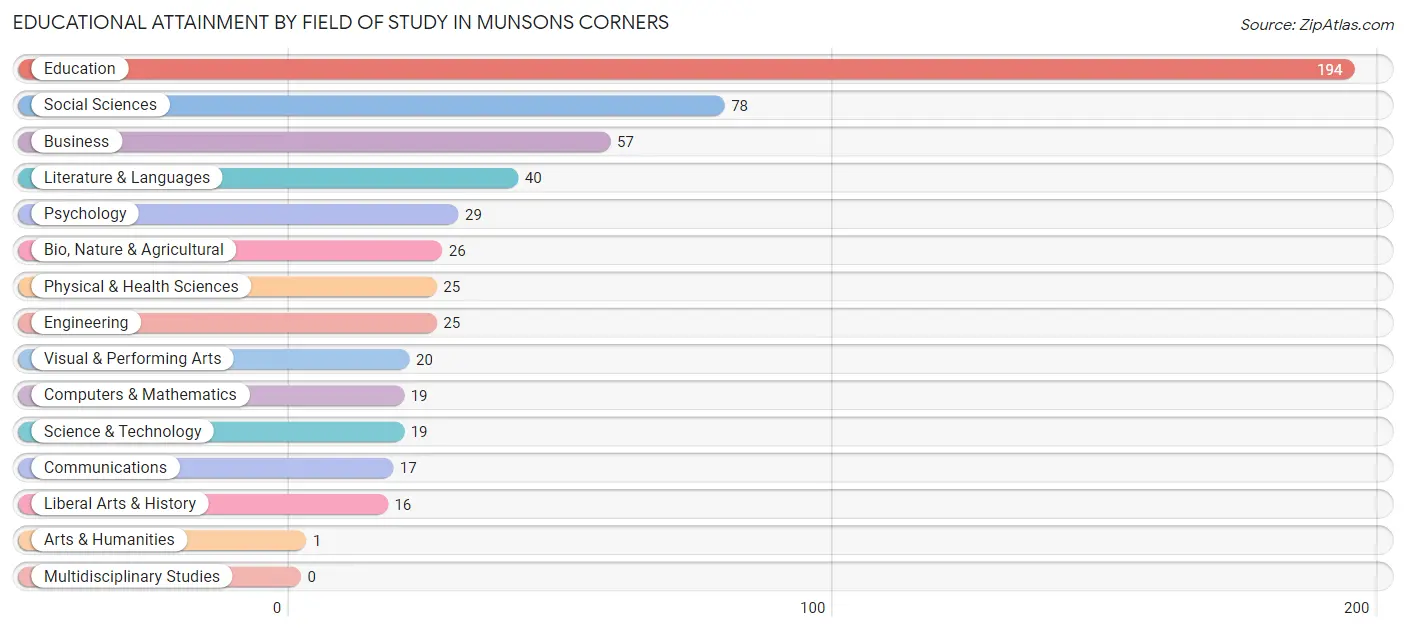
Educational Attainment by Field of Study in Munsons Corners
Education (194 | 34.3%), social sciences (78 | 13.8%), business (57 | 10.1%), literature & languages (40 | 7.1%), and psychology (29 | 5.1%) are the most common fields of study among 566 individuals in Munsons Corners who have obtained a bachelor's degree or higher.
| Field of Study | # Graduates | % Graduates |
| Computers & Mathematics | 19 | 3.4% |
| Bio, Nature & Agricultural | 26 | 4.6% |
| Physical & Health Sciences | 25 | 4.4% |
| Psychology | 29 | 5.1% |
| Social Sciences | 78 | 13.8% |
| Engineering | 25 | 4.4% |
| Multidisciplinary Studies | 0 | 0.0% |
| Science & Technology | 19 | 3.4% |
| Business | 57 | 10.1% |
| Education | 194 | 34.3% |
| Literature & Languages | 40 | 7.1% |
| Liberal Arts & History | 16 | 2.8% |
| Visual & Performing Arts | 20 | 3.5% |
| Communications | 17 | 3.0% |
| Arts & Humanities | 1 | 0.2% |
| Total | 566 | 100.0% |
Transportation & Commute in Munsons Corners
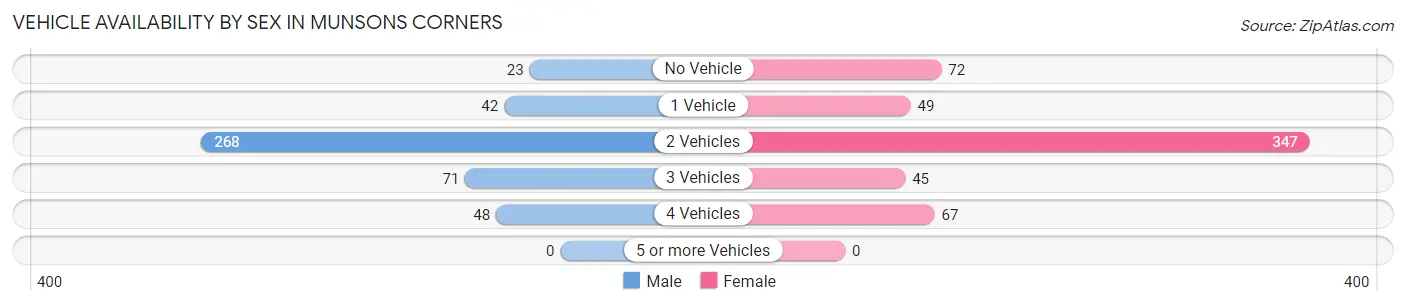
Vehicle Availability by Sex in Munsons Corners
The most prevalent vehicle ownership categories in Munsons Corners are males with 2 vehicles (268, accounting for 59.3%) and females with 2 vehicles (347, making up 46.2%).
| Vehicles Available | Male | Female |
| No Vehicle | 23 (5.1%) | 72 (12.4%) |
| 1 Vehicle | 42 (9.3%) | 49 (8.5%) |
| 2 Vehicles | 268 (59.3%) | 347 (59.8%) |
| 3 Vehicles | 71 (15.7%) | 45 (7.8%) |
| 4 Vehicles | 48 (10.6%) | 67 (11.6%) |
| 5 or more Vehicles | 0 (0.0%) | 0 (0.0%) |
| Total | 452 (100.0%) | 580 (100.0%) |
Commute Time in Munsons Corners
The most frequently occuring commute durations in Munsons Corners are 5 to 9 minutes (375 commuters, 39.7%), 10 to 14 minutes (146 commuters, 15.5%), and 15 to 19 minutes (115 commuters, 12.2%).
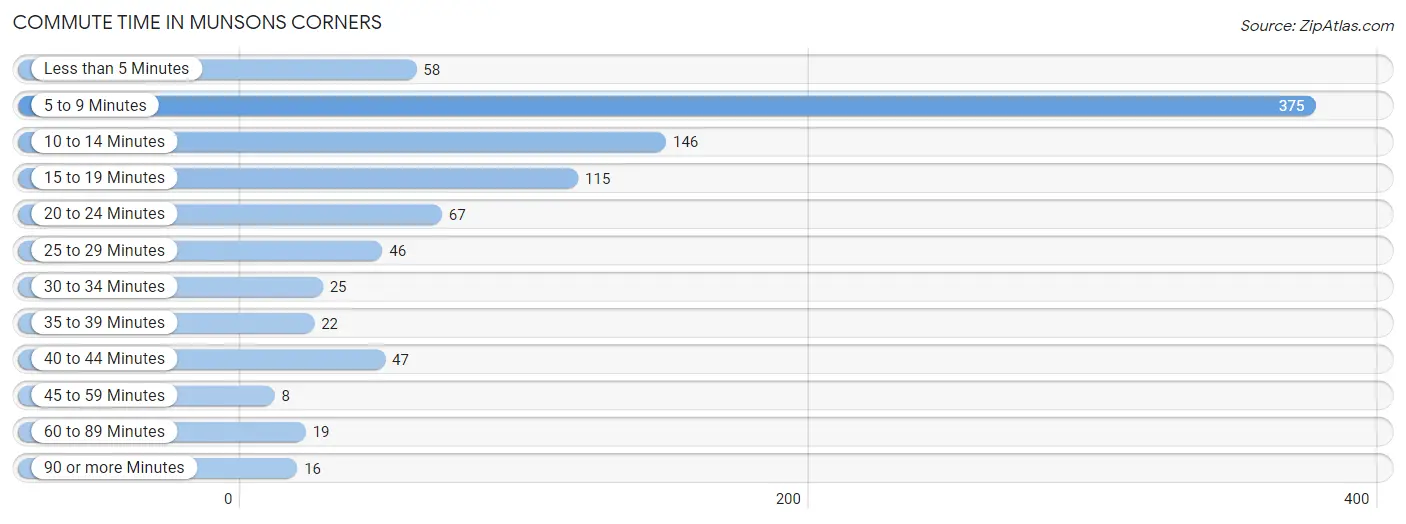
| Commute Time | # Commuters | % Commuters |
| Less than 5 Minutes | 58 | 6.1% |
| 5 to 9 Minutes | 375 | 39.7% |
| 10 to 14 Minutes | 146 | 15.5% |
| 15 to 19 Minutes | 115 | 12.2% |
| 20 to 24 Minutes | 67 | 7.1% |
| 25 to 29 Minutes | 46 | 4.9% |
| 30 to 34 Minutes | 25 | 2.6% |
| 35 to 39 Minutes | 22 | 2.3% |
| 40 to 44 Minutes | 47 | 5.0% |
| 45 to 59 Minutes | 8 | 0.9% |
| 60 to 89 Minutes | 19 | 2.0% |
| 90 or more Minutes | 16 | 1.7% |
Commute Time by Sex in Munsons Corners
The most common commute times in Munsons Corners are 5 to 9 minutes (93 commuters, 26.3%) for males and 5 to 9 minutes (282 commuters, 47.8%) for females.
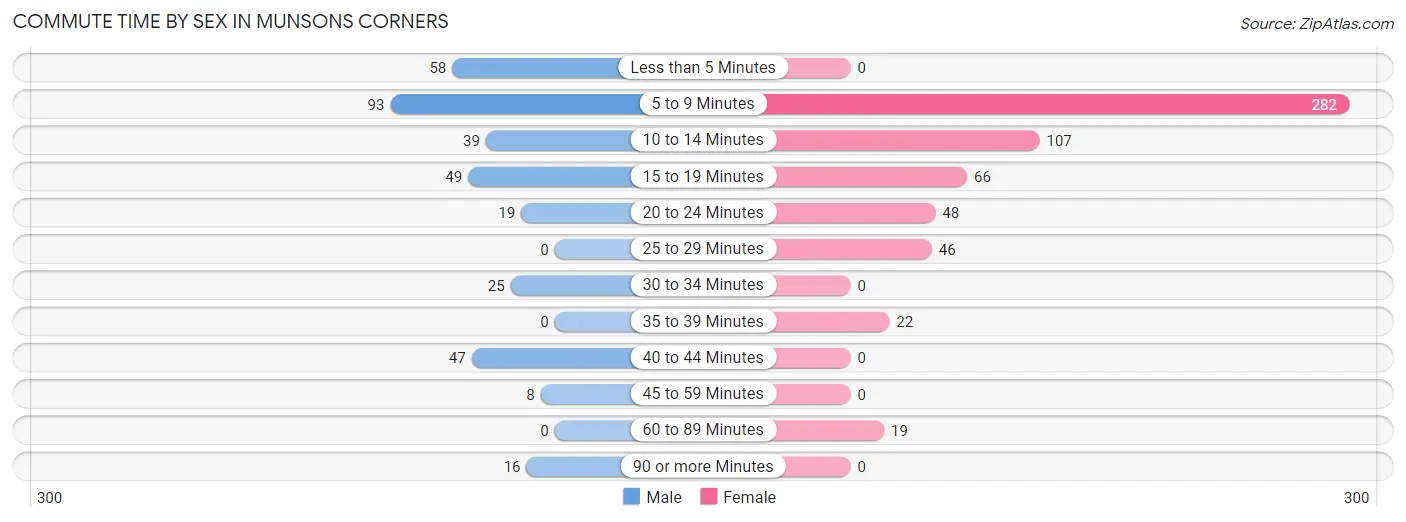
| Commute Time | Male | Female |
| Less than 5 Minutes | 58 (16.4%) | 0 (0.0%) |
| 5 to 9 Minutes | 93 (26.3%) | 282 (47.8%) |
| 10 to 14 Minutes | 39 (11.0%) | 107 (18.1%) |
| 15 to 19 Minutes | 49 (13.8%) | 66 (11.2%) |
| 20 to 24 Minutes | 19 (5.4%) | 48 (8.1%) |
| 25 to 29 Minutes | 0 (0.0%) | 46 (7.8%) |
| 30 to 34 Minutes | 25 (7.1%) | 0 (0.0%) |
| 35 to 39 Minutes | 0 (0.0%) | 22 (3.7%) |
| 40 to 44 Minutes | 47 (13.3%) | 0 (0.0%) |
| 45 to 59 Minutes | 8 (2.3%) | 0 (0.0%) |
| 60 to 89 Minutes | 0 (0.0%) | 19 (3.2%) |
| 90 or more Minutes | 16 (4.5%) | 0 (0.0%) |
Time of Departure to Work by Sex in Munsons Corners
The most frequent times of departure to work in Munsons Corners are 7:30 AM to 7:59 AM (104, 29.4%) for males and 12:00 PM to 3:59 PM (108, 18.3%) for females.
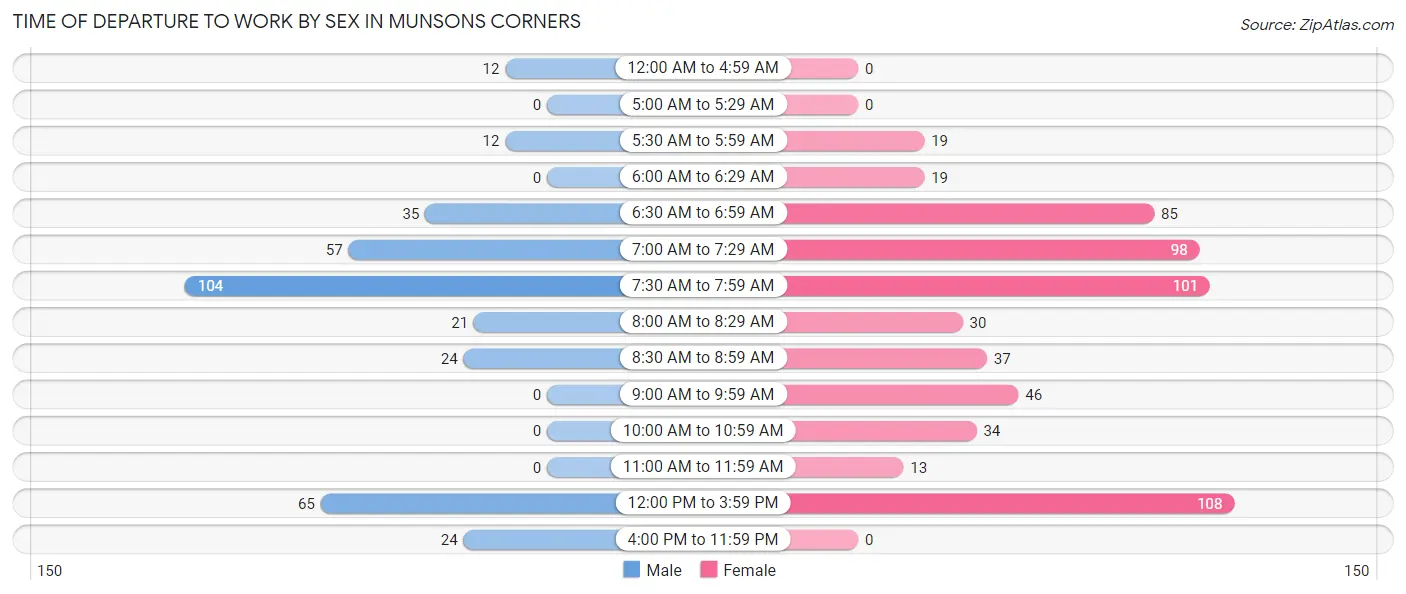
| Time of Departure | Male | Female |
| 12:00 AM to 4:59 AM | 12 (3.4%) | 0 (0.0%) |
| 5:00 AM to 5:29 AM | 0 (0.0%) | 0 (0.0%) |
| 5:30 AM to 5:59 AM | 12 (3.4%) | 19 (3.2%) |
| 6:00 AM to 6:29 AM | 0 (0.0%) | 19 (3.2%) |
| 6:30 AM to 6:59 AM | 35 (9.9%) | 85 (14.4%) |
| 7:00 AM to 7:29 AM | 57 (16.1%) | 98 (16.6%) |
| 7:30 AM to 7:59 AM | 104 (29.4%) | 101 (17.1%) |
| 8:00 AM to 8:29 AM | 21 (5.9%) | 30 (5.1%) |
| 8:30 AM to 8:59 AM | 24 (6.8%) | 37 (6.3%) |
| 9:00 AM to 9:59 AM | 0 (0.0%) | 46 (7.8%) |
| 10:00 AM to 10:59 AM | 0 (0.0%) | 34 (5.8%) |
| 11:00 AM to 11:59 AM | 0 (0.0%) | 13 (2.2%) |
| 12:00 PM to 3:59 PM | 65 (18.4%) | 108 (18.3%) |
| 4:00 PM to 11:59 PM | 24 (6.8%) | 0 (0.0%) |
| Total | 354 (100.0%) | 590 (100.0%) |
Housing Occupancy in Munsons Corners
Occupancy by Ownership in Munsons Corners
Of the total 984 dwellings in Munsons Corners, owner-occupied units account for 565 (57.4%), while renter-occupied units make up 419 (42.6%).
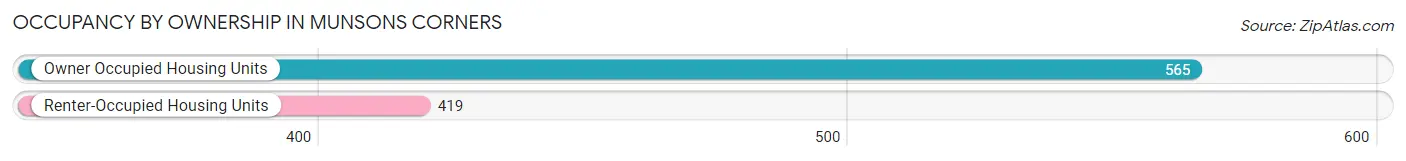
| Occupancy | # Housing Units | % Housing Units |
| Owner Occupied Housing Units | 565 | 57.4% |
| Renter-Occupied Housing Units | 419 | 42.6% |
| Total Occupied Housing Units | 984 | 100.0% |
Occupancy by Household Size in Munsons Corners
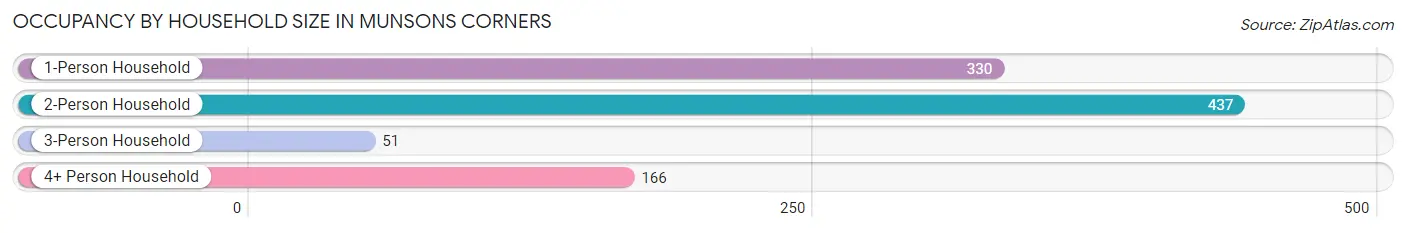
| Household Size | # Housing Units | % Housing Units |
| 1-Person Household | 330 | 33.5% |
| 2-Person Household | 437 | 44.4% |
| 3-Person Household | 51 | 5.2% |
| 4+ Person Household | 166 | 16.9% |
| Total Housing Units | 984 | 100.0% |
Occupancy by Ownership by Household Size in Munsons Corners
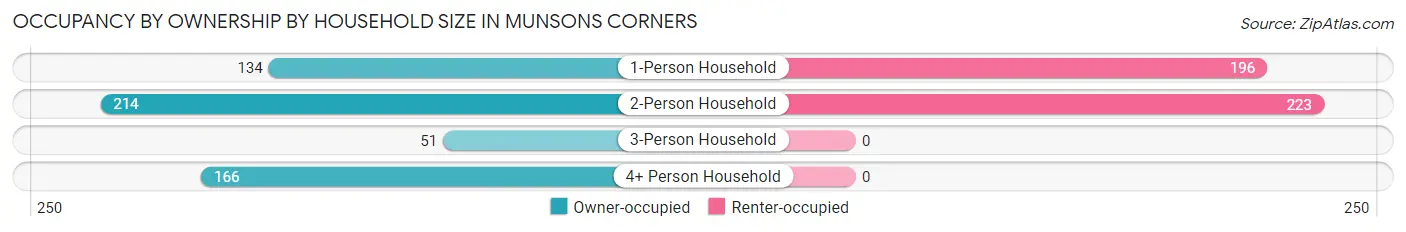
| Household Size | Owner-occupied | Renter-occupied |
| 1-Person Household | 134 (40.6%) | 196 (59.4%) |
| 2-Person Household | 214 (49.0%) | 223 (51.0%) |
| 3-Person Household | 51 (100.0%) | 0 (0.0%) |
| 4+ Person Household | 166 (100.0%) | 0 (0.0%) |
| Total Housing Units | 565 (57.4%) | 419 (42.6%) |
Occupancy by Educational Attainment in Munsons Corners
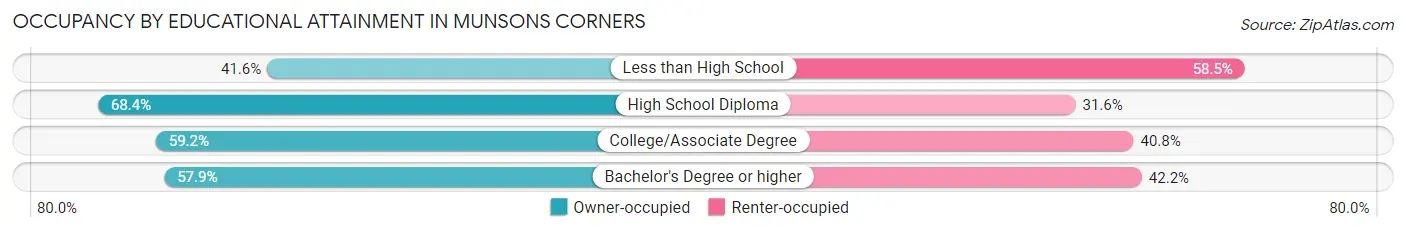
| Household Size | Owner-occupied | Renter-occupied |
| Less than High School | 59 (41.5%) | 83 (58.5%) |
| High School Diploma | 93 (68.4%) | 43 (31.6%) |
| College/Associate Degree | 203 (59.2%) | 140 (40.8%) |
| Bachelor's Degree or higher | 210 (57.9%) | 153 (42.1%) |
Occupancy by Age of Householder in Munsons Corners
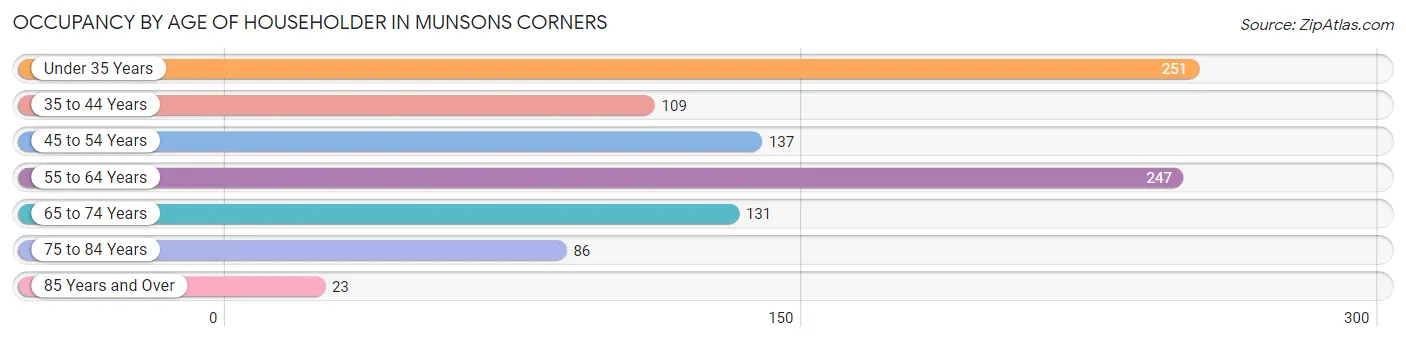
| Age Bracket | # Households | % Households |
| Under 35 Years | 251 | 25.5% |
| 35 to 44 Years | 109 | 11.1% |
| 45 to 54 Years | 137 | 13.9% |
| 55 to 64 Years | 247 | 25.1% |
| 65 to 74 Years | 131 | 13.3% |
| 75 to 84 Years | 86 | 8.7% |
| 85 Years and Over | 23 | 2.3% |
| Total | 984 | 100.0% |
Housing Finances in Munsons Corners
Median Income by Occupancy in Munsons Corners
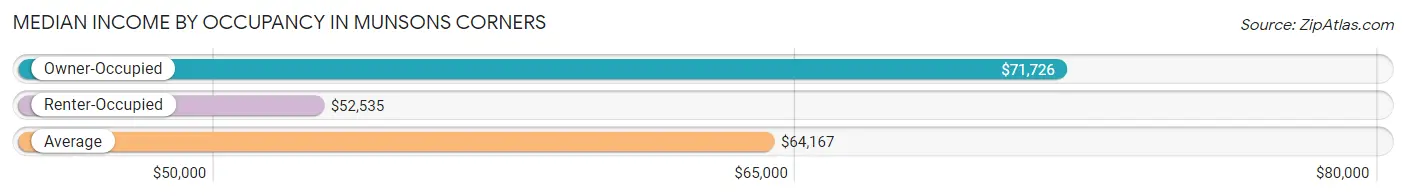
| Occupancy Type | # Households | Median Income |
| Owner-Occupied | 565 (57.4%) | $71,726 |
| Renter-Occupied | 419 (42.6%) | $52,535 |
| Average | 984 (100.0%) | $64,167 |
Occupancy by Householder Income Bracket in Munsons Corners
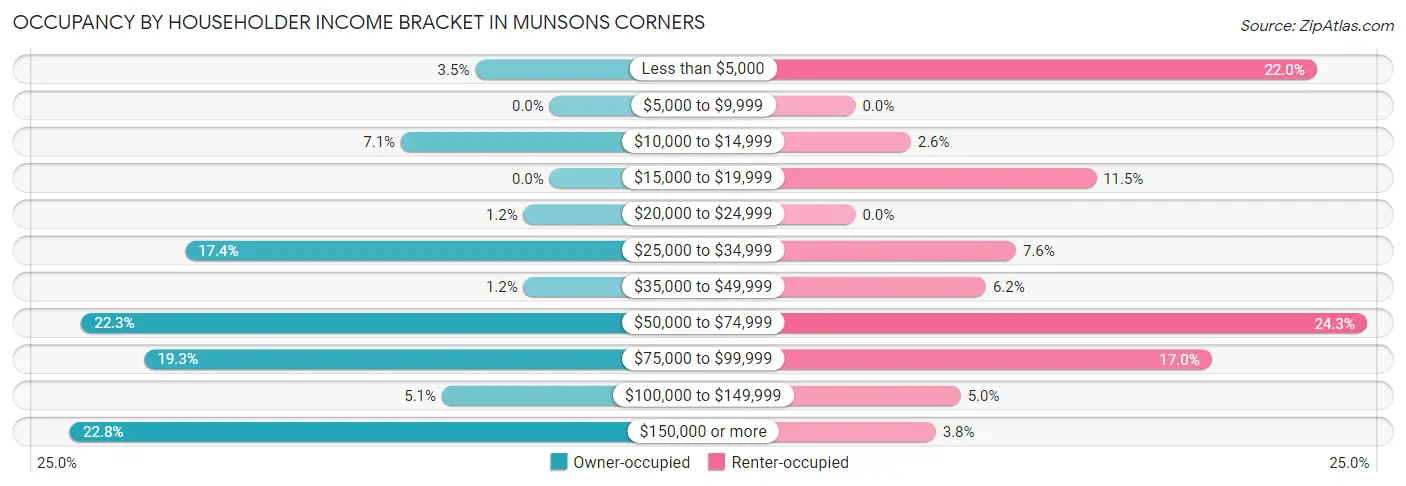
| Income Bracket | Owner-occupied | Renter-occupied |
| Less than $5,000 | 20 (3.5%) | 92 (22.0%) |
| $5,000 to $9,999 | 0 (0.0%) | 0 (0.0%) |
| $10,000 to $14,999 | 40 (7.1%) | 11 (2.6%) |
| $15,000 to $19,999 | 0 (0.0%) | 48 (11.5%) |
| $20,000 to $24,999 | 7 (1.2%) | 0 (0.0%) |
| $25,000 to $34,999 | 98 (17.3%) | 32 (7.6%) |
| $35,000 to $49,999 | 7 (1.2%) | 26 (6.2%) |
| $50,000 to $74,999 | 126 (22.3%) | 102 (24.3%) |
| $75,000 to $99,999 | 109 (19.3%) | 71 (17.0%) |
| $100,000 to $149,999 | 29 (5.1%) | 21 (5.0%) |
| $150,000 or more | 129 (22.8%) | 16 (3.8%) |
| Total | 565 (100.0%) | 419 (100.0%) |
Monthly Housing Cost Tiers in Munsons Corners
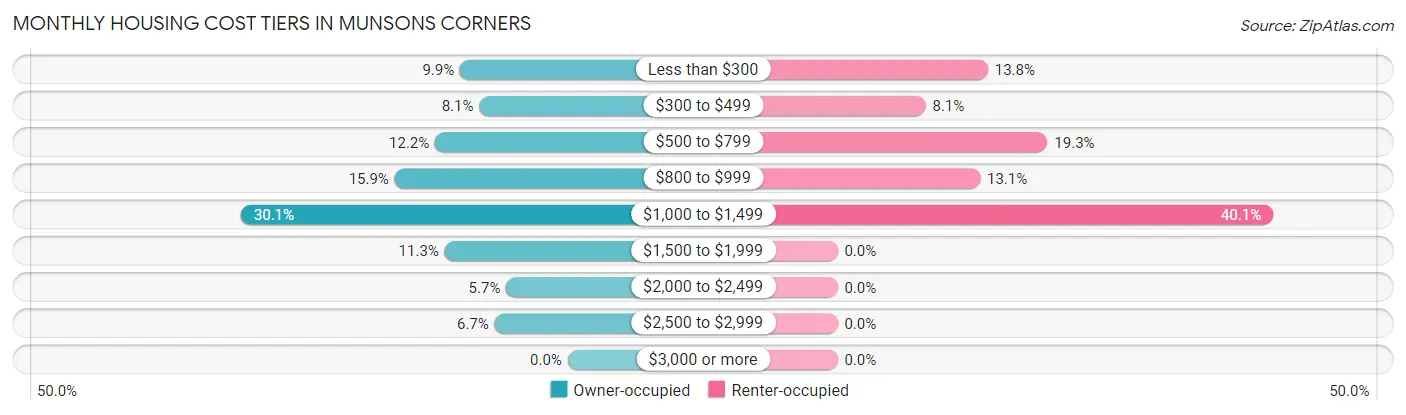
| Monthly Cost | Owner-occupied | Renter-occupied |
| Less than $300 | 56 (9.9%) | 58 (13.8%) |
| $300 to $499 | 46 (8.1%) | 34 (8.1%) |
| $500 to $799 | 69 (12.2%) | 81 (19.3%) |
| $800 to $999 | 90 (15.9%) | 55 (13.1%) |
| $1,000 to $1,499 | 170 (30.1%) | 168 (40.1%) |
| $1,500 to $1,999 | 64 (11.3%) | 0 (0.0%) |
| $2,000 to $2,499 | 32 (5.7%) | 0 (0.0%) |
| $2,500 to $2,999 | 38 (6.7%) | 0 (0.0%) |
| $3,000 or more | 0 (0.0%) | 0 (0.0%) |
| Total | 565 (100.0%) | 419 (100.0%) |
Physical Housing Characteristics in Munsons Corners
Housing Structures in Munsons Corners
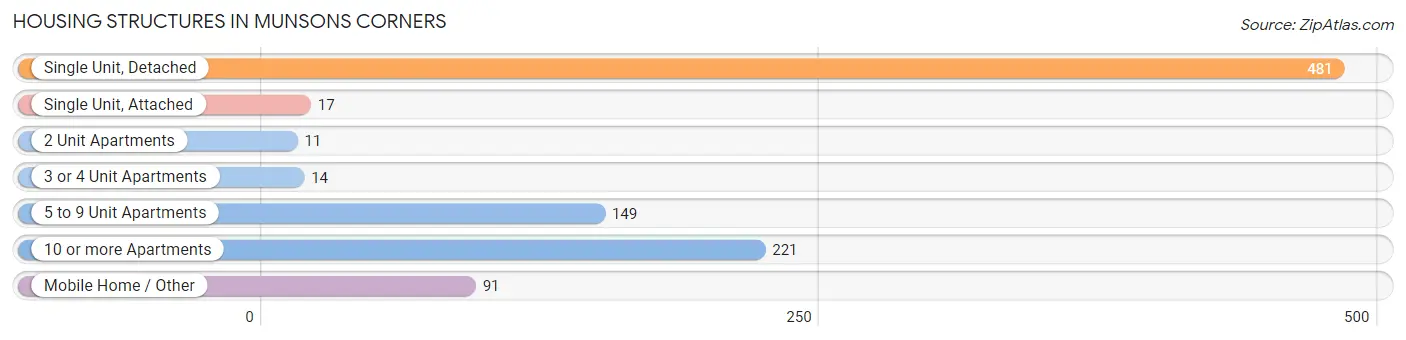
| Structure Type | # Housing Units | % Housing Units |
| Single Unit, Detached | 481 | 48.9% |
| Single Unit, Attached | 17 | 1.7% |
| 2 Unit Apartments | 11 | 1.1% |
| 3 or 4 Unit Apartments | 14 | 1.4% |
| 5 to 9 Unit Apartments | 149 | 15.1% |
| 10 or more Apartments | 221 | 22.5% |
| Mobile Home / Other | 91 | 9.2% |
| Total | 984 | 100.0% |
Housing Structures by Occupancy in Munsons Corners
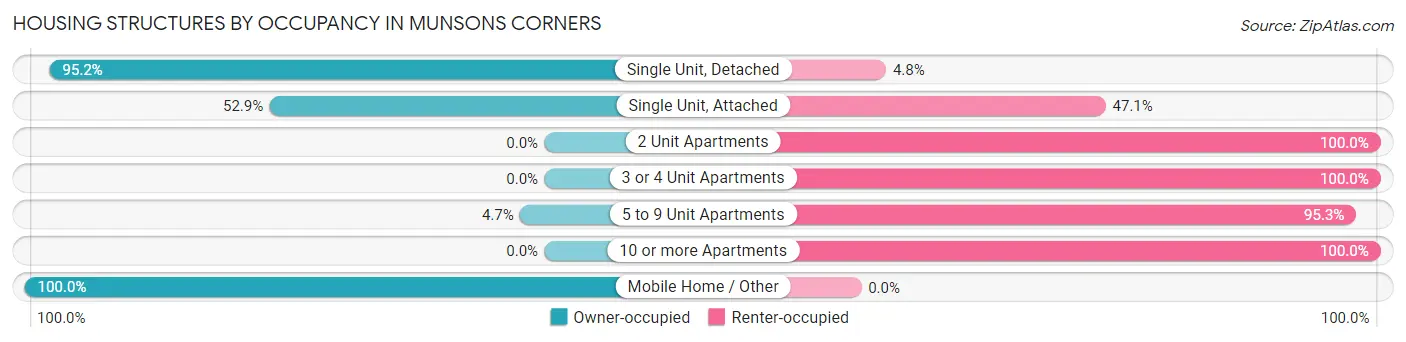
| Structure Type | Owner-occupied | Renter-occupied |
| Single Unit, Detached | 458 (95.2%) | 23 (4.8%) |
| Single Unit, Attached | 9 (52.9%) | 8 (47.1%) |
| 2 Unit Apartments | 0 (0.0%) | 11 (100.0%) |
| 3 or 4 Unit Apartments | 0 (0.0%) | 14 (100.0%) |
| 5 to 9 Unit Apartments | 7 (4.7%) | 142 (95.3%) |
| 10 or more Apartments | 0 (0.0%) | 221 (100.0%) |
| Mobile Home / Other | 91 (100.0%) | 0 (0.0%) |
| Total | 565 (57.4%) | 419 (42.6%) |
Housing Structures by Number of Rooms in Munsons Corners
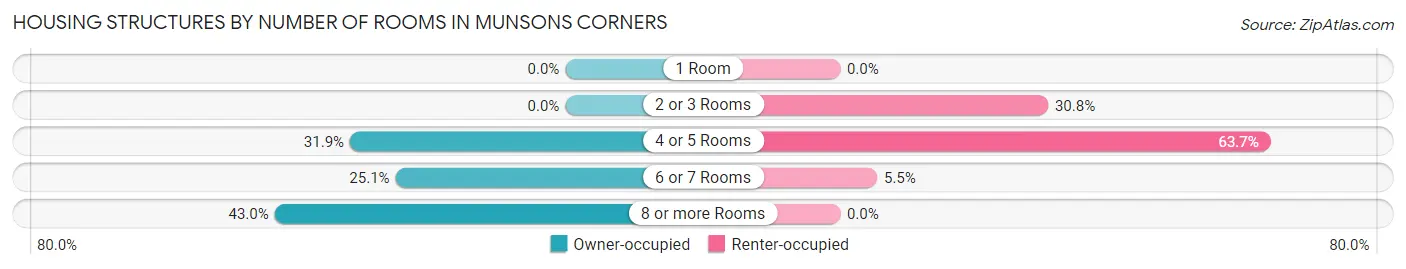
| Number of Rooms | Owner-occupied | Renter-occupied |
| 1 Room | 0 (0.0%) | 0 (0.0%) |
| 2 or 3 Rooms | 0 (0.0%) | 129 (30.8%) |
| 4 or 5 Rooms | 180 (31.9%) | 267 (63.7%) |
| 6 or 7 Rooms | 142 (25.1%) | 23 (5.5%) |
| 8 or more Rooms | 243 (43.0%) | 0 (0.0%) |
| Total | 565 (100.0%) | 419 (100.0%) |
Housing Structure by Heating Type in Munsons Corners
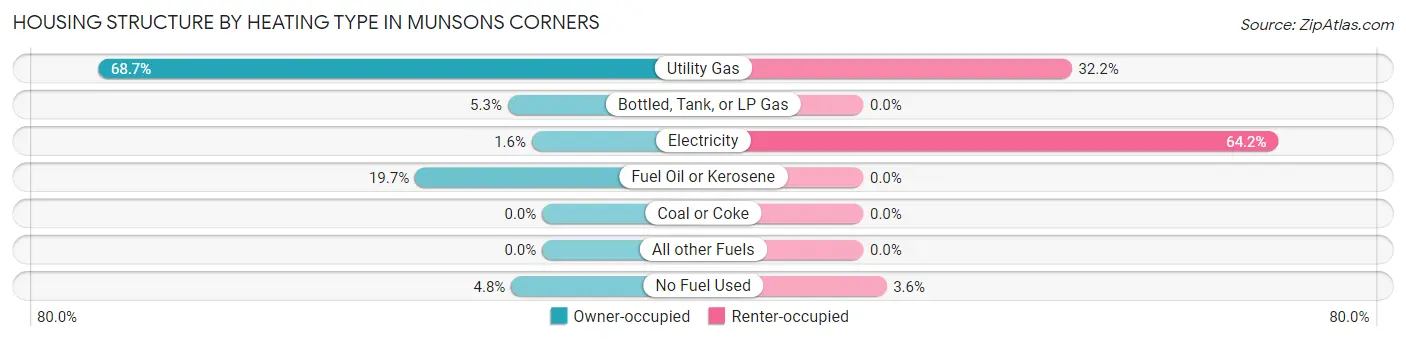
| Heating Type | Owner-occupied | Renter-occupied |
| Utility Gas | 388 (68.7%) | 135 (32.2%) |
| Bottled, Tank, or LP Gas | 30 (5.3%) | 0 (0.0%) |
| Electricity | 9 (1.6%) | 269 (64.2%) |
| Fuel Oil or Kerosene | 111 (19.7%) | 0 (0.0%) |
| Coal or Coke | 0 (0.0%) | 0 (0.0%) |
| All other Fuels | 0 (0.0%) | 0 (0.0%) |
| No Fuel Used | 27 (4.8%) | 15 (3.6%) |
| Total | 565 (100.0%) | 419 (100.0%) |
Household Vehicle Usage in Munsons Corners
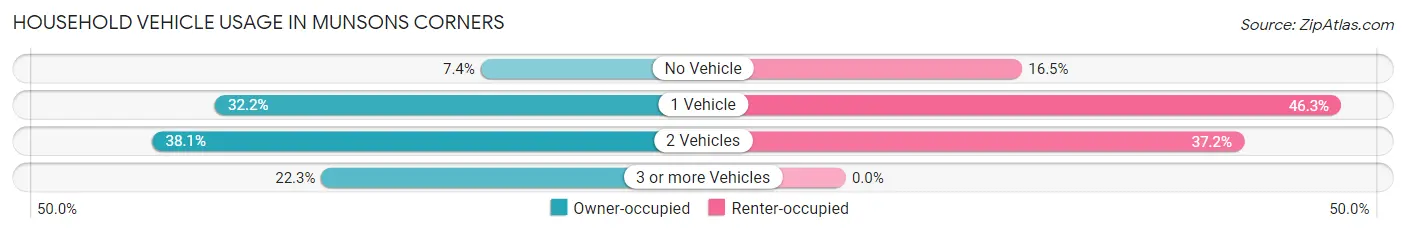
| Vehicles per Household | Owner-occupied | Renter-occupied |
| No Vehicle | 42 (7.4%) | 69 (16.5%) |
| 1 Vehicle | 182 (32.2%) | 194 (46.3%) |
| 2 Vehicles | 215 (38.1%) | 156 (37.2%) |
| 3 or more Vehicles | 126 (22.3%) | 0 (0.0%) |
| Total | 565 (100.0%) | 419 (100.0%) |
Real Estate & Mortgages in Munsons Corners
Real Estate and Mortgage Overview in Munsons Corners
| Characteristic | Without Mortgage | With Mortgage |
| Housing Units | 213 | 352 |
| Median Property Value | - | - |
| Median Household Income | - | - |
| Monthly Housing Costs | $525 | $0 |
| Real Estate Taxes | $3,571 | $7 |
Property Value by Mortgage Status in Munsons Corners
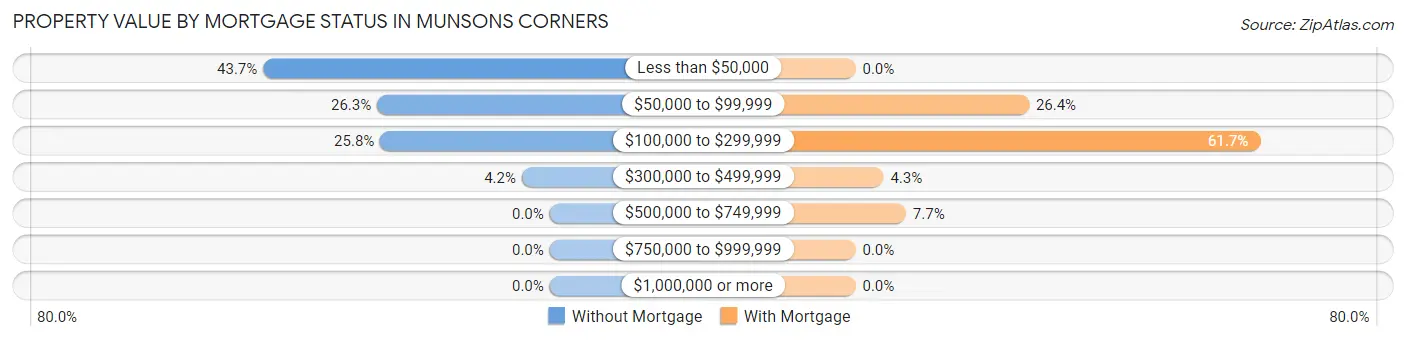
| Property Value | Without Mortgage | With Mortgage |
| Less than $50,000 | 93 (43.7%) | 0 (0.0%) |
| $50,000 to $99,999 | 56 (26.3%) | 93 (26.4%) |
| $100,000 to $299,999 | 55 (25.8%) | 217 (61.7%) |
| $300,000 to $499,999 | 9 (4.2%) | 15 (4.3%) |
| $500,000 to $749,999 | 0 (0.0%) | 27 (7.7%) |
| $750,000 to $999,999 | 0 (0.0%) | 0 (0.0%) |
| $1,000,000 or more | 0 (0.0%) | 0 (0.0%) |
| Total | 213 (100.0%) | 352 (100.0%) |
Household Income by Mortgage Status in Munsons Corners
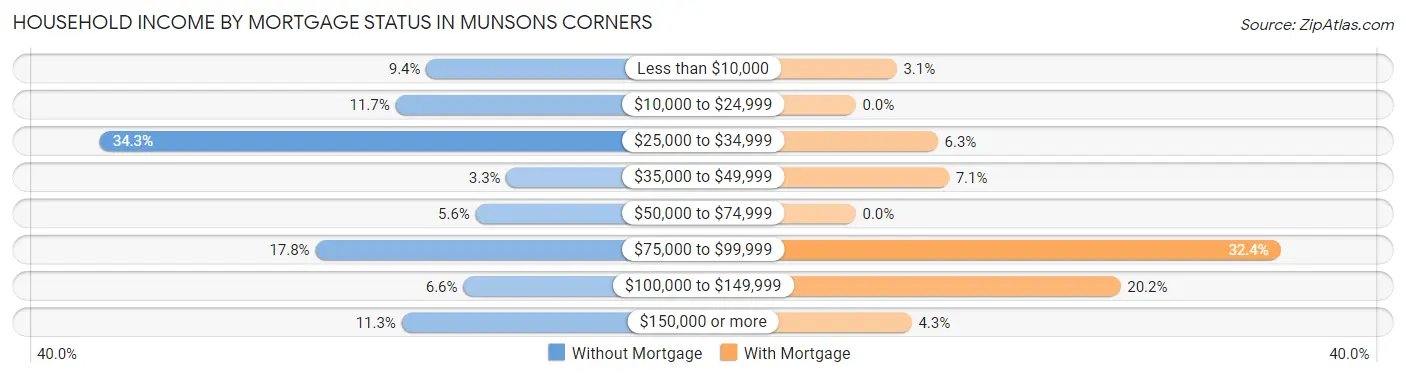
| Household Income | Without Mortgage | With Mortgage |
| Less than $10,000 | 20 (9.4%) | 11 (3.1%) |
| $10,000 to $24,999 | 25 (11.7%) | 0 (0.0%) |
| $25,000 to $34,999 | 73 (34.3%) | 22 (6.2%) |
| $35,000 to $49,999 | 7 (3.3%) | 25 (7.1%) |
| $50,000 to $74,999 | 12 (5.6%) | 0 (0.0%) |
| $75,000 to $99,999 | 38 (17.8%) | 114 (32.4%) |
| $100,000 to $149,999 | 14 (6.6%) | 71 (20.2%) |
| $150,000 or more | 24 (11.3%) | 15 (4.3%) |
| Total | 213 (100.0%) | 352 (100.0%) |
Property Value to Household Income Ratio in Munsons Corners
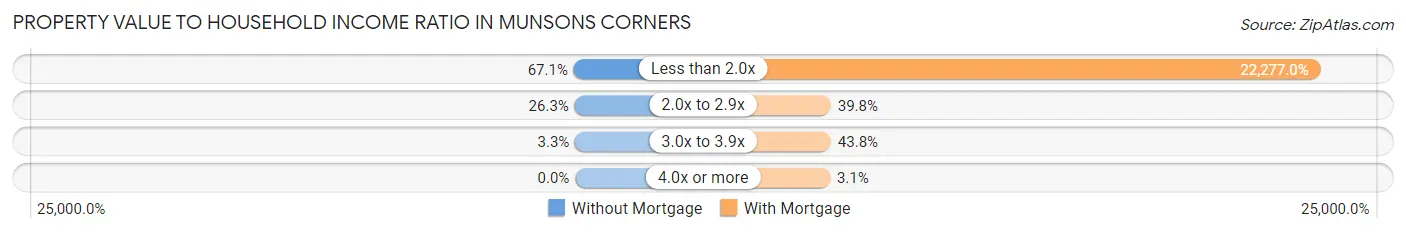
| Value-to-Income Ratio | Without Mortgage | With Mortgage |
| Less than 2.0x | 143 (67.1%) | 78,415 (22,277.0%) |
| 2.0x to 2.9x | 56 (26.3%) | 140 (39.8%) |
| 3.0x to 3.9x | 7 (3.3%) | 154 (43.8%) |
| 4.0x or more | 0 (0.0%) | 11 (3.1%) |
| Total | 213 (100.0%) | 352 (100.0%) |
Real Estate Taxes by Mortgage Status in Munsons Corners
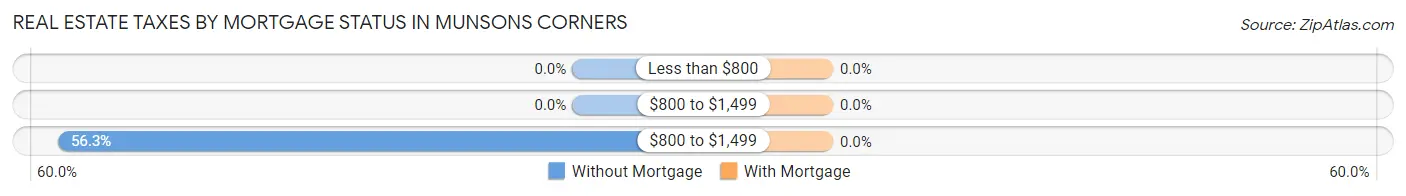
| Property Taxes | Without Mortgage | With Mortgage |
| Less than $800 | 0 (0.0%) | 0 (0.0%) |
| $800 to $1,499 | 0 (0.0%) | 0 (0.0%) |
| $800 to $1,499 | 120 (56.3%) | 0 (0.0%) |
| Total | 213 (100.0%) | 352 (100.0%) |
Health & Disability in Munsons Corners
Health Insurance Coverage by Age in Munsons Corners
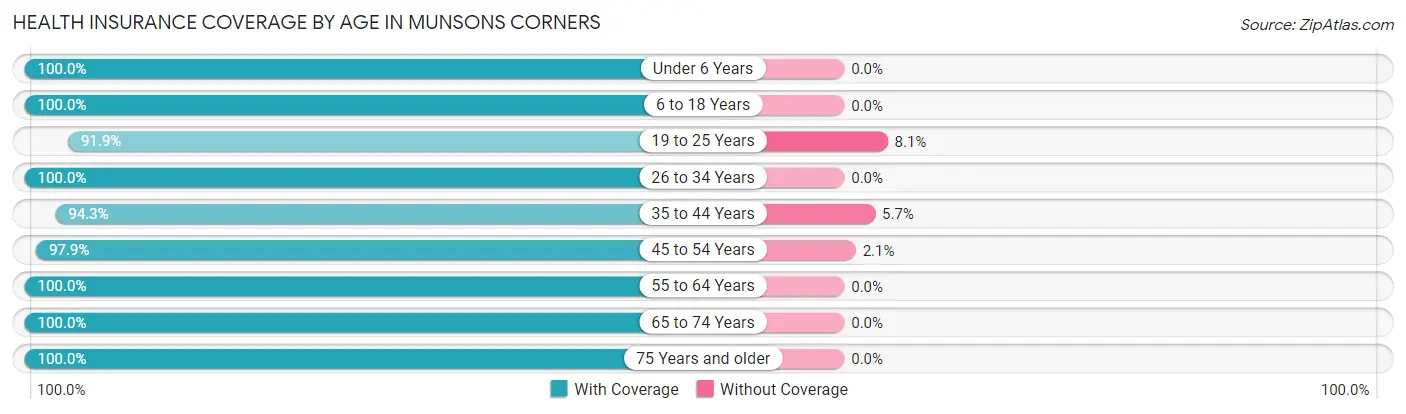
| Age Bracket | With Coverage | Without Coverage |
| Under 6 Years | 184 (100.0%) | 0 (0.0%) |
| 6 to 18 Years | 481 (100.0%) | 0 (0.0%) |
| 19 to 25 Years | 580 (91.9%) | 51 (8.1%) |
| 26 to 34 Years | 258 (100.0%) | 0 (0.0%) |
| 35 to 44 Years | 197 (94.3%) | 12 (5.7%) |
| 45 to 54 Years | 230 (97.9%) | 5 (2.1%) |
| 55 to 64 Years | 279 (100.0%) | 0 (0.0%) |
| 65 to 74 Years | 206 (100.0%) | 0 (0.0%) |
| 75 Years and older | 158 (100.0%) | 0 (0.0%) |
| Total | 2,573 (97.4%) | 68 (2.6%) |
Health Insurance Coverage by Citizenship Status in Munsons Corners
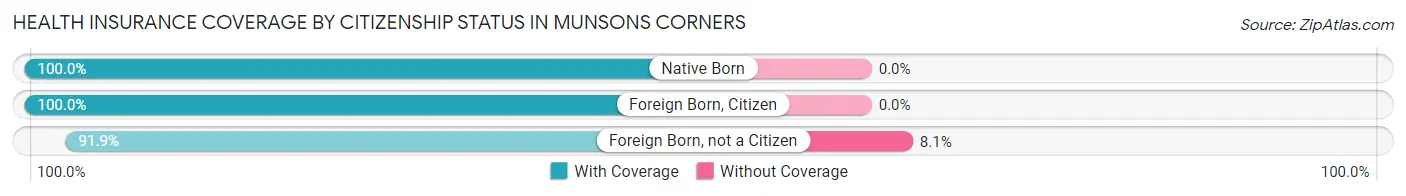
| Citizenship Status | With Coverage | Without Coverage |
| Native Born | 184 (100.0%) | 0 (0.0%) |
| Foreign Born, Citizen | 481 (100.0%) | 0 (0.0%) |
| Foreign Born, not a Citizen | 580 (91.9%) | 51 (8.1%) |
Health Insurance Coverage by Household Income in Munsons Corners
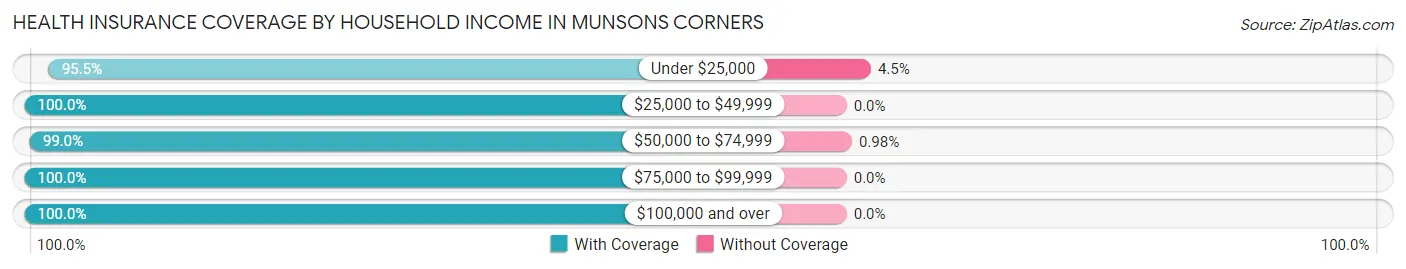
| Household Income | With Coverage | Without Coverage |
| Under $25,000 | 253 (95.5%) | 12 (4.5%) |
| $25,000 to $49,999 | 251 (100.0%) | 0 (0.0%) |
| $50,000 to $74,999 | 507 (99.0%) | 5 (1.0%) |
| $75,000 to $99,999 | 602 (100.0%) | 0 (0.0%) |
| $100,000 and over | 559 (100.0%) | 0 (0.0%) |
Public vs Private Health Insurance Coverage by Age in Munsons Corners
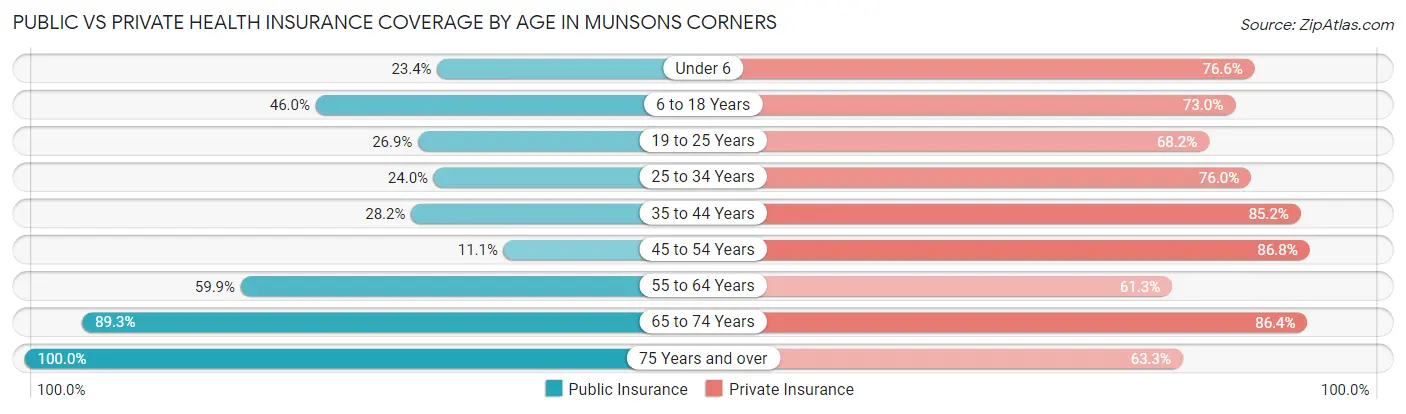
| Age Bracket | Public Insurance | Private Insurance |
| Under 6 | 43 (23.4%) | 141 (76.6%) |
| 6 to 18 Years | 221 (46.0%) | 351 (73.0%) |
| 19 to 25 Years | 170 (26.9%) | 430 (68.1%) |
| 25 to 34 Years | 62 (24.0%) | 196 (76.0%) |
| 35 to 44 Years | 59 (28.2%) | 178 (85.2%) |
| 45 to 54 Years | 26 (11.1%) | 204 (86.8%) |
| 55 to 64 Years | 167 (59.9%) | 171 (61.3%) |
| 65 to 74 Years | 184 (89.3%) | 178 (86.4%) |
| 75 Years and over | 158 (100.0%) | 100 (63.3%) |
| Total | 1,090 (41.3%) | 1,949 (73.8%) |
Disability Status by Sex by Age in Munsons Corners
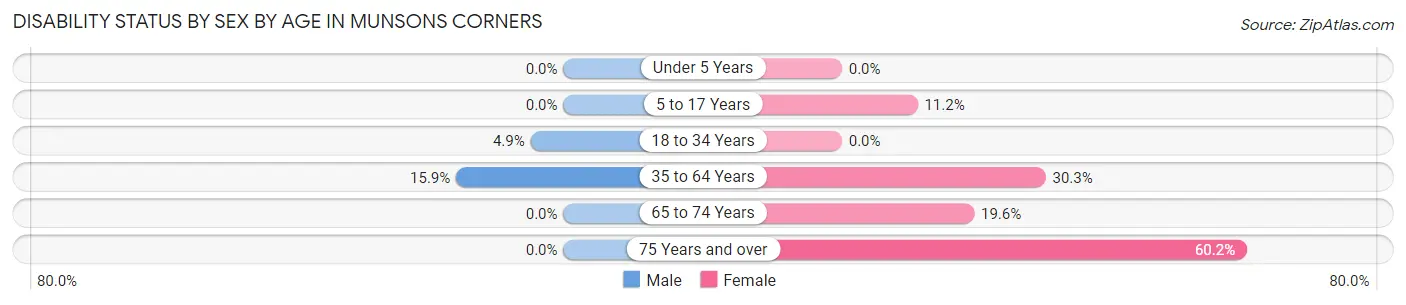
| Age Bracket | Male | Female |
| Under 5 Years | 0 (0.0%) | 0 (0.0%) |
| 5 to 17 Years | 0 (0.0%) | 19 (11.2%) |
| 18 to 34 Years | 19 (4.9%) | 0 (0.0%) |
| 35 to 64 Years | 53 (15.9%) | 118 (30.3%) |
| 65 to 74 Years | 0 (0.0%) | 33 (19.6%) |
| 75 Years and over | 0 (0.0%) | 77 (60.2%) |
Disability Class by Sex by Age in Munsons Corners
Disability Class: Hearing Difficulty
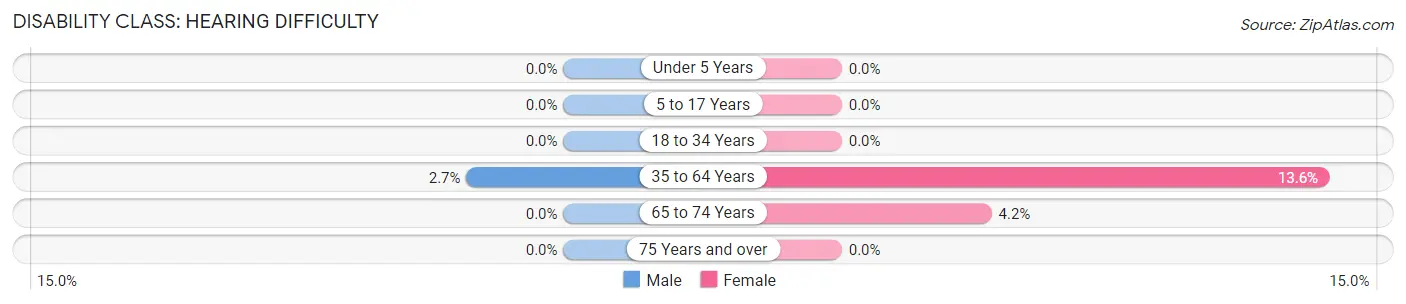
| Age Bracket | Male | Female |
| Under 5 Years | 0 (0.0%) | 0 (0.0%) |
| 5 to 17 Years | 0 (0.0%) | 0 (0.0%) |
| 18 to 34 Years | 0 (0.0%) | 0 (0.0%) |
| 35 to 64 Years | 9 (2.7%) | 53 (13.6%) |
| 65 to 74 Years | 0 (0.0%) | 7 (4.2%) |
| 75 Years and over | 0 (0.0%) | 0 (0.0%) |
Disability Class: Vision Difficulty
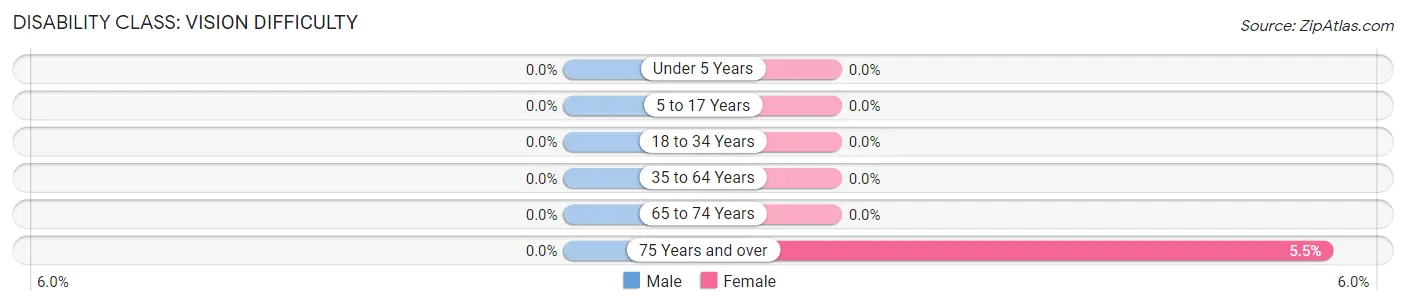
| Age Bracket | Male | Female |
| Under 5 Years | 0 (0.0%) | 0 (0.0%) |
| 5 to 17 Years | 0 (0.0%) | 0 (0.0%) |
| 18 to 34 Years | 0 (0.0%) | 0 (0.0%) |
| 35 to 64 Years | 0 (0.0%) | 0 (0.0%) |
| 65 to 74 Years | 0 (0.0%) | 0 (0.0%) |
| 75 Years and over | 0 (0.0%) | 7 (5.5%) |
Disability Class: Cognitive Difficulty
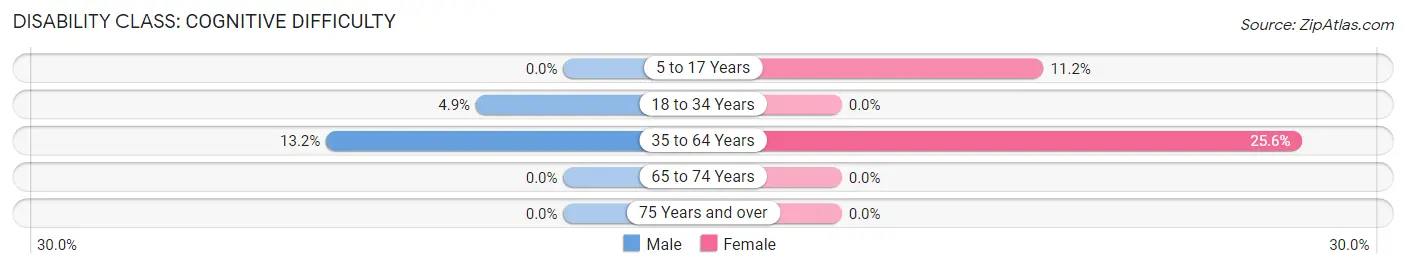
| Age Bracket | Male | Female |
| 5 to 17 Years | 0 (0.0%) | 19 (11.2%) |
| 18 to 34 Years | 19 (4.9%) | 0 (0.0%) |
| 35 to 64 Years | 44 (13.2%) | 100 (25.6%) |
| 65 to 74 Years | 0 (0.0%) | 0 (0.0%) |
| 75 Years and over | 0 (0.0%) | 0 (0.0%) |
Disability Class: Ambulatory Difficulty
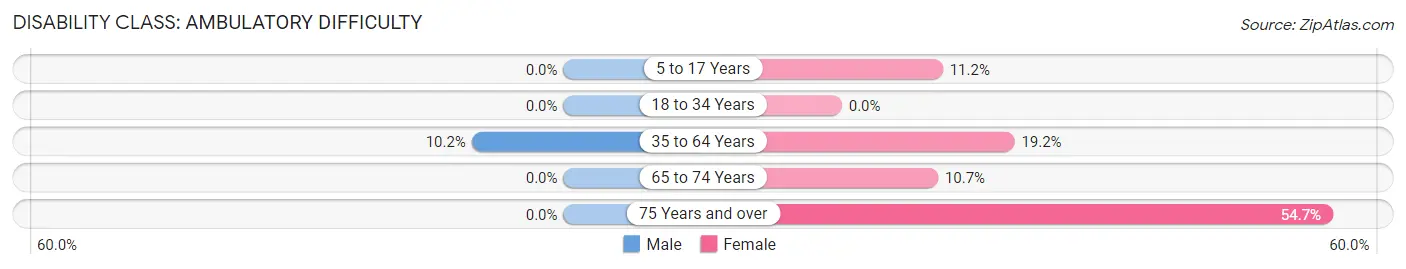
| Age Bracket | Male | Female |
| 5 to 17 Years | 0 (0.0%) | 19 (11.2%) |
| 18 to 34 Years | 0 (0.0%) | 0 (0.0%) |
| 35 to 64 Years | 34 (10.2%) | 75 (19.2%) |
| 65 to 74 Years | 0 (0.0%) | 18 (10.7%) |
| 75 Years and over | 0 (0.0%) | 70 (54.7%) |
Disability Class: Self-Care Difficulty
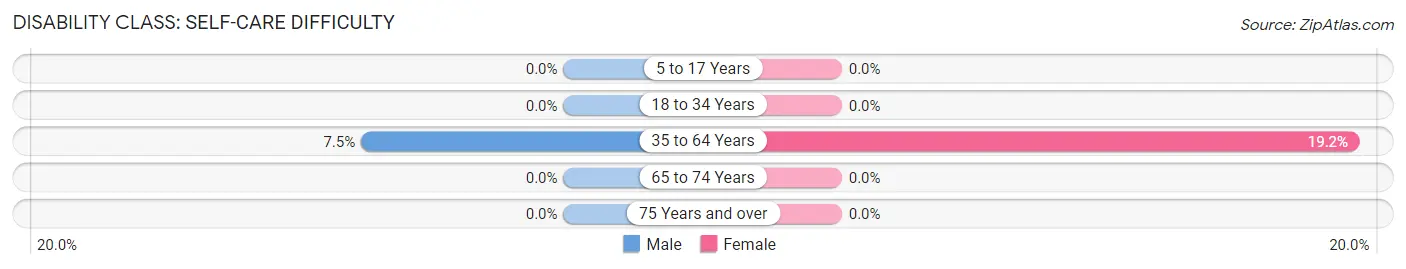
| Age Bracket | Male | Female |
| 5 to 17 Years | 0 (0.0%) | 0 (0.0%) |
| 18 to 34 Years | 0 (0.0%) | 0 (0.0%) |
| 35 to 64 Years | 25 (7.5%) | 75 (19.2%) |
| 65 to 74 Years | 0 (0.0%) | 0 (0.0%) |
| 75 Years and over | 0 (0.0%) | 0 (0.0%) |
Technology Access in Munsons Corners
Computing Device Access in Munsons Corners
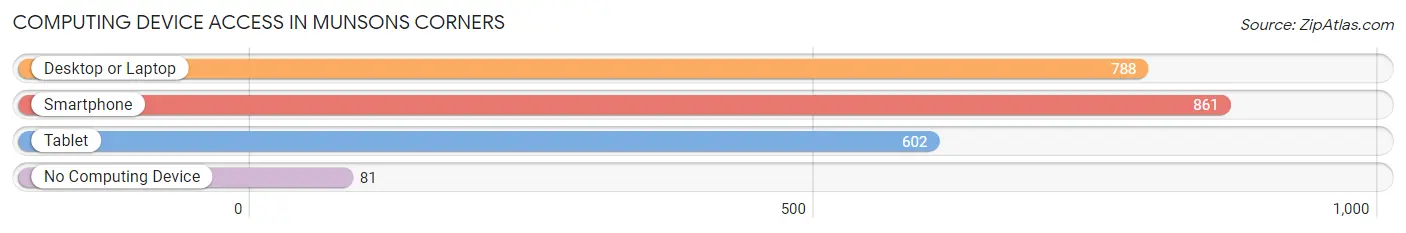
| Device Type | # Households | % Households |
| Desktop or Laptop | 788 | 80.1% |
| Smartphone | 861 | 87.5% |
| Tablet | 602 | 61.2% |
| No Computing Device | 81 | 8.2% |
| Total | 984 | 100.0% |
Internet Access in Munsons Corners
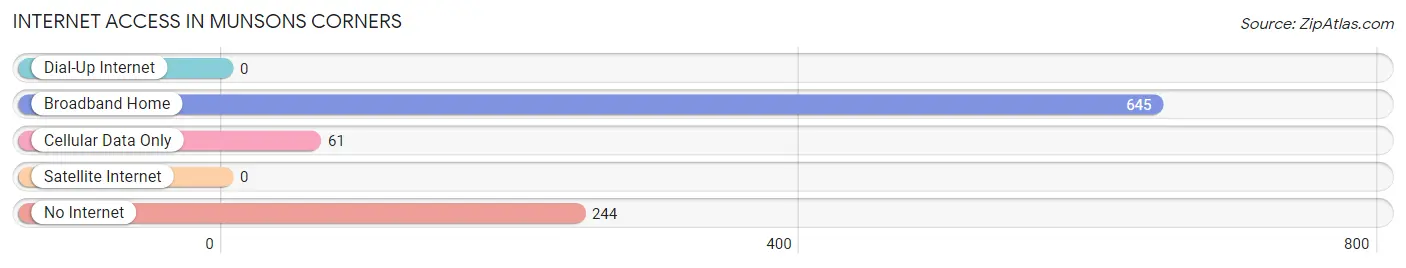
| Internet Type | # Households | % Households |
| Dial-Up Internet | 0 | 0.0% |
| Broadband Home | 645 | 65.5% |
| Cellular Data Only | 61 | 6.2% |
| Satellite Internet | 0 | 0.0% |
| No Internet | 244 | 24.8% |
| Total | 984 | 100.0% |
Munsons Corners Summary
Munsons Corners is a hamlet located in the town of Newburgh in Orange County, New York. It is situated on the east side of the Hudson River, about 60 miles north of New York City. The hamlet is named after the Munson family, who were among the first settlers in the area.
History
Munsons Corners was first settled in the late 1700s by the Munson family, who were among the first settlers in the area. The hamlet was originally known as Munson's Corners, but the name was eventually shortened to Munsons Corners. The hamlet was officially incorporated in 1845.
In the late 1800s, Munsons Corners was a thriving agricultural community. The hamlet was home to several farms, as well as a sawmill, a gristmill, and a blacksmith shop. The hamlet also had a post office, a school, and a general store.
In the early 1900s, the hamlet began to decline as the population shifted to larger cities. The post office closed in the 1920s, and the school closed in the 1940s. By the 1950s, the hamlet was mostly abandoned.
Geography
Munsons Corners is located in the town of Newburgh in Orange County, New York. It is situated on the east side of the Hudson River, about 60 miles north of New York City. The hamlet is bordered by the towns of New Windsor to the north, Cornwall to the east, and Marlboro to the south.
The hamlet is located in a rural area, with rolling hills and forests. The terrain is mostly flat, with some hills and valleys. The hamlet is located in the Hudson Valley region, which is known for its scenic beauty.
Economy
Munsons Corners is a small, rural hamlet with a limited economy. The hamlet is home to several small businesses, including a general store, a gas station, and a few restaurants. The hamlet also has a few small farms, which produce a variety of crops.
The hamlet is also home to several small manufacturing companies, which produce a variety of products, including furniture, clothing, and electronics. The hamlet is also home to a few small service businesses, such as auto repair shops and landscaping companies.
Demographics
As of the 2010 census, the population of Munsons Corners was 1,845. The population is mostly white (94.3%), with a small percentage of African Americans (2.2%) and Hispanics (2.5%). The median household income is $50,000, and the median home value is $200,000.
The hamlet is home to a variety of religious denominations, including Catholic, Protestant, and Jewish. The hamlet is also home to a variety of cultural and recreational activities, including festivals, concerts, and sporting events.
Conclusion
Munsons Corners is a small, rural hamlet located in the town of Newburgh in Orange County, New York. The hamlet was first settled in the late 1700s by the Munson family, and was officially incorporated in 1845. The hamlet is home to a variety of small businesses, as well as a few small farms and manufacturing companies. The population of Munsons Corners is mostly white, with a small percentage of African Americans and Hispanics. The hamlet is home to a variety of religious denominations, as well as a variety of cultural and recreational activities.
Common Questions
What is Per Capita Income in Munsons Corners?
Per Capita income in Munsons Corners is $26,148.
What is the Median Family Income in Munsons Corners?
Median Family Income in Munsons Corners is $79,665.
What is the Median Household income in Munsons Corners?
Median Household Income in Munsons Corners is $64,167.
What is Inequality or Gini Index in Munsons Corners?
Inequality or Gini Index in Munsons Corners is 0.45.
What is the Total Population of Munsons Corners?
Total Population of Munsons Corners is 2,680.
What is the Total Male Population of Munsons Corners?
Total Male Population of Munsons Corners is 1,091.
What is the Total Female Population of Munsons Corners?
Total Female Population of Munsons Corners is 1,589.
What is the Ratio of Males per 100 Females in Munsons Corners?
There are 68.66 Males per 100 Females in Munsons Corners.
What is the Ratio of Females per 100 Males in Munsons Corners?
There are 145.65 Females per 100 Males in Munsons Corners.
What is the Median Population Age in Munsons Corners?
Median Population Age in Munsons Corners is 27.1 Years.
What is the Average Family Size in Munsons Corners
Average Family Size in Munsons Corners is 3.0 People.
What is the Average Household Size in Munsons Corners
Average Household Size in Munsons Corners is 2.3 People.
How Large is the Labor Force in Munsons Corners?
There are 1,188 People in the Labor Forcein in Munsons Corners.
What is the Percentage of People in the Labor Force in Munsons Corners?
51.4% of People are in the Labor Force in Munsons Corners.
What is the Unemployment Rate in Munsons Corners?
Unemployment Rate in Munsons Corners is 2.6%.