Cities with the Highest Percentage of French Population in New York
RELATED REPORTS & OPTIONS
French
New York
Compare Cities
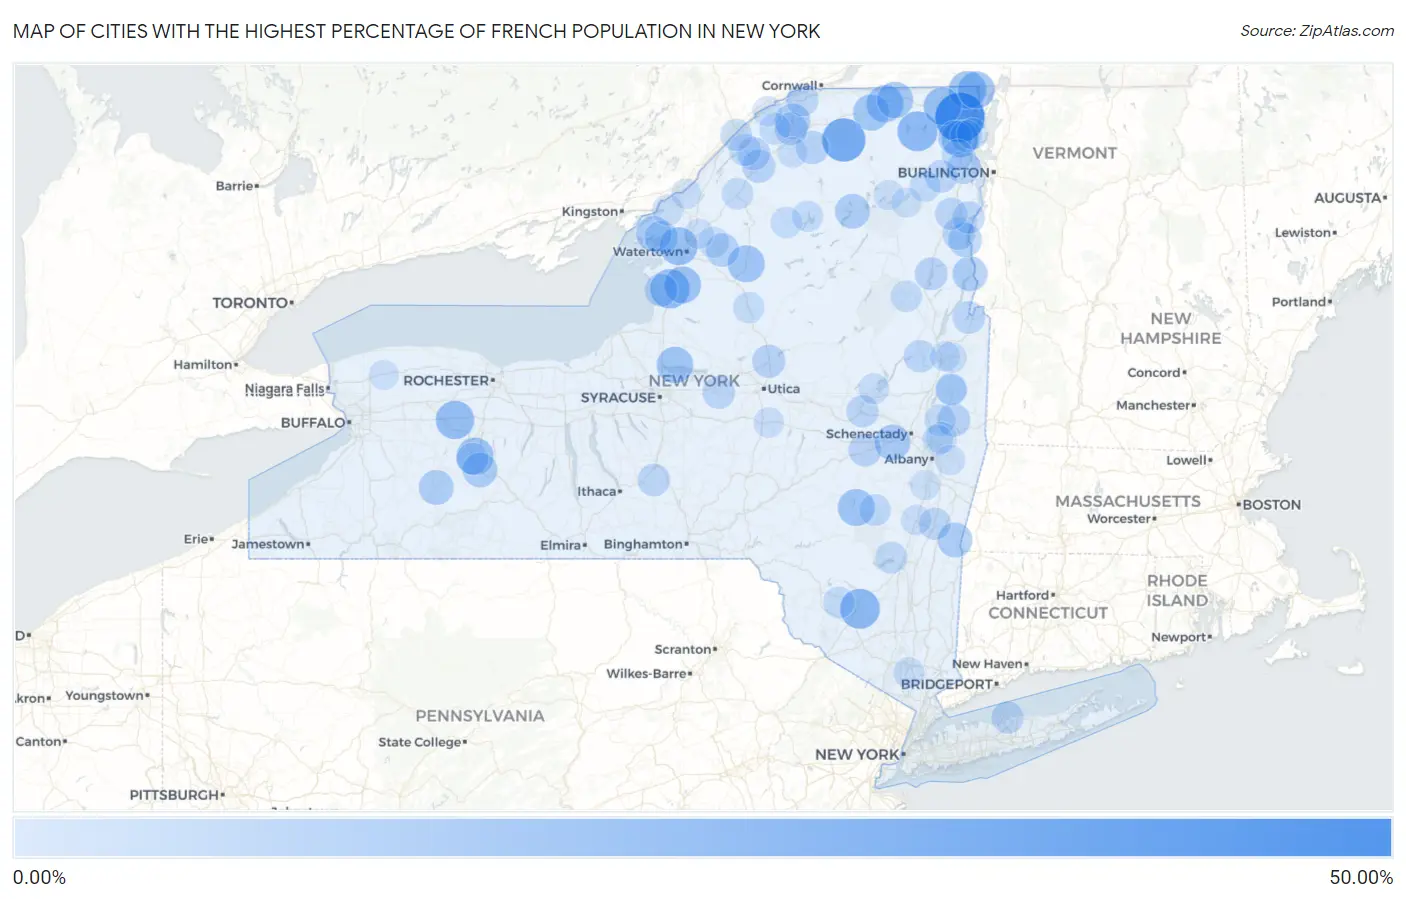
Map of Cities with the Highest Percentage of French Population in New York
0.00%
50.00%
Cities with the Highest Percentage of French Population in New York
| City | French | vs State | vs National | |
| 1. | West Chazy | 49.90% | 1.73%(+48.2)#1 | 2.07%(+47.8)#22 |
| 2. | St Regis Falls | 36.27% | 1.73%(+34.5)#2 | 2.07%(+34.2)#60 |
| 3. | Lyon Mountain | 28.80% | 1.73%(+27.1)#3 | 2.07%(+26.7)#119 |
| 4. | Cragsmoor | 28.60% | 1.73%(+26.9)#4 | 2.07%(+26.5)#121 |
| 5. | Pierrepont Manor | 27.37% | 1.73%(+25.6)#5 | 2.07%(+25.3)#143 |
| 6. | Linwood | 25.81% | 1.73%(+24.1)#6 | 2.07%(+23.7)#169 |
| 7. | Brownville | 24.57% | 1.73%(+22.8)#7 | 2.07%(+22.5)#186 |
| 8. | Champlain | 24.30% | 1.73%(+22.6)#8 | 2.07%(+22.2)#189 |
| 9. | Altona | 24.20% | 1.73%(+22.5)#9 | 2.07%(+22.1)#195 |
| 10. | North Granville | 23.80% | 1.73%(+22.1)#10 | 2.07%(+21.7)#207 |
| 11. | Groveland Station | 23.24% | 1.73%(+21.5)#11 | 2.07%(+21.2)#222 |
| 12. | Rouses Point | 22.96% | 1.73%(+21.2)#12 | 2.07%(+20.9)#229 |
| 13. | Lorraine | 22.81% | 1.73%(+21.1)#13 | 2.07%(+20.7)#237 |
| 14. | Plattsburgh West | 22.72% | 1.73%(+21.0)#14 | 2.07%(+20.7)#242 |
| 15. | Burke | 22.61% | 1.73%(+20.9)#15 | 2.07%(+20.5)#244 |
| 16. | Prattsville | 22.45% | 1.73%(+20.7)#16 | 2.07%(+20.4)#247 |
| 17. | Croghan | 22.39% | 1.73%(+20.7)#17 | 2.07%(+20.3)#250 |
| 18. | Constantia | 21.62% | 1.73%(+19.9)#18 | 2.07%(+19.6)#267 |
| 19. | Malone | 21.14% | 1.73%(+19.4)#19 | 2.07%(+19.1)#284 |
| 20. | Chateaugay | 21.13% | 1.73%(+19.4)#20 | 2.07%(+19.1)#285 |
| 21. | Marcy | 21.11% | 1.73%(+19.4)#21 | 2.07%(+19.0)#286 |
| 22. | Nassau Lake | 20.48% | 1.73%(+18.7)#22 | 2.07%(+18.4)#312 |
| 23. | Duane Lake | 19.82% | 1.73%(+18.1)#23 | 2.07%(+17.7)#334 |
| 24. | Norfolk | 19.33% | 1.73%(+17.6)#24 | 2.07%(+17.3)#349 |
| 25. | Three Mile Bay | 19.05% | 1.73%(+17.3)#25 | 2.07%(+17.0)#358 |
| 26. | Ticonderoga | 18.21% | 1.73%(+16.5)#26 | 2.07%(+16.1)#395 |
| 27. | Fillmore | 18.10% | 1.73%(+16.4)#27 | 2.07%(+16.0)#404 |
| 28. | Tupper Lake | 17.94% | 1.73%(+16.2)#28 | 2.07%(+15.9)#412 |
| 29. | Woodsville | 17.91% | 1.73%(+16.2)#29 | 2.07%(+15.8)#413 |
| 30. | Taconic Shores | 17.79% | 1.73%(+16.1)#30 | 2.07%(+15.7)#417 |
| 31. | East Frankfort | 17.43% | 1.73%(+15.7)#31 | 2.07%(+15.4)#436 |
| 32. | Fort Covington | 16.47% | 1.73%(+14.7)#32 | 2.07%(+14.4)#495 |
| 33. | Morrisonville | 16.35% | 1.73%(+14.6)#33 | 2.07%(+14.3)#505 |
| 34. | Port Henry | 16.10% | 1.73%(+14.4)#34 | 2.07%(+14.0)#521 |
| 35. | Chaumont | 15.60% | 1.73%(+13.9)#35 | 2.07%(+13.5)#556 |
| 36. | Carthage | 15.06% | 1.73%(+13.3)#36 | 2.07%(+13.0)#597 |
| 37. | Valley Falls | 14.97% | 1.73%(+13.2)#37 | 2.07%(+12.9)#602 |
| 38. | Parishville | 14.84% | 1.73%(+13.1)#38 | 2.07%(+12.8)#613 |
| 39. | Barneveld | 14.66% | 1.73%(+12.9)#39 | 2.07%(+12.6)#623 |
| 40. | Dekalb Junction | 14.57% | 1.73%(+12.8)#40 | 2.07%(+12.5)#628 |
| 41. | Ellisburg | 14.36% | 1.73%(+12.6)#41 | 2.07%(+12.3)#650 |
| 42. | Rensselaer Falls | 14.14% | 1.73%(+12.4)#42 | 2.07%(+12.1)#664 |
| 43. | Norwood | 14.12% | 1.73%(+12.4)#43 | 2.07%(+12.1)#666 |
| 44. | Central Bridge | 14.08% | 1.73%(+12.4)#44 | 2.07%(+12.0)#667 |
| 45. | Keeseville | 14.07% | 1.73%(+12.3)#45 | 2.07%(+12.0)#669 |
| 46. | Schroon Lake | 13.93% | 1.73%(+12.2)#46 | 2.07%(+11.9)#682 |
| 47. | Whitehall | 13.48% | 1.73%(+11.8)#47 | 2.07%(+11.4)#718 |
| 48. | Oneida Castle | 13.45% | 1.73%(+11.7)#48 | 2.07%(+11.4)#719 |
| 49. | Virgil | 13.36% | 1.73%(+11.6)#49 | 2.07%(+11.3)#728 |
| 50. | Mineville | 13.24% | 1.73%(+11.5)#50 | 2.07%(+11.2)#740 |
| 51. | Au Sable Forks | 13.22% | 1.73%(+11.5)#51 | 2.07%(+11.2)#742 |
| 52. | Hadley | 13.15% | 1.73%(+11.4)#52 | 2.07%(+11.1)#746 |
| 53. | Westport | 13.15% | 1.73%(+11.4)#53 | 2.07%(+11.1)#749 |
| 54. | Cadyville | 13.11% | 1.73%(+11.4)#54 | 2.07%(+11.0)#752 |
| 55. | Fonda | 12.93% | 1.73%(+11.2)#55 | 2.07%(+10.9)#766 |
| 56. | Poquott | 12.83% | 1.73%(+11.1)#56 | 2.07%(+10.8)#779 |
| 57. | Elizabethtown | 12.66% | 1.73%(+10.9)#57 | 2.07%(+10.6)#799 |
| 58. | Massena | 12.46% | 1.73%(+10.7)#58 | 2.07%(+10.4)#831 |
| 59. | Plattsburgh | 12.43% | 1.73%(+10.7)#59 | 2.07%(+10.4)#832 |
| 60. | Claverack Red Mills | 12.38% | 1.73%(+10.6)#60 | 2.07%(+10.3)#836 |
| 61. | Heuvelton | 12.07% | 1.73%(+10.3)#61 | 2.07%(+10.0)#872 |
| 62. | West Hurley | 12.00% | 1.73%(+10.3)#62 | 2.07%(+9.94)#878 |
| 63. | Kysorville | 11.86% | 1.73%(+10.1)#63 | 2.07%(+9.80)#893 |
| 64. | Ogdensburg | 11.84% | 1.73%(+10.1)#64 | 2.07%(+9.77)#895 |
| 65. | Windham | 11.55% | 1.73%(+9.82)#65 | 2.07%(+9.48)#929 |
| 66. | Woodridge | 11.54% | 1.73%(+9.81)#66 | 2.07%(+9.47)#930 |
| 67. | Gouverneur | 11.46% | 1.73%(+9.73)#67 | 2.07%(+9.40)#945 |
| 68. | Madrid | 11.31% | 1.73%(+9.58)#68 | 2.07%(+9.25)#958 |
| 69. | Peru | 11.01% | 1.73%(+9.28)#69 | 2.07%(+8.95)#997 |
| 70. | North Creek | 10.99% | 1.73%(+9.26)#70 | 2.07%(+8.92)#1,001 |
| 71. | Cumberland Head | 10.98% | 1.73%(+9.25)#71 | 2.07%(+8.91)#1,002 |
| 72. | Schuylerville | 10.98% | 1.73%(+9.25)#72 | 2.07%(+8.91)#1,004 |
| 73. | Mechanicville | 10.93% | 1.73%(+9.20)#73 | 2.07%(+8.87)#1,013 |
| 74. | Wilmington | 10.85% | 1.73%(+9.12)#74 | 2.07%(+8.78)#1,028 |
| 75. | Star Lake | 10.79% | 1.73%(+9.06)#75 | 2.07%(+8.72)#1,033 |
| 76. | Lyons Falls | 10.78% | 1.73%(+9.05)#76 | 2.07%(+8.72)#1,034 |
| 77. | Waterford | 10.74% | 1.73%(+9.01)#77 | 2.07%(+8.68)#1,041 |
| 78. | Springfield Center | 10.67% | 1.73%(+8.94)#78 | 2.07%(+8.60)#1,054 |
| 79. | Victory | 10.66% | 1.73%(+8.93)#79 | 2.07%(+8.60)#1,056 |
| 80. | Cranberry Lake | 10.48% | 1.73%(+8.75)#80 | 2.07%(+8.42)#1,093 |
| 81. | Deferiet | 10.27% | 1.73%(+8.54)#81 | 2.07%(+8.21)#1,122 |
| 82. | Hurleyville | 10.14% | 1.73%(+8.41)#82 | 2.07%(+8.07)#1,149 |
| 83. | Clayton | 10.07% | 1.73%(+8.34)#83 | 2.07%(+8.00)#1,160 |
| 84. | Verplanck | 9.80% | 1.73%(+8.07)#84 | 2.07%(+7.73)#1,201 |
| 85. | Mayfield | 9.70% | 1.73%(+7.97)#85 | 2.07%(+7.64)#1,214 |
| 86. | Hudson Falls | 9.57% | 1.73%(+7.84)#86 | 2.07%(+7.51)#1,235 |
| 87. | Cohoes | 9.49% | 1.73%(+7.76)#87 | 2.07%(+7.43)#1,257 |
| 88. | Hannawa Falls | 9.42% | 1.73%(+7.69)#88 | 2.07%(+7.35)#1,276 |
| 89. | Leeds | 9.39% | 1.73%(+7.66)#89 | 2.07%(+7.32)#1,280 |
| 90. | West Winfield | 9.13% | 1.73%(+7.40)#90 | 2.07%(+7.07)#1,341 |
| 91. | Saranac Lake | 9.04% | 1.73%(+7.31)#91 | 2.07%(+6.97)#1,369 |
| 92. | West Sand Lake | 8.87% | 1.73%(+7.14)#92 | 2.07%(+6.80)#1,403 |
| 93. | Alexandria Bay | 8.84% | 1.73%(+7.11)#93 | 2.07%(+6.78)#1,410 |
| 94. | Milton Cdp Saratoga County | 8.80% | 1.73%(+7.07)#94 | 2.07%(+6.74)#1,421 |
| 95. | Evans Mills | 8.75% | 1.73%(+7.02)#95 | 2.07%(+6.68)#1,431 |
| 96. | Ravena | 8.71% | 1.73%(+6.98)#96 | 2.07%(+6.65)#1,439 |
| 97. | Lake Placid | 8.60% | 1.73%(+6.87)#97 | 2.07%(+6.53)#1,458 |
| 98. | Waddington | 8.58% | 1.73%(+6.85)#98 | 2.07%(+6.52)#1,462 |
| 99. | Glens Falls | 8.51% | 1.73%(+6.78)#99 | 2.07%(+6.44)#1,485 |
| 100. | Gasport | 8.43% | 1.73%(+6.70)#100 | 2.07%(+6.36)#1,504 |
Common Questions
What are the Top 10 Cities with the Highest Percentage of French Population in New York?
Top 10 Cities with the Highest Percentage of French Population in New York are:
#1
49.90%
#2
36.27%
#3
28.80%
#4
28.60%
#5
27.37%
#6
25.81%
#7
24.57%
#8
24.30%
#9
24.20%
#10
23.24%
What city has the Highest Percentage of French Population in New York?
West Chazy has the Highest Percentage of French Population in New York with 49.90%.
What is the Percentage of French Population in the State of New York?
Percentage of French Population in New York is 1.73%.
What is the Percentage of French Population in the United States?
Percentage of French Population in the United States is 2.07%.