Cooperstown, NY Map & Demographics
Cooperstown Map
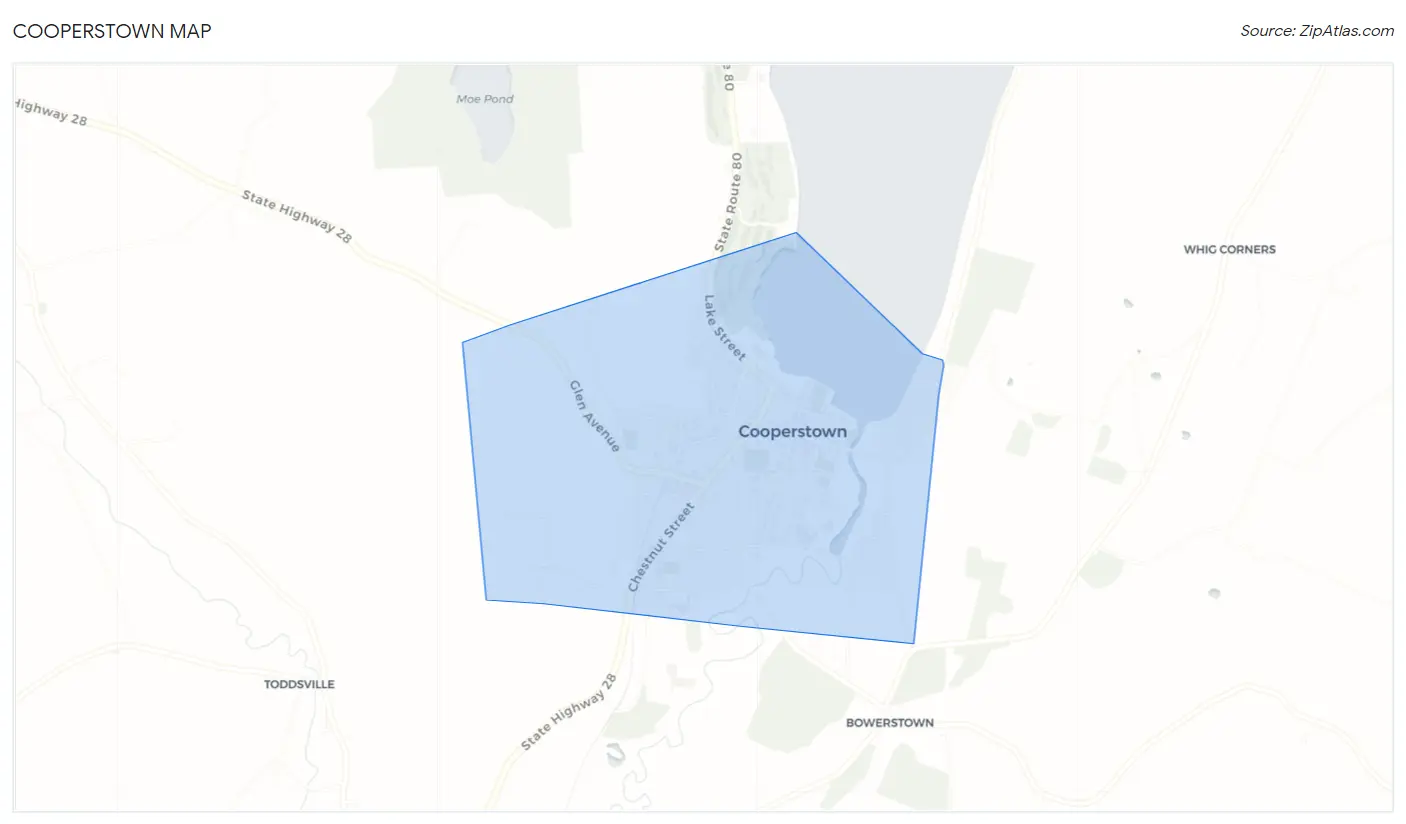
Cooperstown Overview
$56,348
PER CAPITA INCOME
$109,688
AVG FAMILY INCOME
$80,139
AVG HOUSEHOLD INCOME
12.0%
WAGE / INCOME GAP [ % ]
88.0¢/ $1
WAGE / INCOME GAP [ $ ]
0.53
INEQUALITY / GINI INDEX
2,034
TOTAL POPULATION
1,016
MALE POPULATION
1,018
FEMALE POPULATION
99.80
MALES / 100 FEMALES
100.20
FEMALES / 100 MALES
50.7
MEDIAN AGE
3.0
AVG FAMILY SIZE
2.2
AVG HOUSEHOLD SIZE
1,017
LABOR FORCE [ PEOPLE ]
54.7%
PERCENT IN LABOR FORCE
5.5%
UNEMPLOYMENT RATE
Cooperstown Zip Codes
Cooperstown Area Codes
Income in Cooperstown
Income Overview in Cooperstown
Per Capita Income in Cooperstown is $56,348, while median incomes of families and households are $109,688 and $80,139 respectively.
| Characteristic | Number | Measure |
| Per Capita Income | 2,034 | $56,348 |
| Median Family Income | 427 | $109,688 |
| Mean Family Income | 427 | $189,677 |
| Median Household Income | 851 | $80,139 |
| Mean Household Income | 851 | $132,761 |
| Income Deficit | 427 | $0 |
| Wage / Income Gap (%) | 2,034 | 11.97% |
| Wage / Income Gap ($) | 2,034 | 88.03¢ per $1 |
| Gini / Inequality Index | 2,034 | 0.53 |
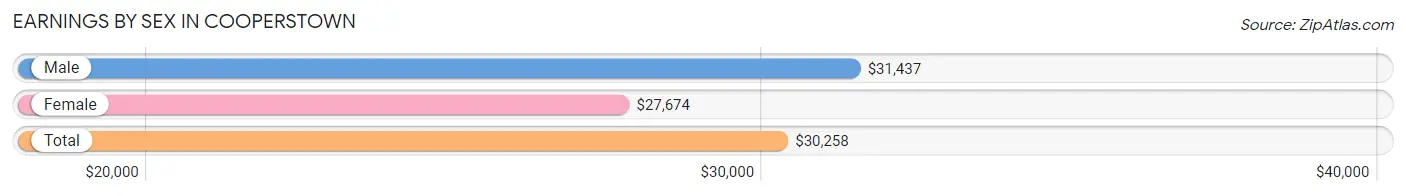
Earnings by Sex in Cooperstown
Average Earnings in Cooperstown are $30,258, $31,437 for men and $27,674 for women, a difference of 12.0%.
| Sex | Number | Average Earnings |
| Male | 598 (48.3%) | $31,437 |
| Female | 640 (51.7%) | $27,674 |
| Total | 1,238 (100.0%) | $30,258 |
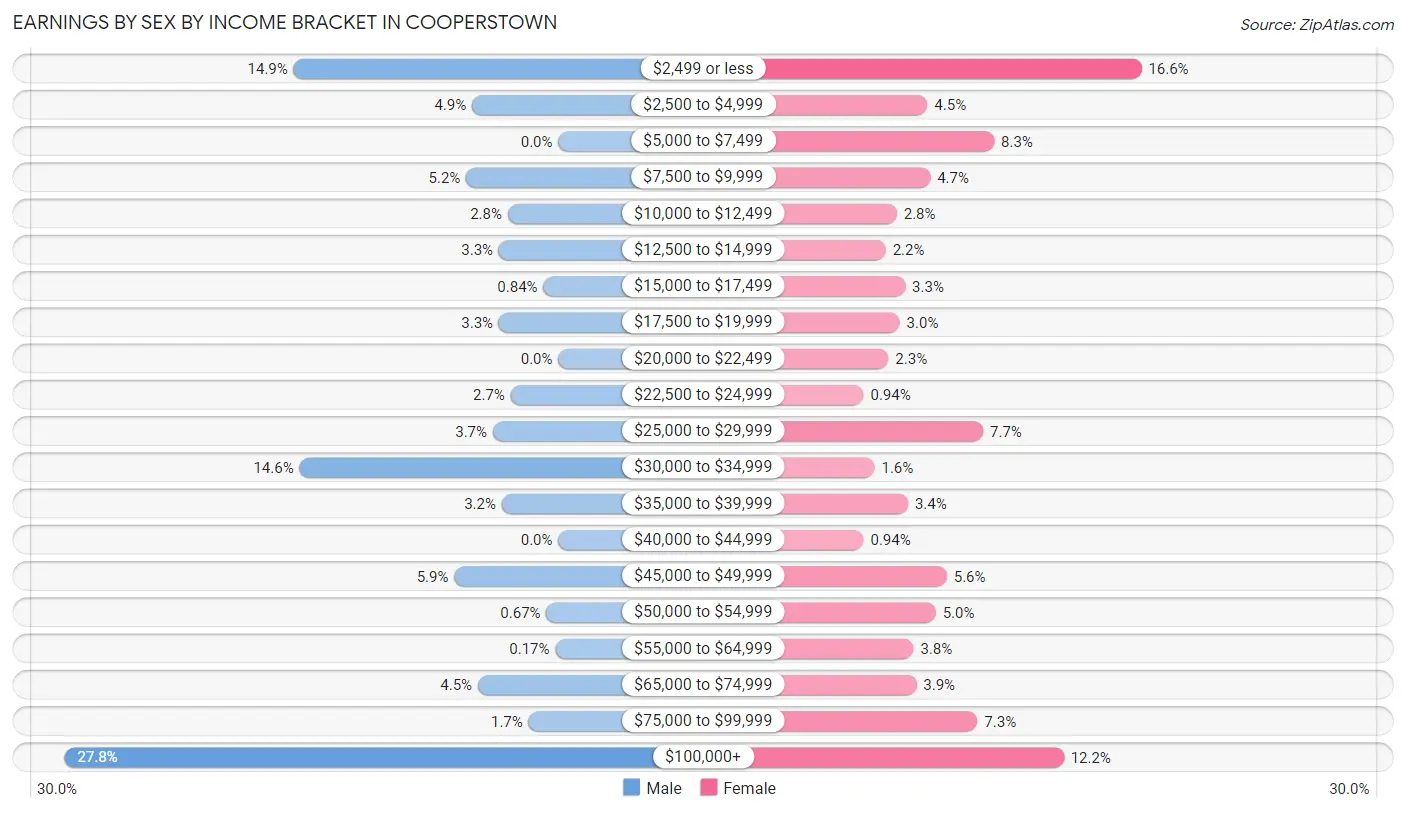
Earnings by Sex by Income Bracket in Cooperstown
The most common earnings brackets in Cooperstown are $100,000+ for men (166 | 27.8%) and $2,499 or less for women (106 | 16.6%).
| Income | Male | Female |
| $2,499 or less | 89 (14.9%) | 106 (16.6%) |
| $2,500 to $4,999 | 29 (4.9%) | 29 (4.5%) |
| $5,000 to $7,499 | 0 (0.0%) | 53 (8.3%) |
| $7,500 to $9,999 | 31 (5.2%) | 30 (4.7%) |
| $10,000 to $12,499 | 17 (2.8%) | 18 (2.8%) |
| $12,500 to $14,999 | 20 (3.3%) | 14 (2.2%) |
| $15,000 to $17,499 | 5 (0.8%) | 21 (3.3%) |
| $17,500 to $19,999 | 20 (3.3%) | 19 (3.0%) |
| $20,000 to $22,499 | 0 (0.0%) | 15 (2.3%) |
| $22,500 to $24,999 | 16 (2.7%) | 6 (0.9%) |
| $25,000 to $29,999 | 22 (3.7%) | 49 (7.7%) |
| $30,000 to $34,999 | 87 (14.5%) | 10 (1.6%) |
| $35,000 to $39,999 | 19 (3.2%) | 22 (3.4%) |
| $40,000 to $44,999 | 0 (0.0%) | 6 (0.9%) |
| $45,000 to $49,999 | 35 (5.9%) | 36 (5.6%) |
| $50,000 to $54,999 | 4 (0.7%) | 32 (5.0%) |
| $55,000 to $64,999 | 1 (0.2%) | 24 (3.7%) |
| $65,000 to $74,999 | 27 (4.5%) | 25 (3.9%) |
| $75,000 to $99,999 | 10 (1.7%) | 47 (7.3%) |
| $100,000+ | 166 (27.8%) | 78 (12.2%) |
| Total | 598 (100.0%) | 640 (100.0%) |
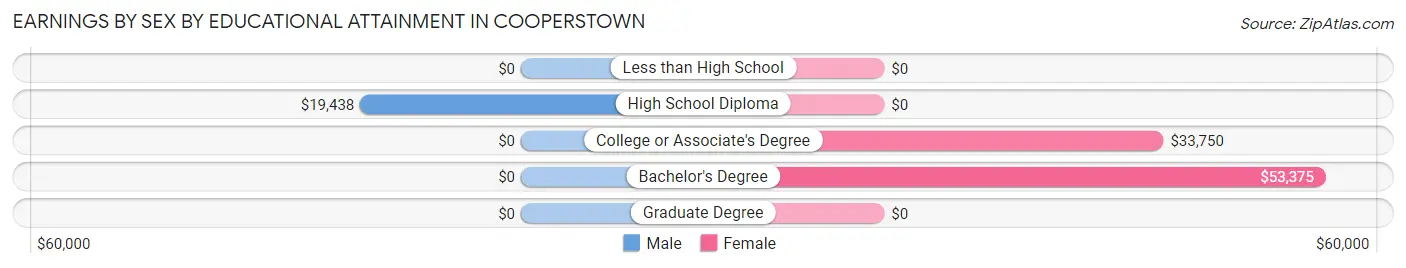
Earnings by Sex by Educational Attainment in Cooperstown
Average earnings in Cooperstown are $46,042 for men and $39,688 for women, a difference of 13.8%. Men with an educational attainment of high school diploma enjoy the highest average annual earnings of $19,438, while those with high school diploma education earn the least with $19,438. Women with an educational attainment of bachelor's degree earn the most with the average annual earnings of $53,375, while those with college or associate's degree education have the smallest earnings of $33,750.
| Educational Attainment | Male Income | Female Income |
| Less than High School | - | - |
| High School Diploma | $19,438 | $0 |
| College or Associate's Degree | - | - |
| Bachelor's Degree | - | - |
| Graduate Degree | - | - |
| Total | $46,042 | $39,688 |
Family Income in Cooperstown
Family Income Brackets in Cooperstown
According to the Cooperstown family income data, there are 148 families falling into the $200,000+ income range, which is the most common income bracket and makes up 34.7% of all families.
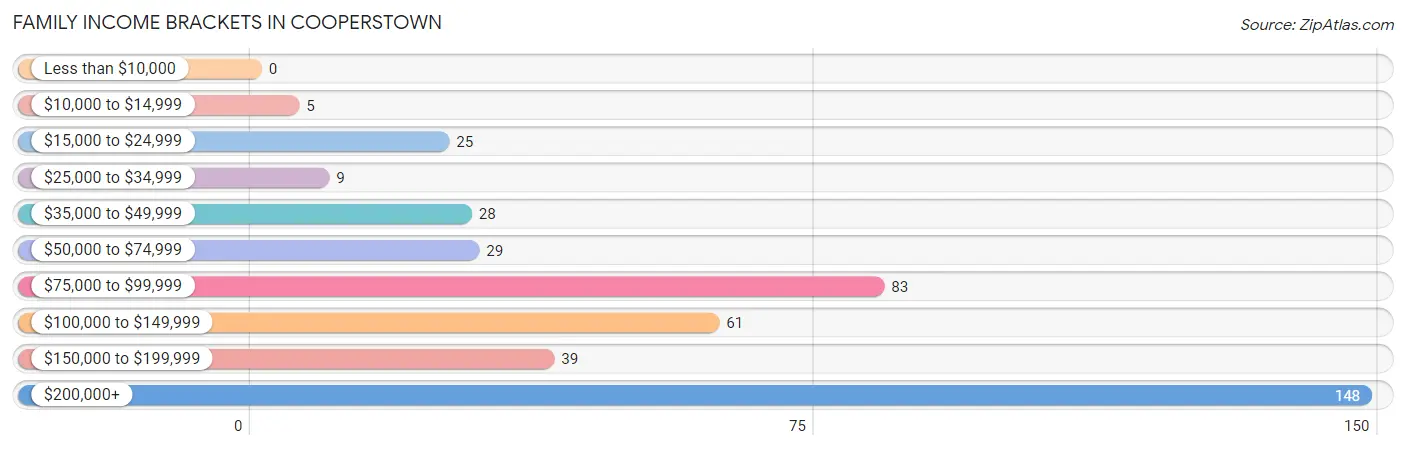
| Income Bracket | # Families | % Families |
| Less than $10,000 | 0 | 0.0% |
| $10,000 to $14,999 | 5 | 1.2% |
| $15,000 to $24,999 | 25 | 5.9% |
| $25,000 to $34,999 | 9 | 2.1% |
| $35,000 to $49,999 | 28 | 6.6% |
| $50,000 to $74,999 | 29 | 6.8% |
| $75,000 to $99,999 | 83 | 19.4% |
| $100,000 to $149,999 | 61 | 14.3% |
| $150,000 to $199,999 | 39 | 9.1% |
| $200,000+ | 148 | 34.7% |
Family Income by Famaliy Size in Cooperstown
3-person families (103 | 24.1%) account for the highest median family income in Cooperstown with $250,001 per family, while 3-person families (103 | 24.1%) have the highest median income of $83,334 per family member.
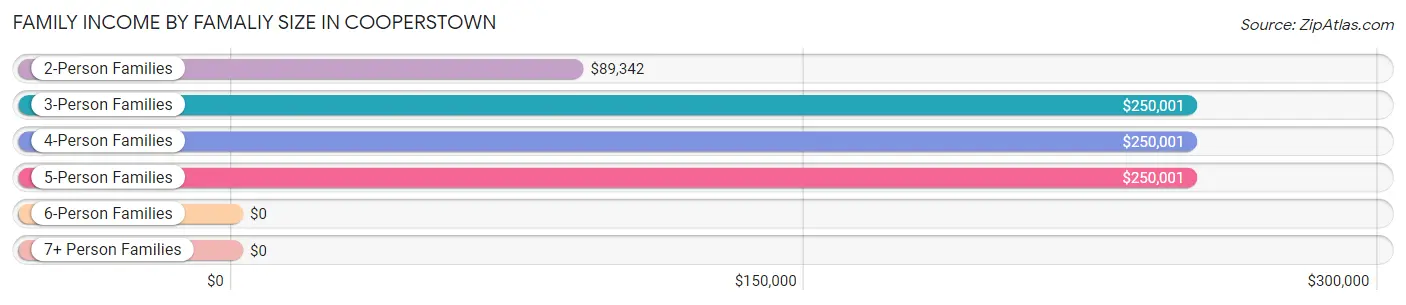
| Income Bracket | # Families | Median Income |
| 2-Person Families | 244 (57.1%) | $89,342 |
| 3-Person Families | 103 (24.1%) | $250,001 |
| 4-Person Families | 49 (11.5%) | $250,001 |
| 5-Person Families | 17 (4.0%) | $250,001 |
| 6-Person Families | 14 (3.3%) | $0 |
| 7+ Person Families | 0 (0.0%) | $0 |
| Total | 427 (100.0%) | $109,688 |
Family Income by Number of Earners in Cooperstown
The median family income in Cooperstown is $109,688, with families comprising 3+ earners (89) having the highest median family income of $250,001, while families with 1 earner (126) have the lowest median family income of $83,750, accounting for 20.8% and 29.5% of families, respectively.
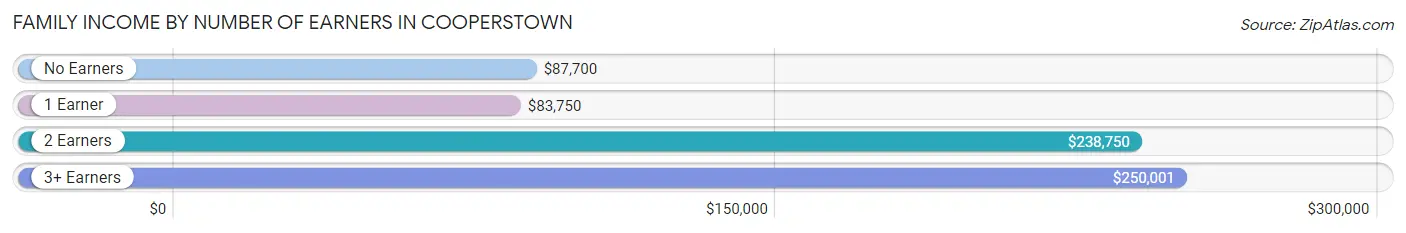
| Number of Earners | # Families | Median Income |
| No Earners | 64 (15.0%) | $87,700 |
| 1 Earner | 126 (29.5%) | $83,750 |
| 2 Earners | 148 (34.7%) | $238,750 |
| 3+ Earners | 89 (20.8%) | $250,001 |
| Total | 427 (100.0%) | $109,688 |
Household Income in Cooperstown
Household Income Brackets in Cooperstown
With 175 households falling in the category, the $200,000+ income range is the most frequent in Cooperstown, accounting for 20.6% of all households. In contrast, only 12 households (1.4%) fall into the $10,000 to $14,999 income bracket, making it the least populous group.
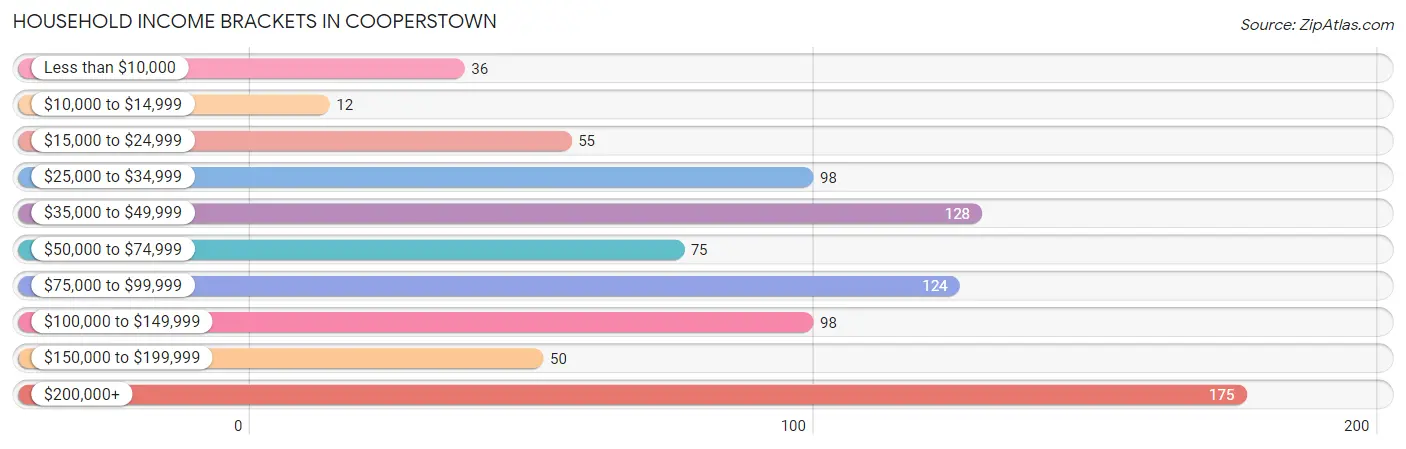
| Income Bracket | # Households | % Households |
| Less than $10,000 | 36 | 4.2% |
| $10,000 to $14,999 | 12 | 1.4% |
| $15,000 to $24,999 | 55 | 6.5% |
| $25,000 to $34,999 | 98 | 11.5% |
| $35,000 to $49,999 | 128 | 15.0% |
| $50,000 to $74,999 | 75 | 8.8% |
| $75,000 to $99,999 | 124 | 14.6% |
| $100,000 to $149,999 | 98 | 11.5% |
| $150,000 to $199,999 | 50 | 5.9% |
| $200,000+ | 175 | 20.6% |
Household Income by Householder Age in Cooperstown
The median household income in Cooperstown is $80,139, with the highest median household income of $110,729 found in the 25 to 44 years age bracket for the primary householder. A total of 179 households (21.0%) fall into this category. Meanwhile, the 15 to 24 years age bracket for the primary householder has the lowest median household income of $44,792, with 25 households (2.9%) in this group.
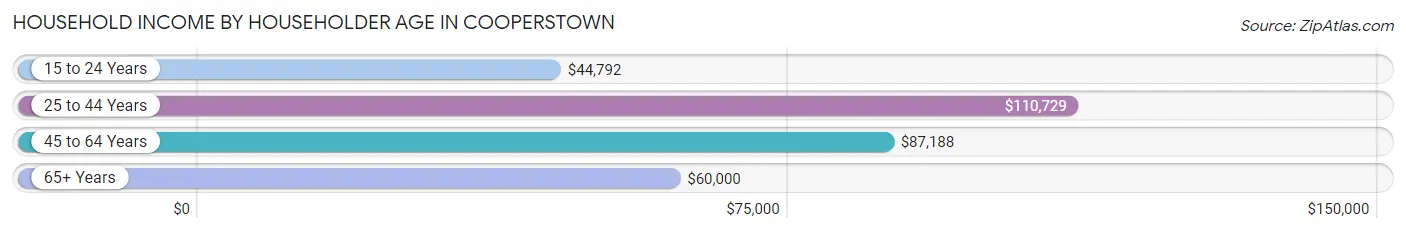
| Income Bracket | # Households | Median Income |
| 15 to 24 Years | 25 (2.9%) | $44,792 |
| 25 to 44 Years | 179 (21.0%) | $110,729 |
| 45 to 64 Years | 193 (22.7%) | $87,188 |
| 65+ Years | 454 (53.3%) | $60,000 |
| Total | 851 (100.0%) | $80,139 |
Poverty in Cooperstown
Income Below Poverty by Sex and Age in Cooperstown
With 13.5% poverty level for males and 4.0% for females among the residents of Cooperstown, 75 year old and over males and 18 to 24 year old females are the most vulnerable to poverty, with 59 males (36.4%) and 20 females (11.8%) in their respective age groups living below the poverty level.
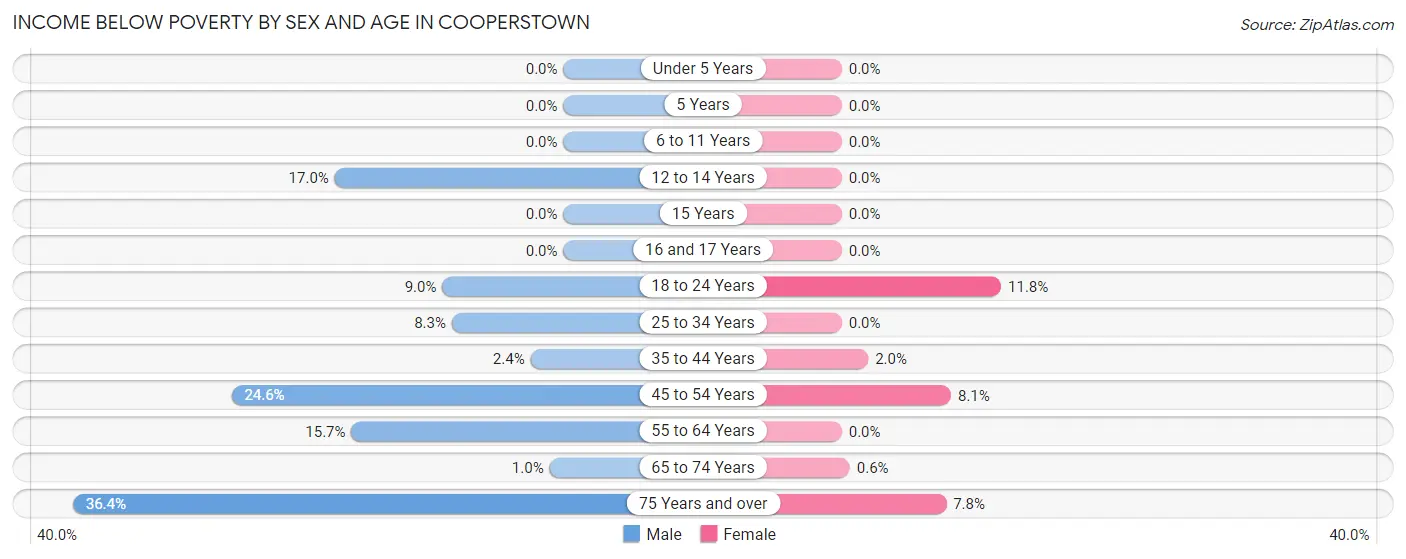
| Age Bracket | Male | Female |
| Under 5 Years | 0 (0.0%) | 0 (0.0%) |
| 5 Years | 0 (0.0%) | 0 (0.0%) |
| 6 to 11 Years | 0 (0.0%) | 0 (0.0%) |
| 12 to 14 Years | 9 (17.0%) | 0 (0.0%) |
| 15 Years | 0 (0.0%) | 0 (0.0%) |
| 16 and 17 Years | 0 (0.0%) | 0 (0.0%) |
| 18 to 24 Years | 8 (9.0%) | 20 (11.8%) |
| 25 to 34 Years | 13 (8.3%) | 0 (0.0%) |
| 35 to 44 Years | 1 (2.4%) | 1 (2.0%) |
| 45 to 54 Years | 17 (24.6%) | 6 (8.1%) |
| 55 to 64 Years | 17 (15.7%) | 0 (0.0%) |
| 65 to 74 Years | 2 (1.0%) | 1 (0.6%) |
| 75 Years and over | 59 (36.4%) | 11 (7.7%) |
| Total | 126 (13.5%) | 39 (4.0%) |
Income Above Poverty by Sex and Age in Cooperstown
According to the poverty statistics in Cooperstown, males aged under 5 years and females aged under 5 years are the age groups that are most secure financially, with 100.0% of males and 100.0% of females in these age groups living above the poverty line.
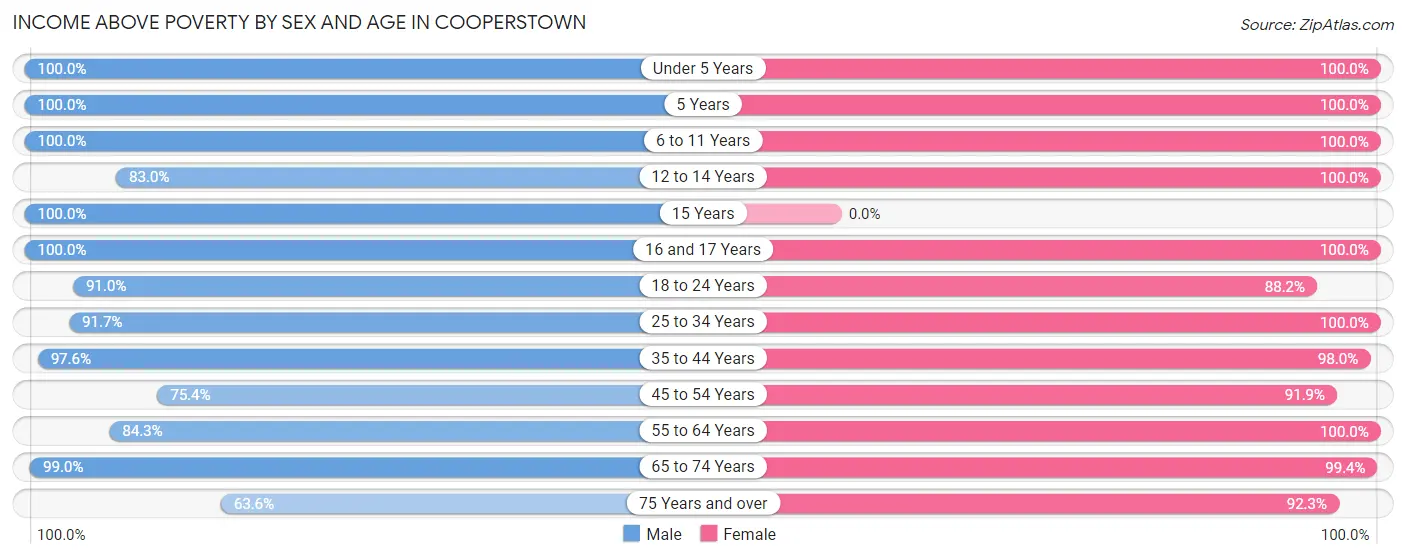
| Age Bracket | Male | Female |
| Under 5 Years | 13 (100.0%) | 14 (100.0%) |
| 5 Years | 3 (100.0%) | 7 (100.0%) |
| 6 to 11 Years | 22 (100.0%) | 27 (100.0%) |
| 12 to 14 Years | 44 (83.0%) | 16 (100.0%) |
| 15 Years | 8 (100.0%) | 0 (0.0%) |
| 16 and 17 Years | 15 (100.0%) | 5 (100.0%) |
| 18 to 24 Years | 81 (91.0%) | 149 (88.2%) |
| 25 to 34 Years | 144 (91.7%) | 163 (100.0%) |
| 35 to 44 Years | 40 (97.6%) | 50 (98.0%) |
| 45 to 54 Years | 52 (75.4%) | 68 (91.9%) |
| 55 to 64 Years | 91 (84.3%) | 151 (100.0%) |
| 65 to 74 Years | 192 (99.0%) | 166 (99.4%) |
| 75 Years and over | 103 (63.6%) | 131 (92.2%) |
| Total | 808 (86.5%) | 947 (96.0%) |
Income Below Poverty Among Married-Couple Families in Cooperstown
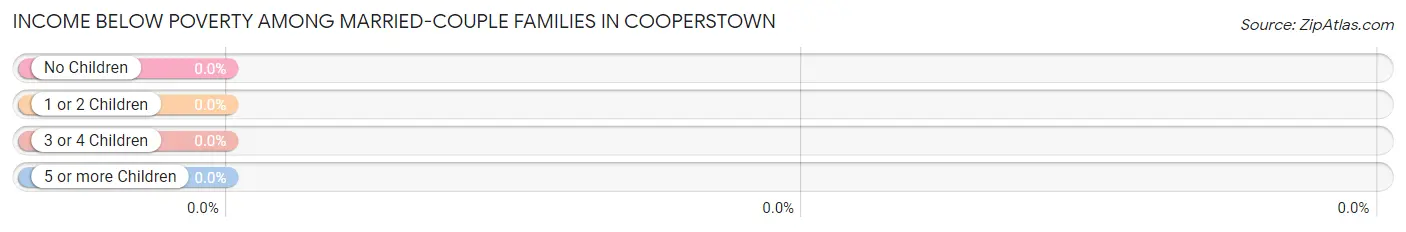
| Children | Above Poverty | Below Poverty |
| No Children | 288 (100.0%) | 0 (0.0%) |
| 1 or 2 Children | 43 (100.0%) | 0 (0.0%) |
| 3 or 4 Children | 27 (100.0%) | 0 (0.0%) |
| 5 or more Children | 0 (0.0%) | 0 (0.0%) |
| Total | 358 (100.0%) | 0 (0.0%) |
Income Below Poverty Among Single-Parent Households in Cooperstown
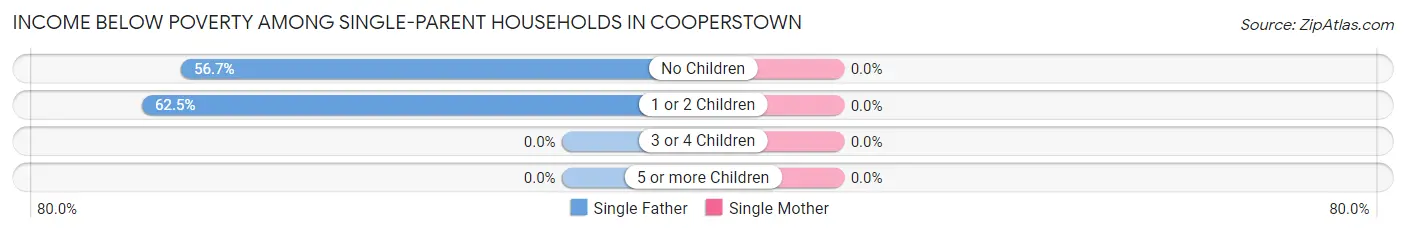
| Children | Single Father | Single Mother |
| No Children | 17 (56.7%) | 0 (0.0%) |
| 1 or 2 Children | 5 (62.5%) | 0 (0.0%) |
| 3 or 4 Children | 0 (0.0%) | 0 (0.0%) |
| 5 or more Children | 0 (0.0%) | 0 (0.0%) |
| Total | 22 (57.9%) | 0 (0.0%) |
Income Below Poverty Among Married-Couple vs Single-Parent Households in Cooperstown
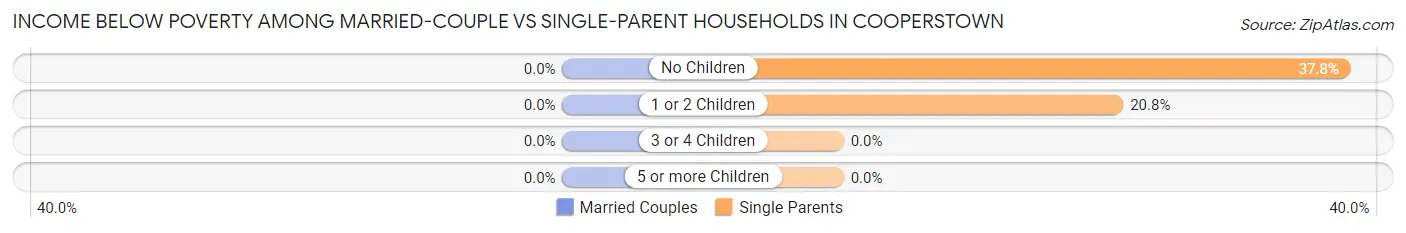
| Children | Married-Couple Families | Single-Parent Households |
| No Children | 0 (0.0%) | 17 (37.8%) |
| 1 or 2 Children | 0 (0.0%) | 5 (20.8%) |
| 3 or 4 Children | 0 (0.0%) | 0 (0.0%) |
| 5 or more Children | 0 (0.0%) | 0 (0.0%) |
| Total | 0 (0.0%) | 22 (31.9%) |
Race in Cooperstown
The most populous races in Cooperstown are White / Caucasian (1,722 | 84.7%), Asian (87 | 4.3%), and Two or more Races (85 | 4.2%).
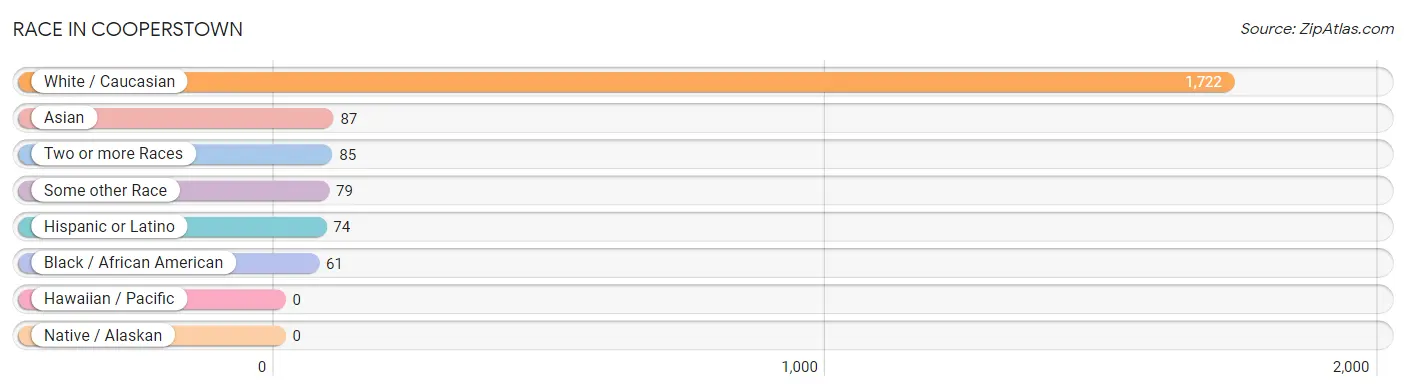
| Race | # Population | % Population |
| Asian | 87 | 4.3% |
| Black / African American | 61 | 3.0% |
| Hawaiian / Pacific | 0 | 0.0% |
| Hispanic or Latino | 74 | 3.6% |
| Native / Alaskan | 0 | 0.0% |
| White / Caucasian | 1,722 | 84.7% |
| Two or more Races | 85 | 4.2% |
| Some other Race | 79 | 3.9% |
| Total | 2,034 | 100.0% |
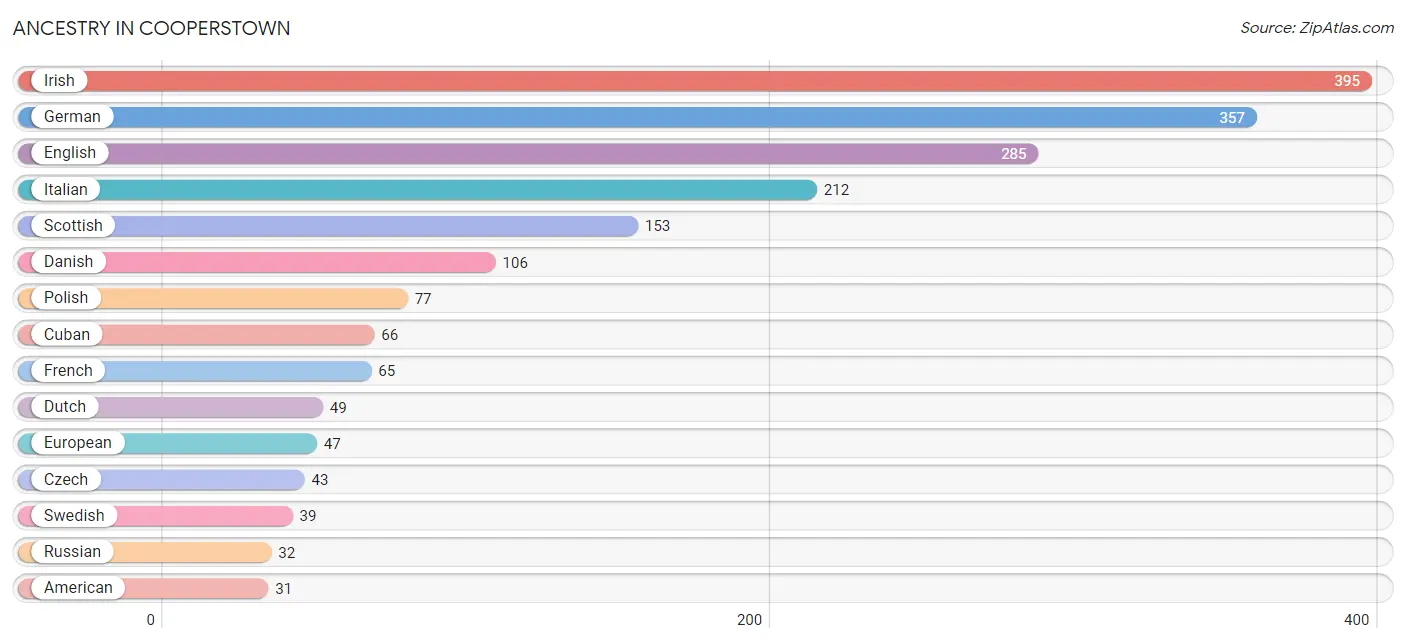
Ancestry in Cooperstown
The most populous ancestries reported in Cooperstown are Irish (395 | 19.4%), German (357 | 17.5%), English (285 | 14.0%), Italian (212 | 10.4%), and Scottish (153 | 7.5%), together accounting for 68.9% of all Cooperstown residents.
| Ancestry | # Population | % Population |
| American | 31 | 1.5% |
| Arab | 13 | 0.6% |
| Austrian | 4 | 0.2% |
| Bhutanese | 7 | 0.3% |
| British West Indian | 7 | 0.3% |
| Central American | 3 | 0.2% |
| Cherokee | 1 | 0.1% |
| Cuban | 66 | 3.2% |
| Czech | 43 | 2.1% |
| Danish | 106 | 5.2% |
| Dutch | 49 | 2.4% |
| Eastern European | 25 | 1.2% |
| Egyptian | 4 | 0.2% |
| English | 285 | 14.0% |
| European | 47 | 2.3% |
| Filipino | 6 | 0.3% |
| French | 65 | 3.2% |
| French Canadian | 15 | 0.7% |
| German | 357 | 17.5% |
| Greek | 21 | 1.0% |
| Guatemalan | 3 | 0.2% |
| Hungarian | 9 | 0.4% |
| Indian (Asian) | 4 | 0.2% |
| Iranian | 7 | 0.3% |
| Irish | 395 | 19.4% |
| Italian | 212 | 10.4% |
| Korean | 24 | 1.2% |
| Lebanese | 9 | 0.4% |
| Northern European | 4 | 0.2% |
| Norwegian | 12 | 0.6% |
| Peruvian | 2 | 0.1% |
| Polish | 77 | 3.8% |
| Romanian | 6 | 0.3% |
| Russian | 32 | 1.6% |
| Scandinavian | 20 | 1.0% |
| Scotch-Irish | 6 | 0.3% |
| Scottish | 153 | 7.5% |
| South American | 2 | 0.1% |
| Sri Lankan | 2 | 0.1% |
| Swedish | 39 | 1.9% |
| Swiss | 5 | 0.3% |
| Thai | 10 | 0.5% |
| Welsh | 11 | 0.5% |
| West Indian | 2 | 0.1% | View All 44 Rows |
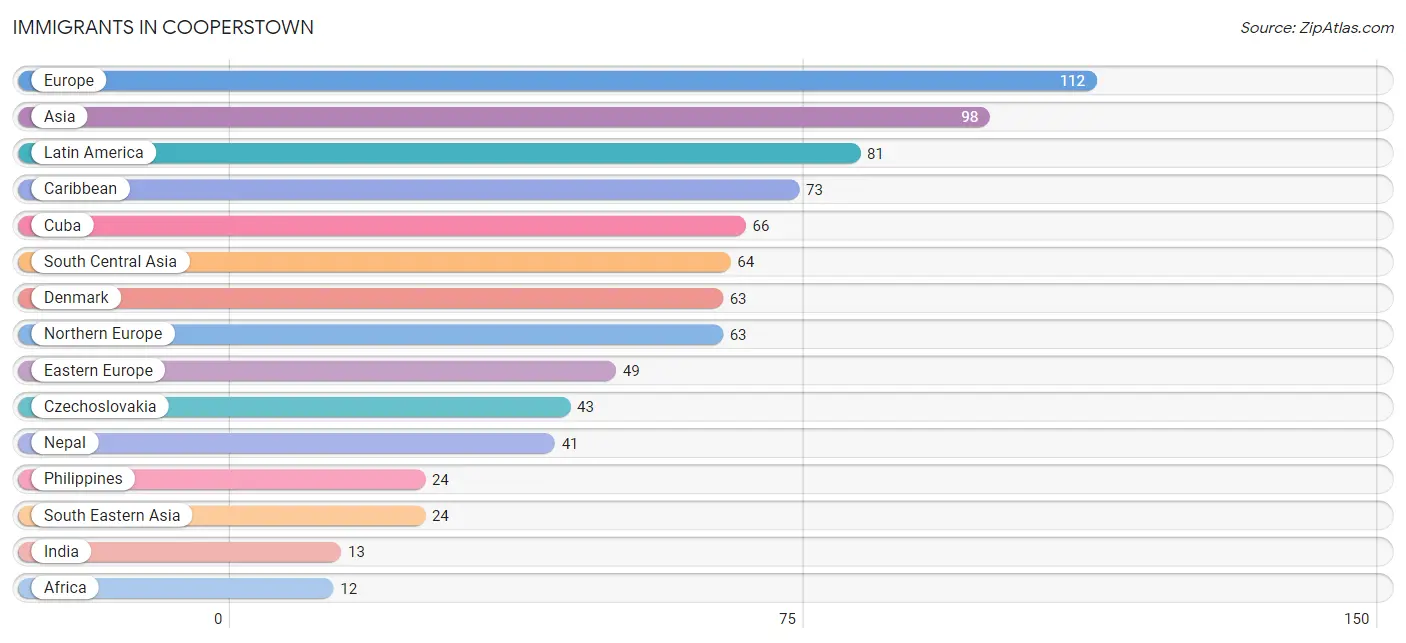
Immigrants in Cooperstown
The most numerous immigrant groups reported in Cooperstown came from Europe (112 | 5.5%), Asia (98 | 4.8%), Latin America (81 | 4.0%), Caribbean (73 | 3.6%), and Cuba (66 | 3.2%), together accounting for 21.1% of all Cooperstown residents.
| Immigration Origin | # Population | % Population |
| Africa | 12 | 0.6% |
| Asia | 98 | 4.8% |
| Brazil | 6 | 0.3% |
| Canada | 5 | 0.3% |
| Caribbean | 73 | 3.6% |
| China | 10 | 0.5% |
| Cuba | 66 | 3.2% |
| Czechoslovakia | 43 | 2.1% |
| Denmark | 63 | 3.1% |
| Eastern Asia | 10 | 0.5% |
| Eastern Europe | 49 | 2.4% |
| Egypt | 4 | 0.2% |
| Europe | 112 | 5.5% |
| Grenada | 7 | 0.3% |
| India | 13 | 0.6% |
| Iran | 7 | 0.3% |
| Latin America | 81 | 4.0% |
| Nepal | 41 | 2.0% |
| Northern Africa | 4 | 0.2% |
| Northern Europe | 63 | 3.1% |
| Peru | 2 | 0.1% |
| Philippines | 24 | 1.2% |
| Romania | 6 | 0.3% |
| South Africa | 8 | 0.4% |
| South America | 8 | 0.4% |
| South Central Asia | 64 | 3.2% |
| South Eastern Asia | 24 | 1.2% |
| Sri Lanka | 3 | 0.2% |
| Taiwan | 6 | 0.3% | View All 29 Rows |
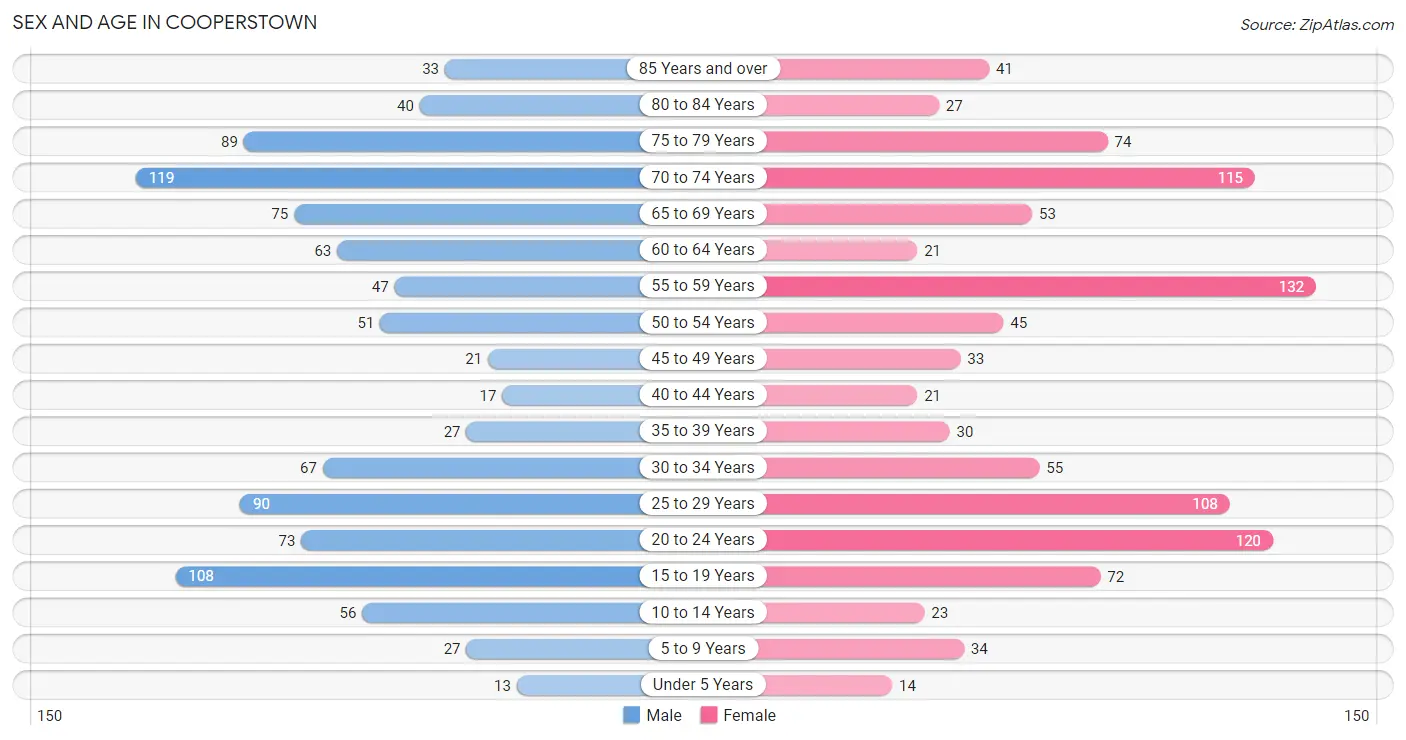
Sex and Age in Cooperstown
Sex and Age in Cooperstown
The most populous age groups in Cooperstown are 70 to 74 Years (119 | 11.7%) for men and 55 to 59 Years (132 | 13.0%) for women.
| Age Bracket | Male | Female |
| Under 5 Years | 13 (1.3%) | 14 (1.4%) |
| 5 to 9 Years | 27 (2.7%) | 34 (3.3%) |
| 10 to 14 Years | 56 (5.5%) | 23 (2.3%) |
| 15 to 19 Years | 108 (10.6%) | 72 (7.1%) |
| 20 to 24 Years | 73 (7.2%) | 120 (11.8%) |
| 25 to 29 Years | 90 (8.9%) | 108 (10.6%) |
| 30 to 34 Years | 67 (6.6%) | 55 (5.4%) |
| 35 to 39 Years | 27 (2.7%) | 30 (2.9%) |
| 40 to 44 Years | 17 (1.7%) | 21 (2.1%) |
| 45 to 49 Years | 21 (2.1%) | 33 (3.2%) |
| 50 to 54 Years | 51 (5.0%) | 45 (4.4%) |
| 55 to 59 Years | 47 (4.6%) | 132 (13.0%) |
| 60 to 64 Years | 63 (6.2%) | 21 (2.1%) |
| 65 to 69 Years | 75 (7.4%) | 53 (5.2%) |
| 70 to 74 Years | 119 (11.7%) | 115 (11.3%) |
| 75 to 79 Years | 89 (8.8%) | 74 (7.3%) |
| 80 to 84 Years | 40 (3.9%) | 27 (2.6%) |
| 85 Years and over | 33 (3.3%) | 41 (4.0%) |
| Total | 1,016 (100.0%) | 1,018 (100.0%) |
Families and Households in Cooperstown
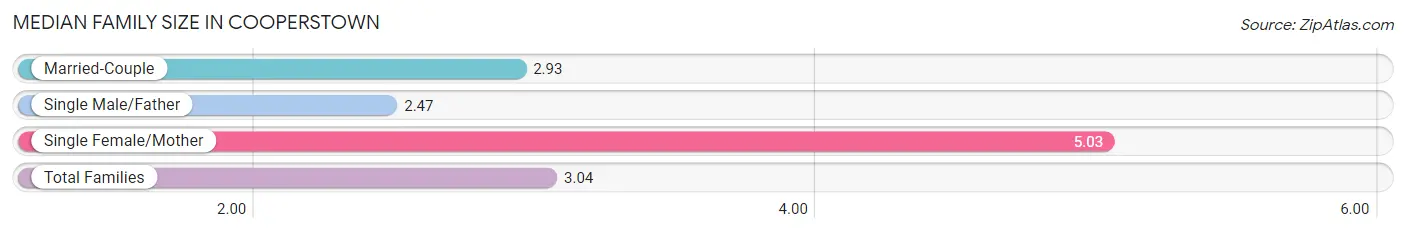
Median Family Size in Cooperstown
The median family size in Cooperstown is 3.04 persons per family, with single female/mother families (31 | 7.3%) accounting for the largest median family size of 5.03 persons per family. On the other hand, single male/father families (38 | 8.9%) represent the smallest median family size with 2.47 persons per family.
| Family Type | # Families | Family Size |
| Married-Couple | 358 (83.8%) | 2.93 |
| Single Male/Father | 38 (8.9%) | 2.47 |
| Single Female/Mother | 31 (7.3%) | 5.03 |
| Total Families | 427 (100.0%) | 3.04 |
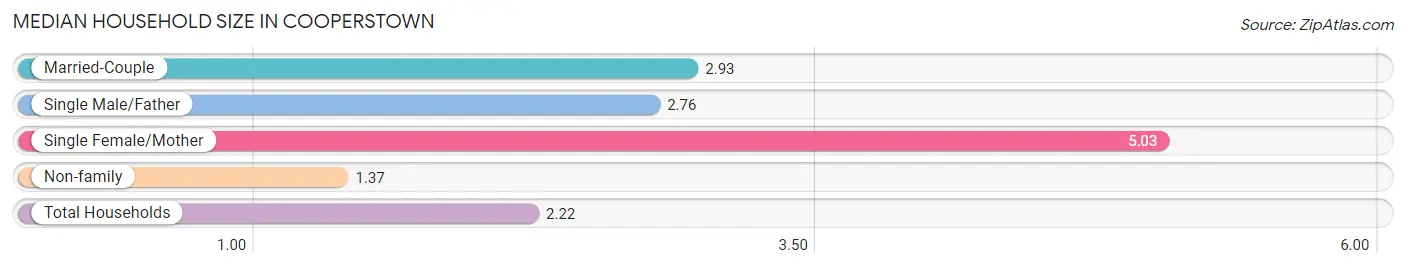
Median Household Size in Cooperstown
The median household size in Cooperstown is 2.22 persons per household, with single female/mother households (31 | 3.6%) accounting for the largest median household size of 5.03 persons per household. non-family households (424 | 49.8%) represent the smallest median household size with 1.37 persons per household.
| Household Type | # Households | Household Size |
| Married-Couple | 358 (42.1%) | 2.93 |
| Single Male/Father | 38 (4.5%) | 2.76 |
| Single Female/Mother | 31 (3.6%) | 5.03 |
| Non-family | 424 (49.8%) | 1.37 |
| Total Households | 851 (100.0%) | 2.22 |
Household Size by Marriage Status in Cooperstown
Out of a total of 851 households in Cooperstown, 427 (50.2%) are family households, while 424 (49.8%) are nonfamily households. The most numerous type of family households are 2-person households, comprising 244, and the most common type of nonfamily households are 1-person households, comprising 349.
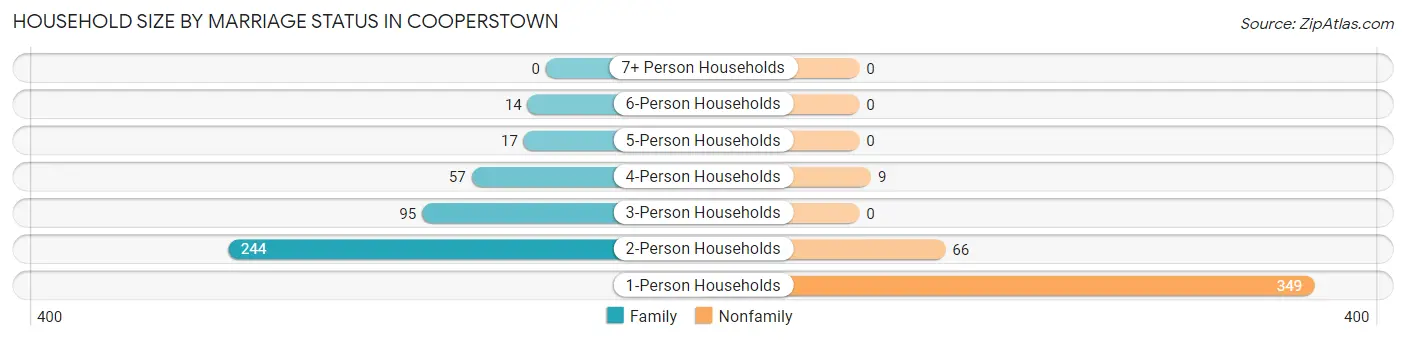
| Household Size | Family Households | Nonfamily Households |
| 1-Person Households | - | 349 (41.0%) |
| 2-Person Households | 244 (28.7%) | 66 (7.8%) |
| 3-Person Households | 95 (11.2%) | 0 (0.0%) |
| 4-Person Households | 57 (6.7%) | 9 (1.1%) |
| 5-Person Households | 17 (2.0%) | 0 (0.0%) |
| 6-Person Households | 14 (1.7%) | 0 (0.0%) |
| 7+ Person Households | 0 (0.0%) | 0 (0.0%) |
| Total | 427 (50.2%) | 424 (49.8%) |
Female Fertility in Cooperstown
Fertility by Age in Cooperstown
Average fertility rate in Cooperstown is 11.0 births per 1,000 women. Women in the age bracket of 20 to 34 years have the highest fertility rate with 18.0 births per 1,000 women. Women in the age bracket of 20 to 34 years acount for 100.0% of all women with births.
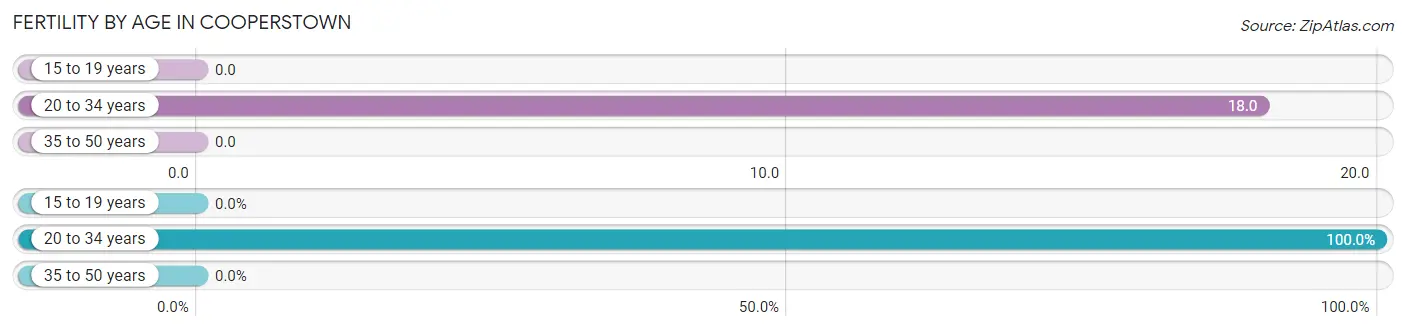
| Age Bracket | Women with Births | Births / 1,000 Women |
| 15 to 19 years | 0 (0.0%) | 0.0 |
| 20 to 34 years | 5 (100.0%) | 18.0 |
| 35 to 50 years | 0 (0.0%) | 0.0 |
| Total | 5 (100.0%) | 11.0 |
Fertility by Age by Marriage Status in Cooperstown
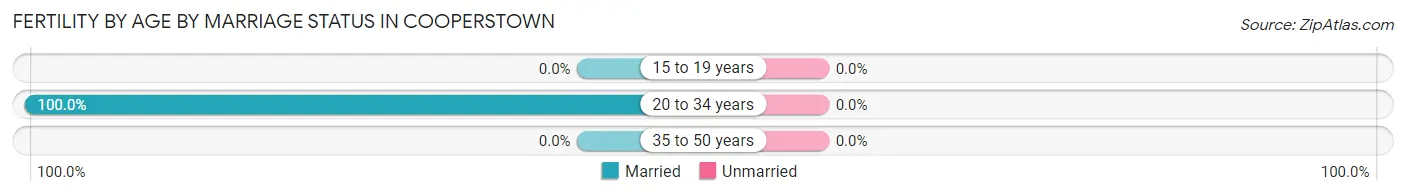
| Age Bracket | Married | Unmarried |
| 15 to 19 years | 0 (0.0%) | 0 (0.0%) |
| 20 to 34 years | 5 (100.0%) | 0 (0.0%) |
| 35 to 50 years | 0 (0.0%) | 0 (0.0%) |
| Total | 5 (100.0%) | 0 (0.0%) |
Fertility by Education in Cooperstown
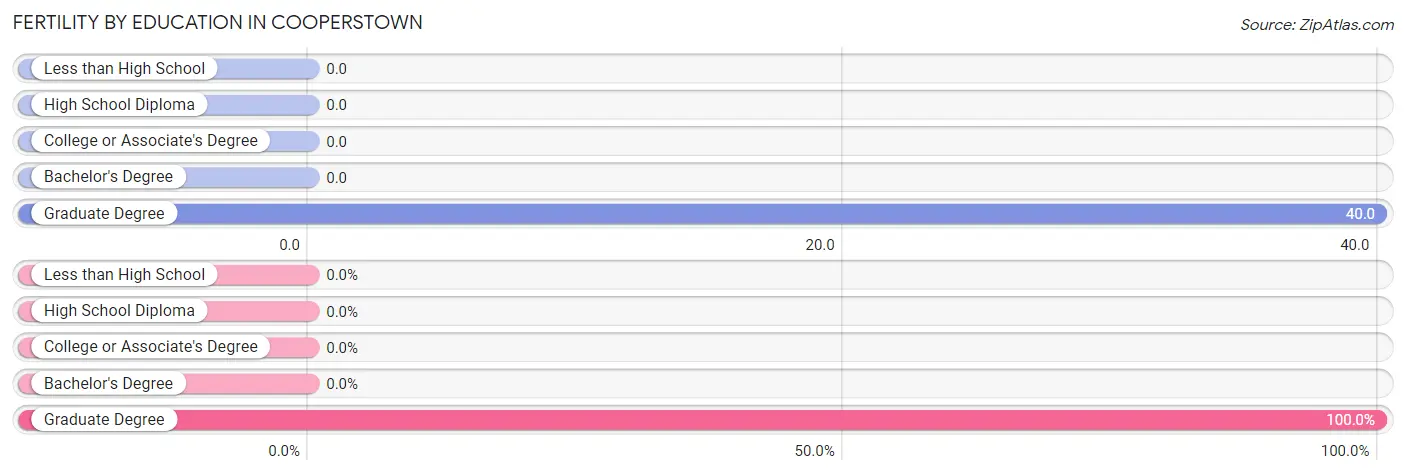
| Educational Attainment | Women with Births | Births / 1,000 Women |
| Less than High School | 0 (0.0%) | 0.0 |
| High School Diploma | 0 (0.0%) | 0.0 |
| College or Associate's Degree | 0 (0.0%) | 0.0 |
| Bachelor's Degree | 0 (0.0%) | 0.0 |
| Graduate Degree | 5 (100.0%) | 40.0 |
| Total | 5 (100.0%) | 11.0 |
Fertility by Education by Marriage Status in Cooperstown
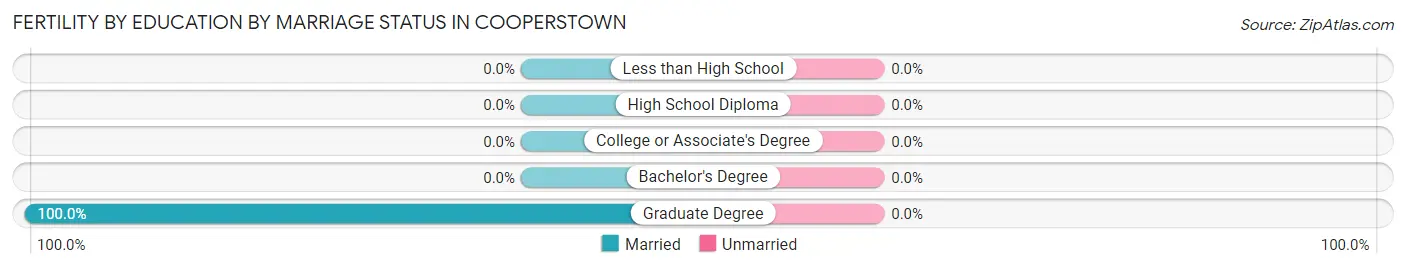
| Educational Attainment | Married | Unmarried |
| Less than High School | 0 (0.0%) | 0 (0.0%) |
| High School Diploma | 0 (0.0%) | 0 (0.0%) |
| College or Associate's Degree | 0 (0.0%) | 0 (0.0%) |
| Bachelor's Degree | 0 (0.0%) | 0 (0.0%) |
| Graduate Degree | 5 (100.0%) | 0 (0.0%) |
| Total | 5 (100.0%) | 0 (0.0%) |
Employment Characteristics in Cooperstown
Employment by Class of Employer in Cooperstown
Among the 941 employed individuals in Cooperstown, private company employees (444 | 47.2%), not-for-profit organizations (247 | 26.3%), and self-employed (incorporated) (143 | 15.2%) make up the most common classes of employment.
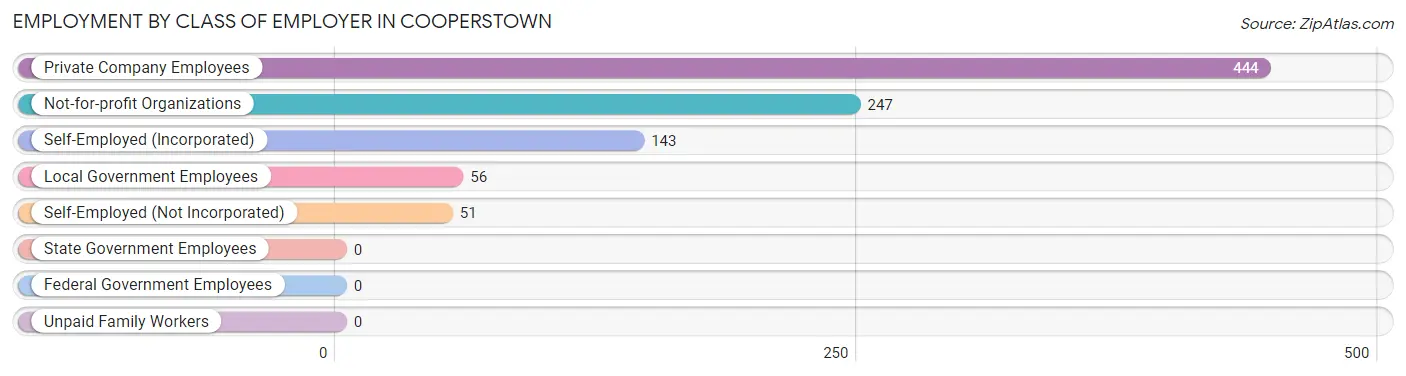
| Employer Class | # Employees | % Employees |
| Private Company Employees | 444 | 47.2% |
| Self-Employed (Incorporated) | 143 | 15.2% |
| Self-Employed (Not Incorporated) | 51 | 5.4% |
| Not-for-profit Organizations | 247 | 26.3% |
| Local Government Employees | 56 | 5.9% |
| State Government Employees | 0 | 0.0% |
| Federal Government Employees | 0 | 0.0% |
| Unpaid Family Workers | 0 | 0.0% |
| Total | 941 | 100.0% |
Employment Status by Age in Cooperstown
According to the labor force statistics for Cooperstown, out of the total population over 16 years of age (1,859), 54.7% or 1,017 individuals are in the labor force, with 5.5% or 56 of them unemployed. The age group with the highest labor force participation rate is 45 to 54 years, with 88.7% or 133 individuals in the labor force. Within the labor force, the 16 to 19 years age range has the highest percentage of unemployed individuals, with 28.0% or 21 of them being unemployed.
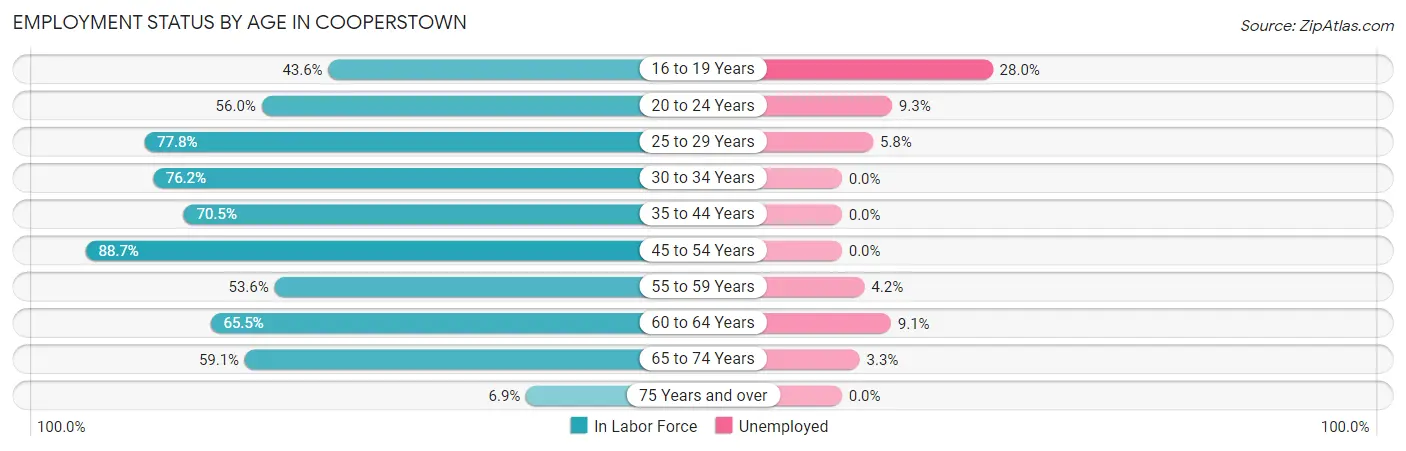
| Age Bracket | In Labor Force | Unemployed |
| 16 to 19 Years | 75 (43.6%) | 21 (28.0%) |
| 20 to 24 Years | 108 (56.0%) | 10 (9.3%) |
| 25 to 29 Years | 154 (77.8%) | 9 (5.8%) |
| 30 to 34 Years | 93 (76.2%) | 0 (0.0%) |
| 35 to 44 Years | 67 (70.5%) | 0 (0.0%) |
| 45 to 54 Years | 133 (88.7%) | 0 (0.0%) |
| 55 to 59 Years | 96 (53.6%) | 4 (4.2%) |
| 60 to 64 Years | 55 (65.5%) | 5 (9.1%) |
| 65 to 74 Years | 214 (59.1%) | 7 (3.3%) |
| 75 Years and over | 21 (6.9%) | 0 (0.0%) |
| Total | 1,017 (54.7%) | 56 (5.5%) |
Employment Status by Educational Attainment in Cooperstown
According to labor force statistics for Cooperstown, 72.2% of individuals (598) out of the total population between 25 and 64 years of age (828) are in the labor force, with 3.0% or 18 of them being unemployed. The group with the highest labor force participation rate are those with the educational attainment of college / associate degree, with 82.3% or 116 individuals in the labor force. Within the labor force, individuals with high school diploma education have the highest percentage of unemployment, with 12.9% or 9 of them being unemployed.
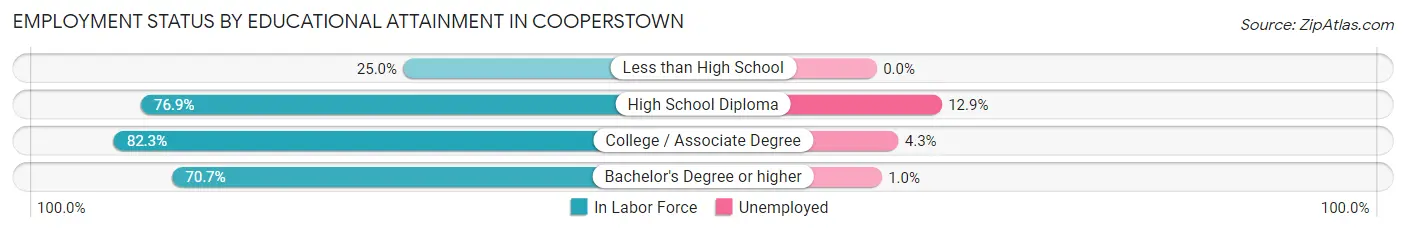
| Educational Attainment | In Labor Force | Unemployed |
| Less than High School | 5 (25.0%) | 0 (0.0%) |
| High School Diploma | 70 (76.9%) | 12 (12.9%) |
| College / Associate Degree | 116 (82.3%) | 6 (4.3%) |
| Bachelor's Degree or higher | 407 (70.7%) | 6 (1.0%) |
| Total | 598 (72.2%) | 25 (3.0%) |
Employment Occupations by Sex in Cooperstown
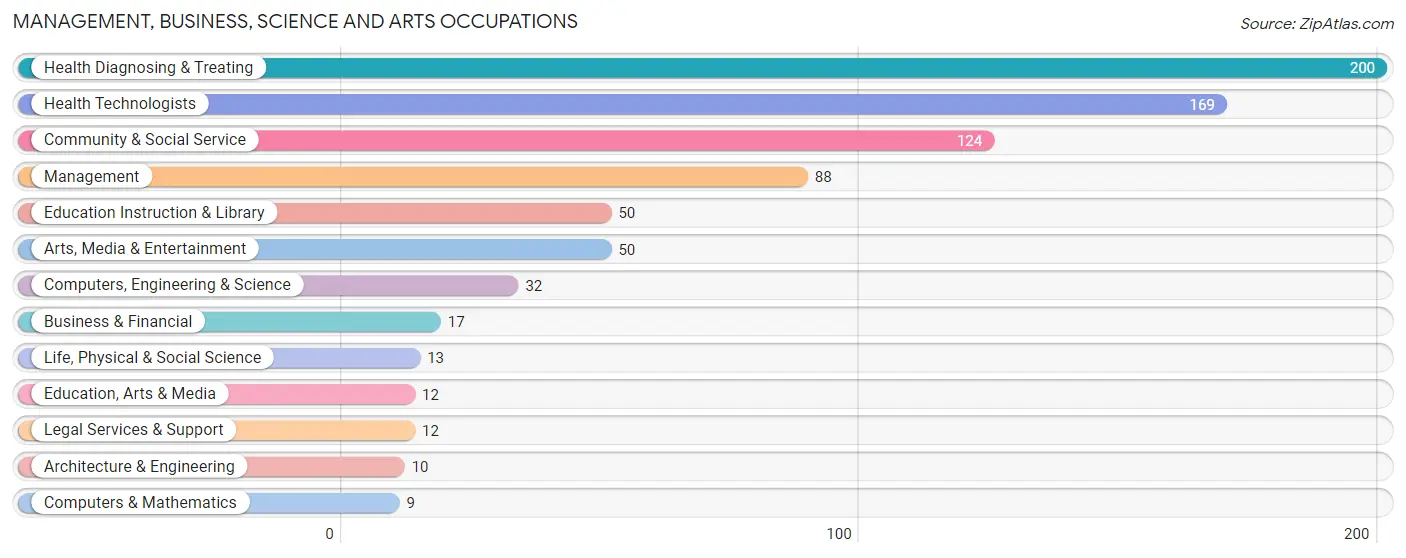
Management, Business, Science and Arts Occupations
The most common Management, Business, Science and Arts occupations in Cooperstown are Health Diagnosing & Treating (200 | 20.8%), Health Technologists (169 | 17.6%), Community & Social Service (124 | 12.9%), Management (88 | 9.2%), and Education Instruction & Library (50 | 5.2%).
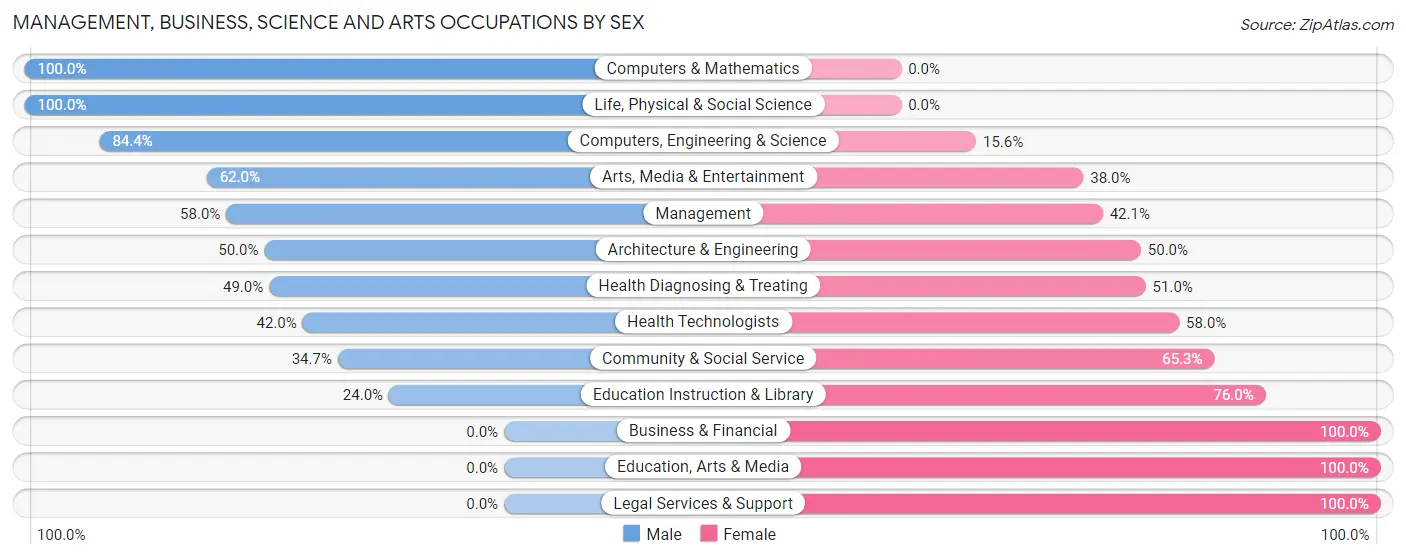
Management, Business, Science and Arts Occupations by Sex
Within the Management, Business, Science and Arts occupations in Cooperstown, the most male-oriented occupations are Computers & Mathematics (100.0%), Life, Physical & Social Science (100.0%), and Computers, Engineering & Science (84.4%), while the most female-oriented occupations are Business & Financial (100.0%), Education, Arts & Media (100.0%), and Legal Services & Support (100.0%).
| Occupation | Male | Female |
| Management | 51 (58.0%) | 37 (42.0%) |
| Business & Financial | 0 (0.0%) | 17 (100.0%) |
| Computers, Engineering & Science | 27 (84.4%) | 5 (15.6%) |
| Computers & Mathematics | 9 (100.0%) | 0 (0.0%) |
| Architecture & Engineering | 5 (50.0%) | 5 (50.0%) |
| Life, Physical & Social Science | 13 (100.0%) | 0 (0.0%) |
| Community & Social Service | 43 (34.7%) | 81 (65.3%) |
| Education, Arts & Media | 0 (0.0%) | 12 (100.0%) |
| Legal Services & Support | 0 (0.0%) | 12 (100.0%) |
| Education Instruction & Library | 12 (24.0%) | 38 (76.0%) |
| Arts, Media & Entertainment | 31 (62.0%) | 19 (38.0%) |
| Health Diagnosing & Treating | 98 (49.0%) | 102 (51.0%) |
| Health Technologists | 71 (42.0%) | 98 (58.0%) |
| Total (Category) | 219 (47.5%) | 242 (52.5%) |
| Total (Overall) | 477 (49.7%) | 483 (50.3%) |
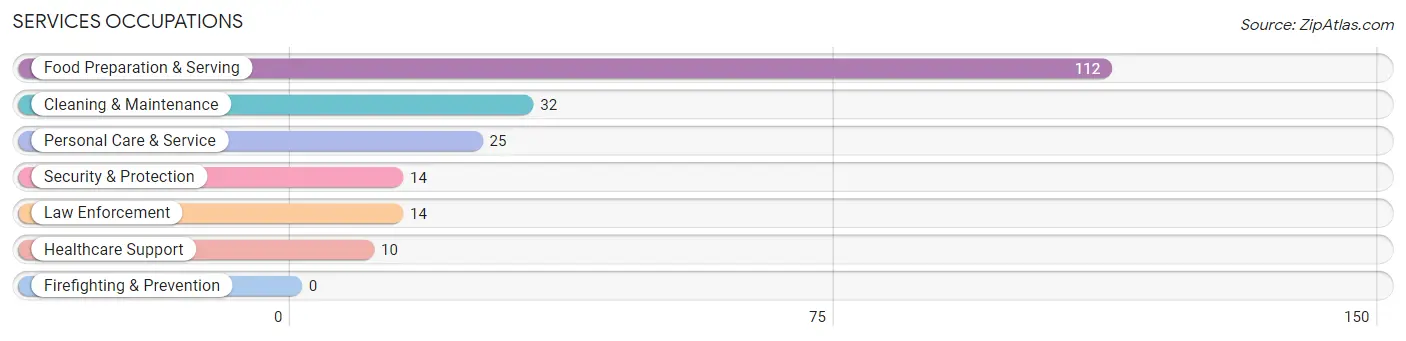
Services Occupations
The most common Services occupations in Cooperstown are Food Preparation & Serving (112 | 11.7%), Cleaning & Maintenance (32 | 3.3%), Personal Care & Service (25 | 2.6%), Security & Protection (14 | 1.5%), and Law Enforcement (14 | 1.5%).
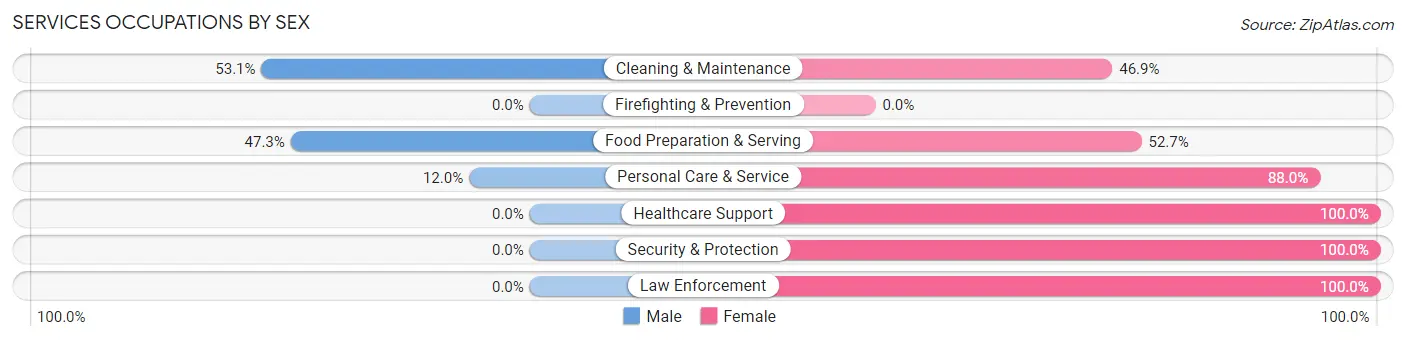
Services Occupations by Sex
Within the Services occupations in Cooperstown, the most male-oriented occupations are Cleaning & Maintenance (53.1%), Food Preparation & Serving (47.3%), and Personal Care & Service (12.0%), while the most female-oriented occupations are Healthcare Support (100.0%), Security & Protection (100.0%), and Law Enforcement (100.0%).
| Occupation | Male | Female |
| Healthcare Support | 0 (0.0%) | 10 (100.0%) |
| Security & Protection | 0 (0.0%) | 14 (100.0%) |
| Firefighting & Prevention | 0 (0.0%) | 0 (0.0%) |
| Law Enforcement | 0 (0.0%) | 14 (100.0%) |
| Food Preparation & Serving | 53 (47.3%) | 59 (52.7%) |
| Cleaning & Maintenance | 17 (53.1%) | 15 (46.9%) |
| Personal Care & Service | 3 (12.0%) | 22 (88.0%) |
| Total (Category) | 73 (37.8%) | 120 (62.2%) |
| Total (Overall) | 477 (49.7%) | 483 (50.3%) |
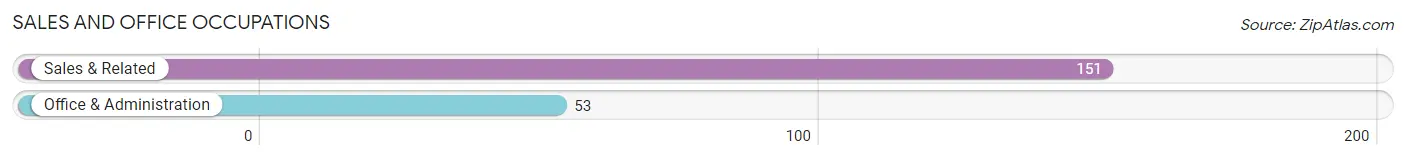
Sales and Office Occupations
The most common Sales and Office occupations in Cooperstown are Sales & Related (151 | 15.7%), and Office & Administration (53 | 5.5%).
Sales and Office Occupations by Sex
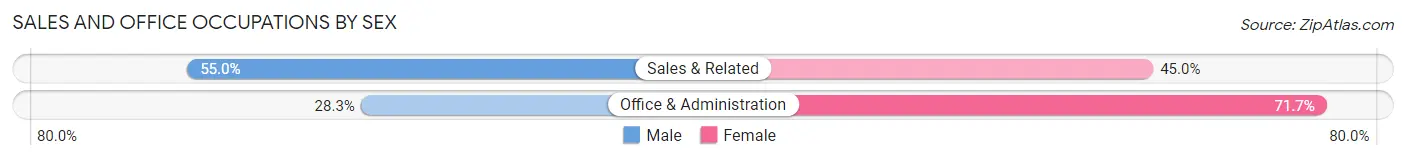
| Occupation | Male | Female |
| Sales & Related | 83 (55.0%) | 68 (45.0%) |
| Office & Administration | 15 (28.3%) | 38 (71.7%) |
| Total (Category) | 98 (48.0%) | 106 (52.0%) |
| Total (Overall) | 477 (49.7%) | 483 (50.3%) |
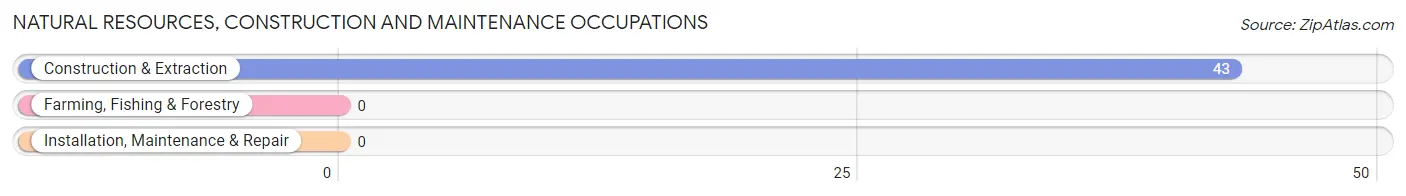
Natural Resources, Construction and Maintenance Occupations
The most common Natural Resources, Construction and Maintenance occupations in Cooperstown are , and Construction & Extraction (43 | 4.5%).
Natural Resources, Construction and Maintenance Occupations by Sex
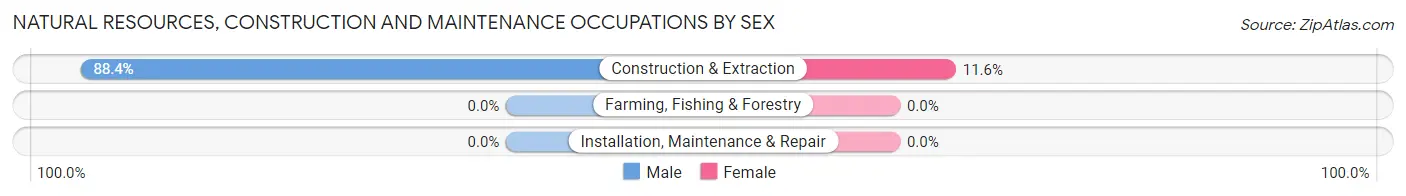
| Occupation | Male | Female |
| Farming, Fishing & Forestry | 0 (0.0%) | 0 (0.0%) |
| Construction & Extraction | 38 (88.4%) | 5 (11.6%) |
| Installation, Maintenance & Repair | 0 (0.0%) | 0 (0.0%) |
| Total (Category) | 38 (88.4%) | 5 (11.6%) |
| Total (Overall) | 477 (49.7%) | 483 (50.3%) |
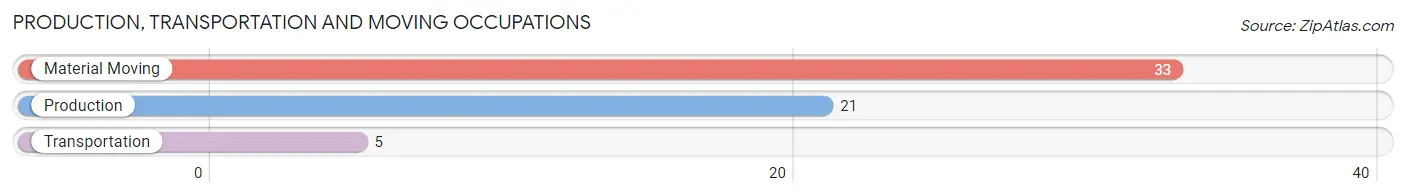
Production, Transportation and Moving Occupations
The most common Production, Transportation and Moving occupations in Cooperstown are Material Moving (33 | 3.4%), Production (21 | 2.2%), and Transportation (5 | 0.5%).
Production, Transportation and Moving Occupations by Sex
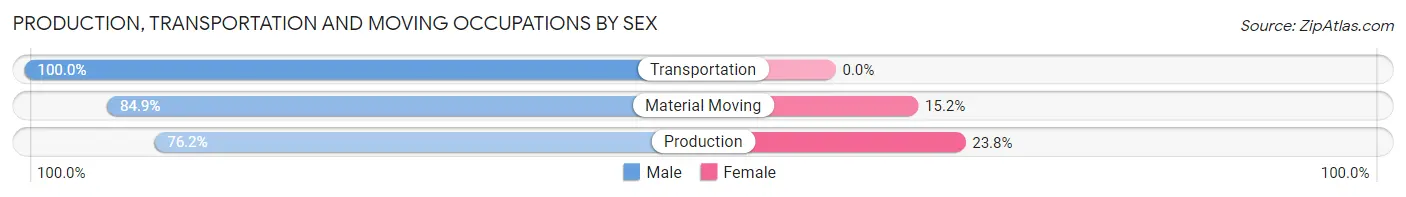
| Occupation | Male | Female |
| Production | 16 (76.2%) | 5 (23.8%) |
| Transportation | 5 (100.0%) | 0 (0.0%) |
| Material Moving | 28 (84.9%) | 5 (15.1%) |
| Total (Category) | 49 (83.1%) | 10 (17.0%) |
| Total (Overall) | 477 (49.7%) | 483 (50.3%) |
Employment Industries by Sex in Cooperstown
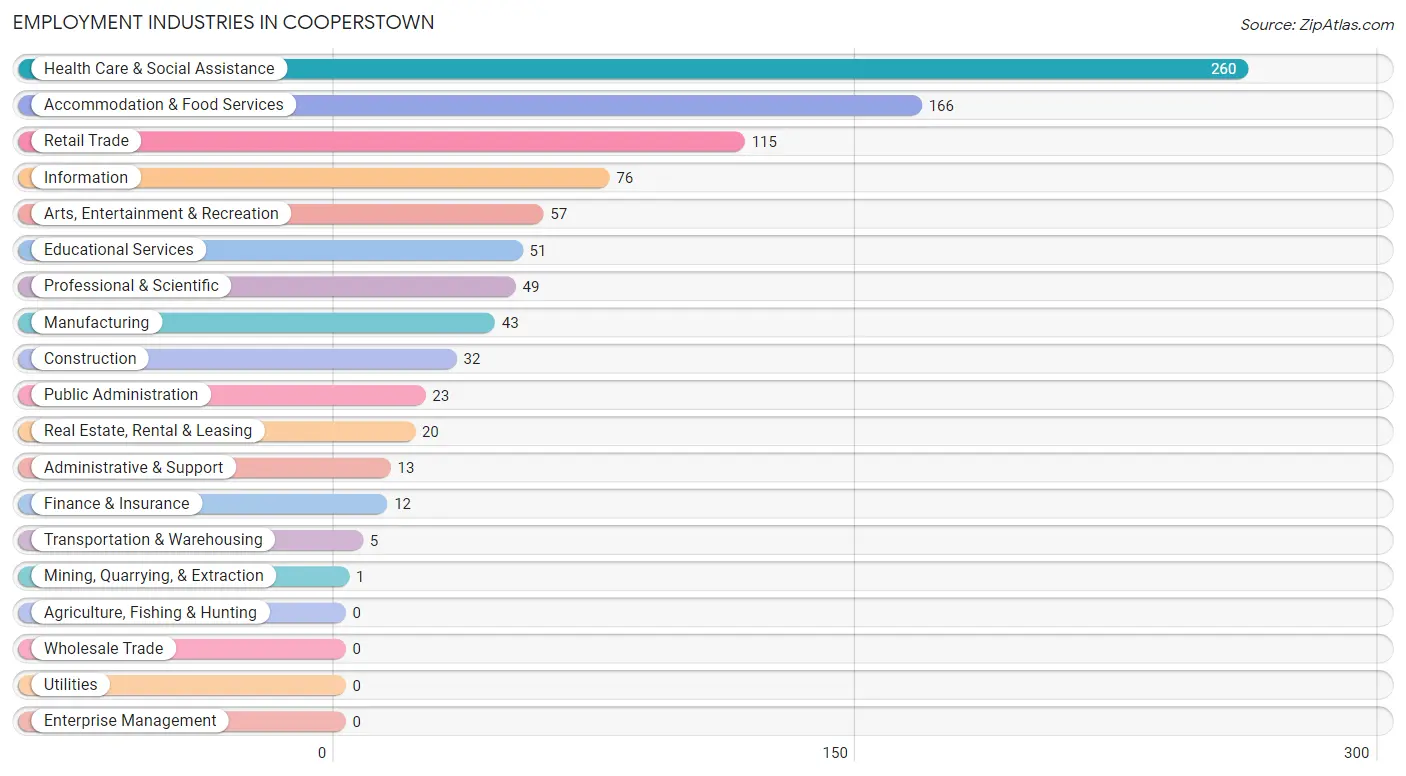
Employment Industries in Cooperstown
The major employment industries in Cooperstown include Health Care & Social Assistance (260 | 27.1%), Accommodation & Food Services (166 | 17.3%), Retail Trade (115 | 12.0%), Information (76 | 7.9%), and Arts, Entertainment & Recreation (57 | 5.9%).
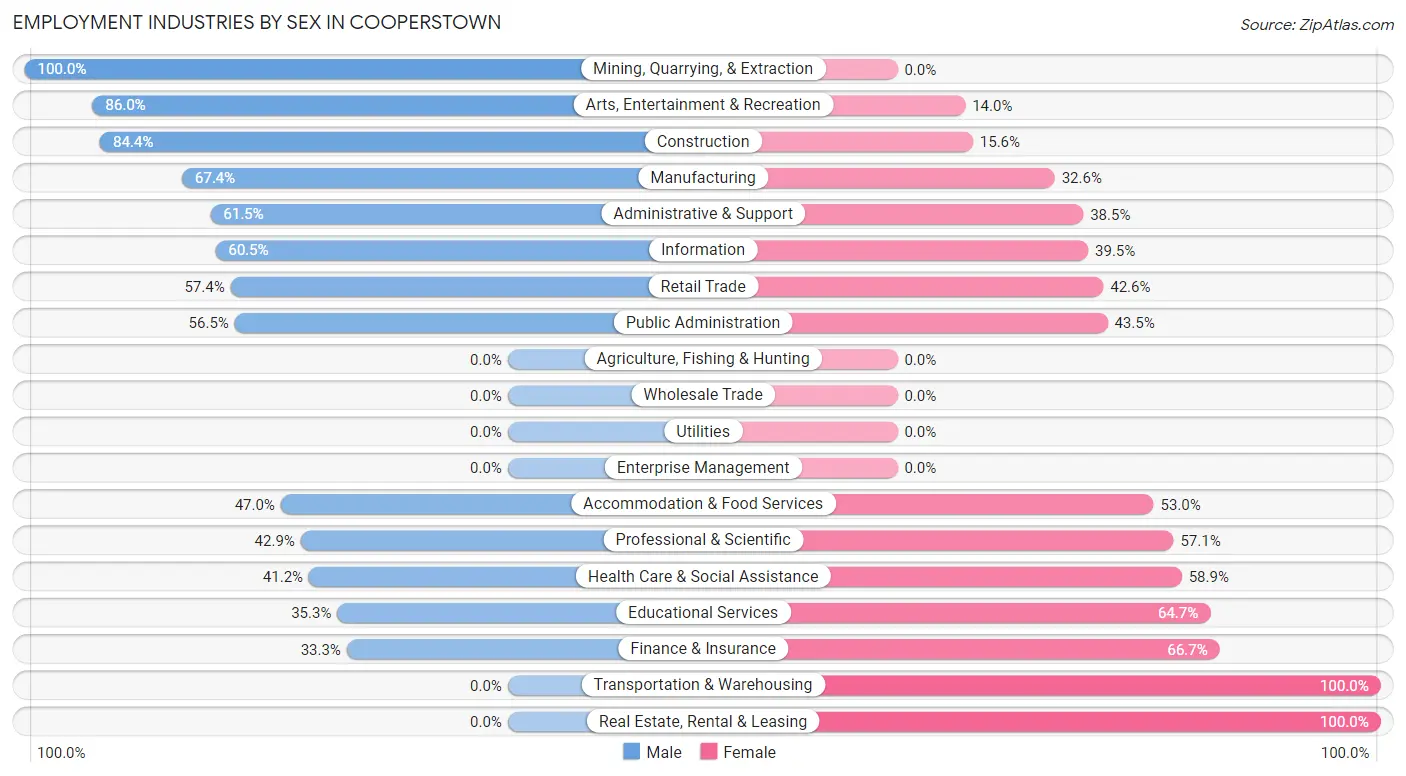
Employment Industries by Sex in Cooperstown
The Cooperstown industries that see more men than women are Mining, Quarrying, & Extraction (100.0%), Arts, Entertainment & Recreation (86.0%), and Construction (84.4%), whereas the industries that tend to have a higher number of women are Transportation & Warehousing (100.0%), Real Estate, Rental & Leasing (100.0%), and Finance & Insurance (66.7%).
| Industry | Male | Female |
| Agriculture, Fishing & Hunting | 0 (0.0%) | 0 (0.0%) |
| Mining, Quarrying, & Extraction | 1 (100.0%) | 0 (0.0%) |
| Construction | 27 (84.4%) | 5 (15.6%) |
| Manufacturing | 29 (67.4%) | 14 (32.6%) |
| Wholesale Trade | 0 (0.0%) | 0 (0.0%) |
| Retail Trade | 66 (57.4%) | 49 (42.6%) |
| Transportation & Warehousing | 0 (0.0%) | 5 (100.0%) |
| Utilities | 0 (0.0%) | 0 (0.0%) |
| Information | 46 (60.5%) | 30 (39.5%) |
| Finance & Insurance | 4 (33.3%) | 8 (66.7%) |
| Real Estate, Rental & Leasing | 0 (0.0%) | 20 (100.0%) |
| Professional & Scientific | 21 (42.9%) | 28 (57.1%) |
| Enterprise Management | 0 (0.0%) | 0 (0.0%) |
| Administrative & Support | 8 (61.5%) | 5 (38.5%) |
| Educational Services | 18 (35.3%) | 33 (64.7%) |
| Health Care & Social Assistance | 107 (41.1%) | 153 (58.9%) |
| Arts, Entertainment & Recreation | 49 (86.0%) | 8 (14.0%) |
| Accommodation & Food Services | 78 (47.0%) | 88 (53.0%) |
| Public Administration | 13 (56.5%) | 10 (43.5%) |
| Total | 477 (49.7%) | 483 (50.3%) |
Education in Cooperstown
School Enrollment in Cooperstown
The most common levels of schooling among the 451 students in Cooperstown are college / undergraduate (157 | 34.8%), high school (117 | 25.9%), and middle school (74 | 16.4%).
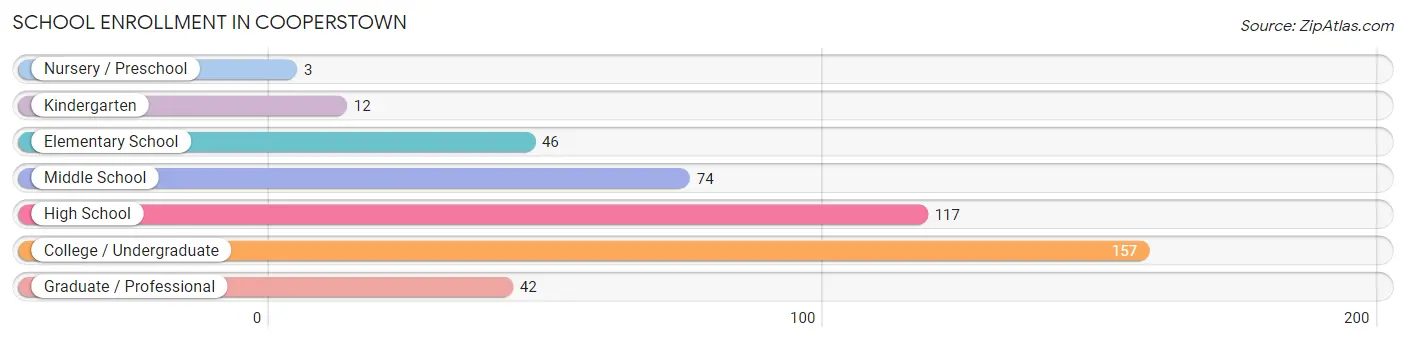
| School Level | # Students | % Students |
| Nursery / Preschool | 3 | 0.7% |
| Kindergarten | 12 | 2.7% |
| Elementary School | 46 | 10.2% |
| Middle School | 74 | 16.4% |
| High School | 117 | 25.9% |
| College / Undergraduate | 157 | 34.8% |
| Graduate / Professional | 42 | 9.3% |
| Total | 451 | 100.0% |
School Enrollment by Age by Funding Source in Cooperstown
Out of a total of 451 students who are enrolled in schools in Cooperstown, 126 (27.9%) attend a private institution, while the remaining 325 (72.1%) are enrolled in public schools. The age group of 35 years and over has the highest likelihood of being enrolled in private schools, with 11 (100.0% in the age bracket) enrolled. Conversely, the age group of 3 to 4 year olds has the lowest likelihood of being enrolled in a private school, with 1 (100.0% in the age bracket) attending a public institution.
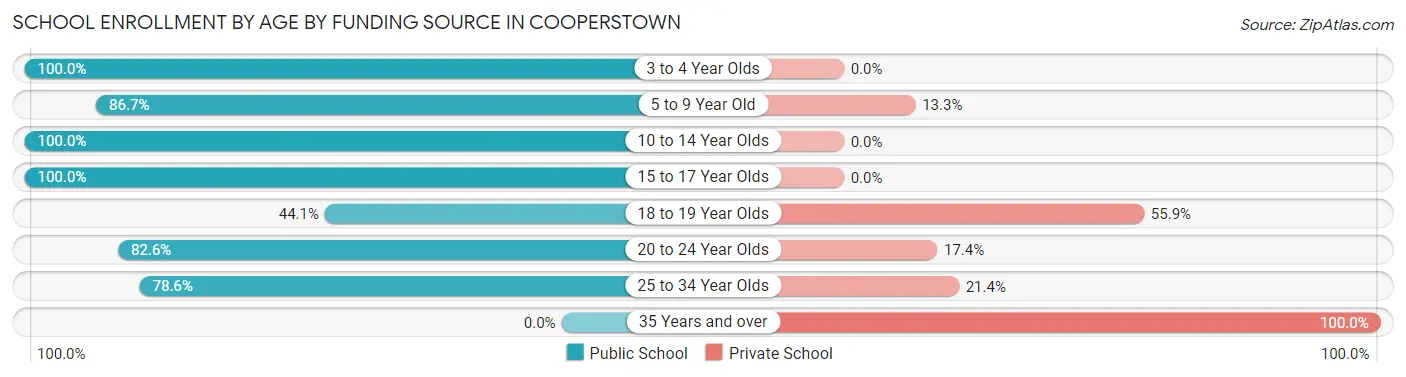
| Age Bracket | Public School | Private School |
| 3 to 4 Year Olds | 1 (100.0%) | 0 (0.0%) |
| 5 to 9 Year Old | 52 (86.7%) | 8 (13.3%) |
| 10 to 14 Year Olds | 79 (100.0%) | 0 (0.0%) |
| 15 to 17 Year Olds | 28 (100.0%) | 0 (0.0%) |
| 18 to 19 Year Olds | 67 (44.1%) | 85 (55.9%) |
| 20 to 24 Year Olds | 76 (82.6%) | 16 (17.4%) |
| 25 to 34 Year Olds | 22 (78.6%) | 6 (21.4%) |
| 35 Years and over | 0 (0.0%) | 11 (100.0%) |
| Total | 325 (72.1%) | 126 (27.9%) |
Educational Attainment by Field of Study in Cooperstown
Business (148 | 14.2%), science & technology (132 | 12.6%), bio, nature & agricultural (121 | 11.6%), education (116 | 11.1%), and social sciences (97 | 9.3%) are the most common fields of study among 1,044 individuals in Cooperstown who have obtained a bachelor's degree or higher.
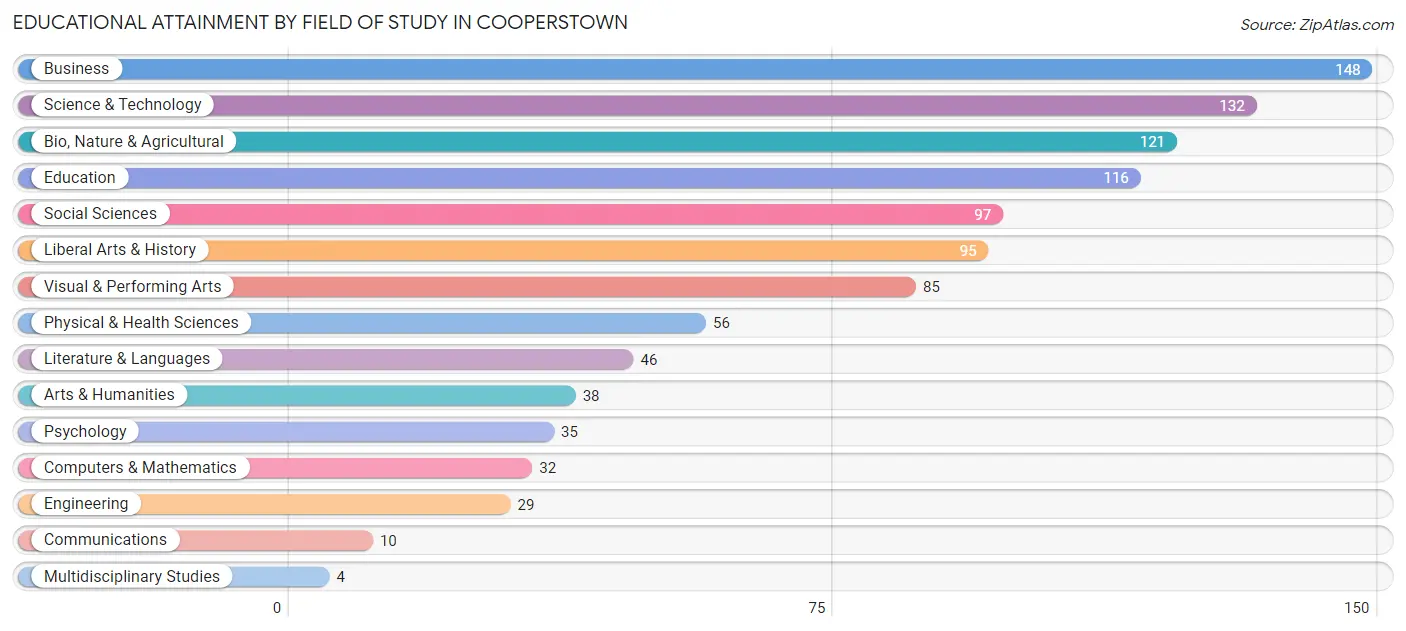
| Field of Study | # Graduates | % Graduates |
| Computers & Mathematics | 32 | 3.1% |
| Bio, Nature & Agricultural | 121 | 11.6% |
| Physical & Health Sciences | 56 | 5.4% |
| Psychology | 35 | 3.4% |
| Social Sciences | 97 | 9.3% |
| Engineering | 29 | 2.8% |
| Multidisciplinary Studies | 4 | 0.4% |
| Science & Technology | 132 | 12.6% |
| Business | 148 | 14.2% |
| Education | 116 | 11.1% |
| Literature & Languages | 46 | 4.4% |
| Liberal Arts & History | 95 | 9.1% |
| Visual & Performing Arts | 85 | 8.1% |
| Communications | 10 | 1.0% |
| Arts & Humanities | 38 | 3.6% |
| Total | 1,044 | 100.0% |
Transportation & Commute in Cooperstown
Vehicle Availability by Sex in Cooperstown
The most prevalent vehicle ownership categories in Cooperstown are males with 3 vehicles (172, accounting for 36.5%) and females with 3 vehicles (75, making up 37.1%).
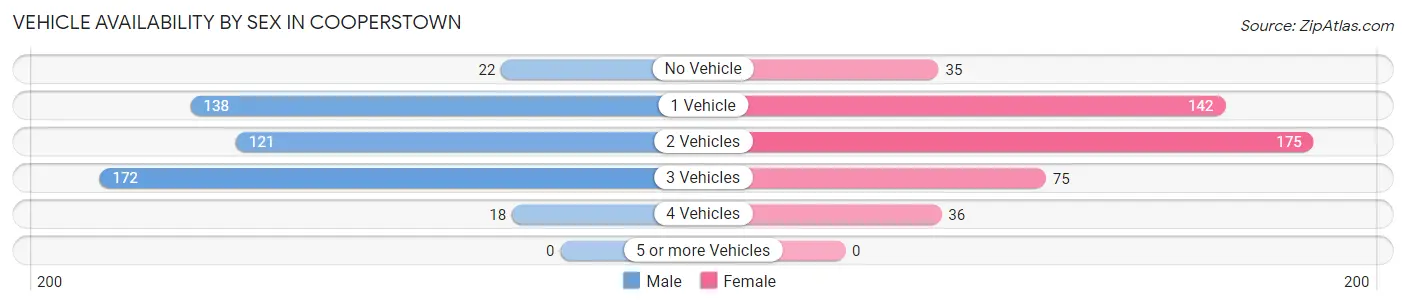
| Vehicles Available | Male | Female |
| No Vehicle | 22 (4.7%) | 35 (7.6%) |
| 1 Vehicle | 138 (29.3%) | 142 (30.7%) |
| 2 Vehicles | 121 (25.7%) | 175 (37.8%) |
| 3 Vehicles | 172 (36.5%) | 75 (16.2%) |
| 4 Vehicles | 18 (3.8%) | 36 (7.8%) |
| 5 or more Vehicles | 0 (0.0%) | 0 (0.0%) |
| Total | 471 (100.0%) | 463 (100.0%) |
Commute Time in Cooperstown
The most frequently occuring commute durations in Cooperstown are 5 to 9 minutes (236 commuters, 30.6%), 10 to 14 minutes (199 commuters, 25.8%), and 15 to 19 minutes (108 commuters, 14.0%).
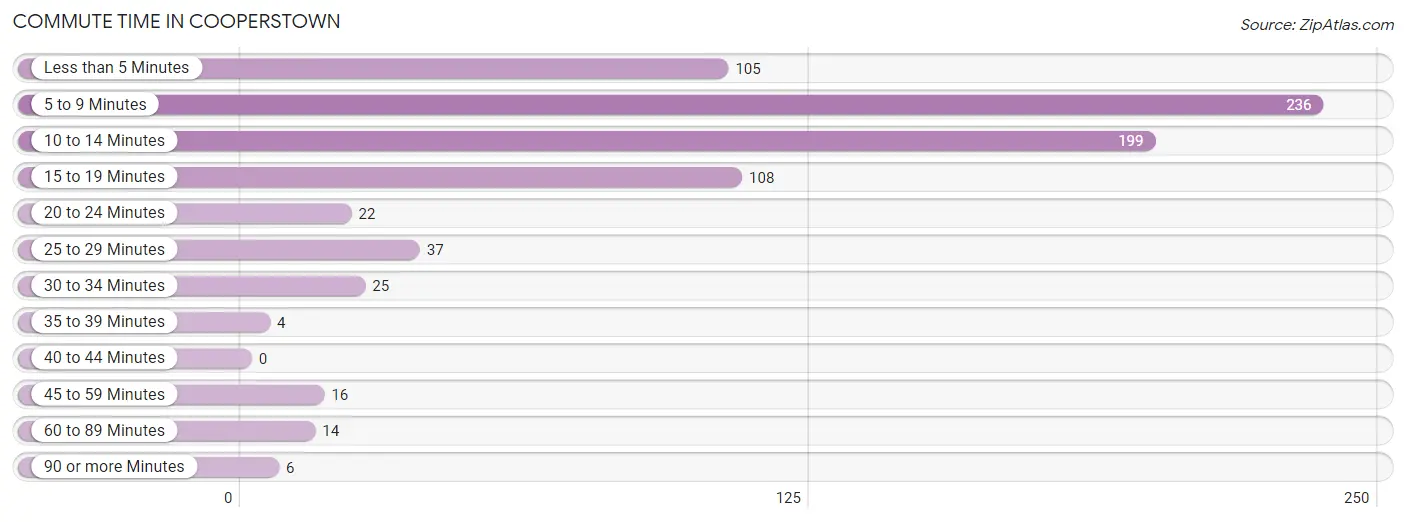
| Commute Time | # Commuters | % Commuters |
| Less than 5 Minutes | 105 | 13.6% |
| 5 to 9 Minutes | 236 | 30.6% |
| 10 to 14 Minutes | 199 | 25.8% |
| 15 to 19 Minutes | 108 | 14.0% |
| 20 to 24 Minutes | 22 | 2.9% |
| 25 to 29 Minutes | 37 | 4.8% |
| 30 to 34 Minutes | 25 | 3.2% |
| 35 to 39 Minutes | 4 | 0.5% |
| 40 to 44 Minutes | 0 | 0.0% |
| 45 to 59 Minutes | 16 | 2.1% |
| 60 to 89 Minutes | 14 | 1.8% |
| 90 or more Minutes | 6 | 0.8% |
Commute Time by Sex in Cooperstown
The most common commute times in Cooperstown are 10 to 14 minutes (127 commuters, 34.4%) for males and 5 to 9 minutes (147 commuters, 36.5%) for females.
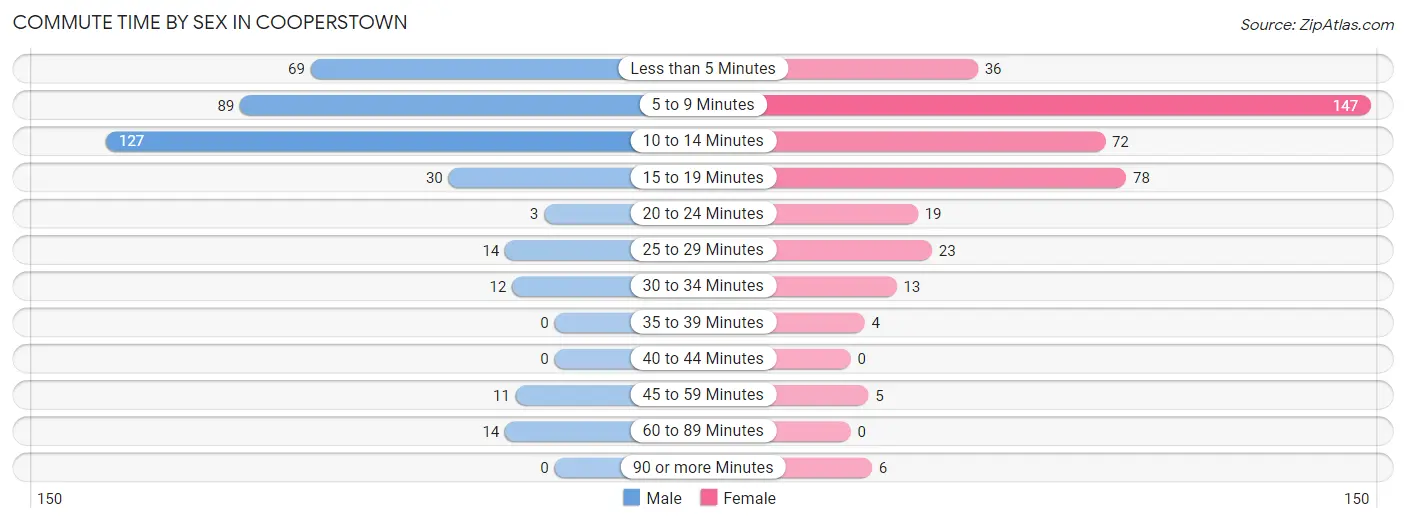
| Commute Time | Male | Female |
| Less than 5 Minutes | 69 (18.7%) | 36 (8.9%) |
| 5 to 9 Minutes | 89 (24.1%) | 147 (36.5%) |
| 10 to 14 Minutes | 127 (34.4%) | 72 (17.9%) |
| 15 to 19 Minutes | 30 (8.1%) | 78 (19.4%) |
| 20 to 24 Minutes | 3 (0.8%) | 19 (4.7%) |
| 25 to 29 Minutes | 14 (3.8%) | 23 (5.7%) |
| 30 to 34 Minutes | 12 (3.3%) | 13 (3.2%) |
| 35 to 39 Minutes | 0 (0.0%) | 4 (1.0%) |
| 40 to 44 Minutes | 0 (0.0%) | 0 (0.0%) |
| 45 to 59 Minutes | 11 (3.0%) | 5 (1.2%) |
| 60 to 89 Minutes | 14 (3.8%) | 0 (0.0%) |
| 90 or more Minutes | 0 (0.0%) | 6 (1.5%) |
Time of Departure to Work by Sex in Cooperstown
The most frequent times of departure to work in Cooperstown are 7:00 AM to 7:29 AM (78, 21.1%) for males and 8:00 AM to 8:29 AM (62, 15.4%) for females.
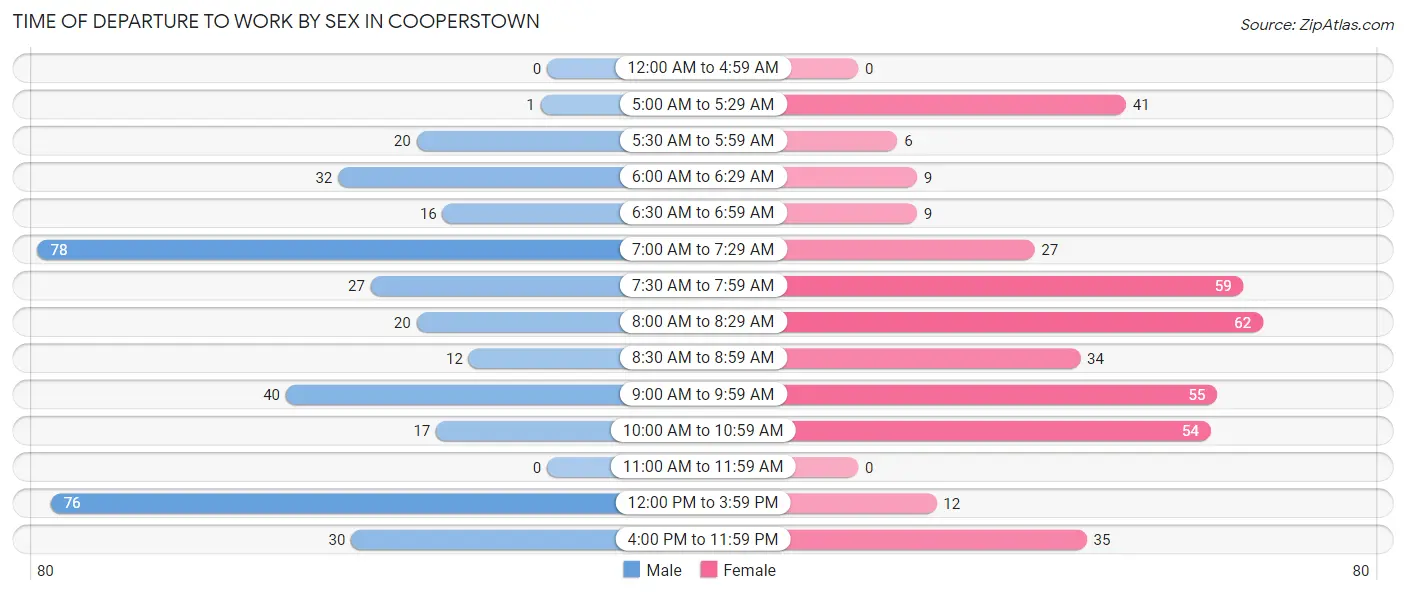
| Time of Departure | Male | Female |
| 12:00 AM to 4:59 AM | 0 (0.0%) | 0 (0.0%) |
| 5:00 AM to 5:29 AM | 1 (0.3%) | 41 (10.2%) |
| 5:30 AM to 5:59 AM | 20 (5.4%) | 6 (1.5%) |
| 6:00 AM to 6:29 AM | 32 (8.7%) | 9 (2.2%) |
| 6:30 AM to 6:59 AM | 16 (4.3%) | 9 (2.2%) |
| 7:00 AM to 7:29 AM | 78 (21.1%) | 27 (6.7%) |
| 7:30 AM to 7:59 AM | 27 (7.3%) | 59 (14.6%) |
| 8:00 AM to 8:29 AM | 20 (5.4%) | 62 (15.4%) |
| 8:30 AM to 8:59 AM | 12 (3.3%) | 34 (8.4%) |
| 9:00 AM to 9:59 AM | 40 (10.8%) | 55 (13.7%) |
| 10:00 AM to 10:59 AM | 17 (4.6%) | 54 (13.4%) |
| 11:00 AM to 11:59 AM | 0 (0.0%) | 0 (0.0%) |
| 12:00 PM to 3:59 PM | 76 (20.6%) | 12 (3.0%) |
| 4:00 PM to 11:59 PM | 30 (8.1%) | 35 (8.7%) |
| Total | 369 (100.0%) | 403 (100.0%) |
Housing Occupancy in Cooperstown
Occupancy by Ownership in Cooperstown
Of the total 851 dwellings in Cooperstown, owner-occupied units account for 492 (57.8%), while renter-occupied units make up 359 (42.2%).
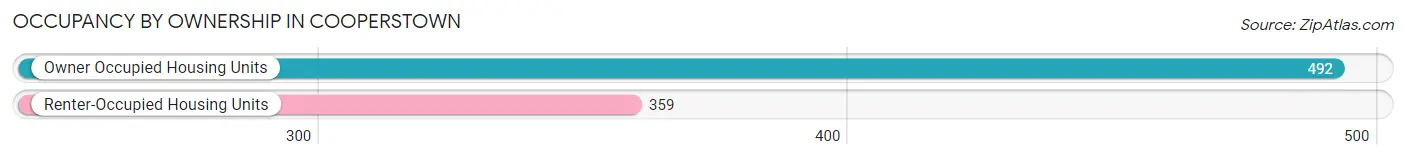
| Occupancy | # Housing Units | % Housing Units |
| Owner Occupied Housing Units | 492 | 57.8% |
| Renter-Occupied Housing Units | 359 | 42.2% |
| Total Occupied Housing Units | 851 | 100.0% |
Occupancy by Household Size in Cooperstown
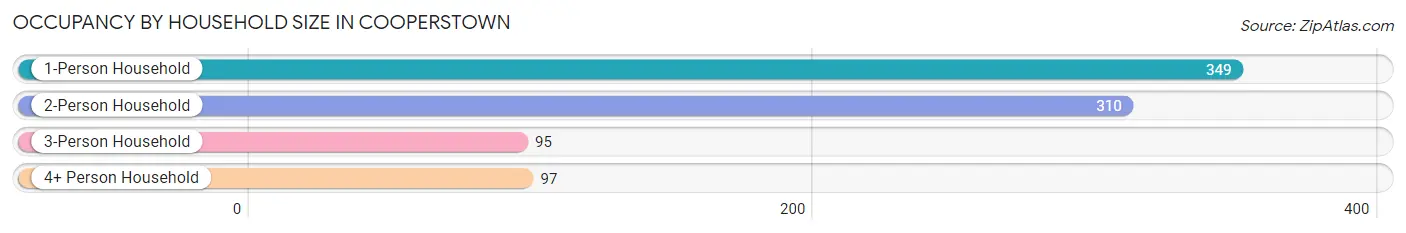
| Household Size | # Housing Units | % Housing Units |
| 1-Person Household | 349 | 41.0% |
| 2-Person Household | 310 | 36.4% |
| 3-Person Household | 95 | 11.2% |
| 4+ Person Household | 97 | 11.4% |
| Total Housing Units | 851 | 100.0% |
Occupancy by Ownership by Household Size in Cooperstown
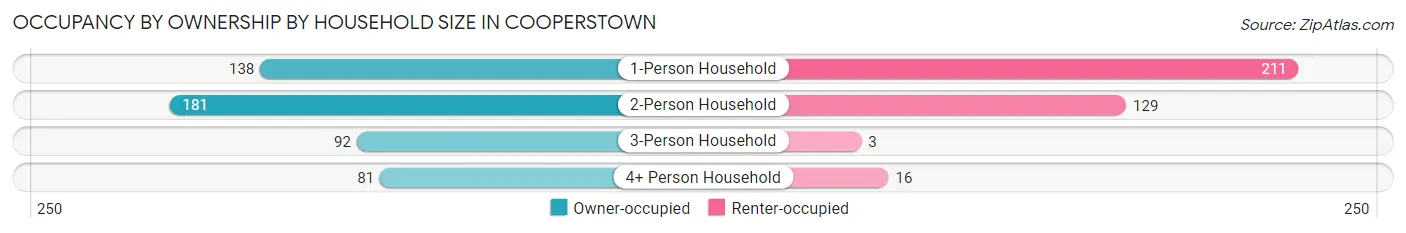
| Household Size | Owner-occupied | Renter-occupied |
| 1-Person Household | 138 (39.5%) | 211 (60.5%) |
| 2-Person Household | 181 (58.4%) | 129 (41.6%) |
| 3-Person Household | 92 (96.8%) | 3 (3.2%) |
| 4+ Person Household | 81 (83.5%) | 16 (16.5%) |
| Total Housing Units | 492 (57.8%) | 359 (42.2%) |
Occupancy by Educational Attainment in Cooperstown
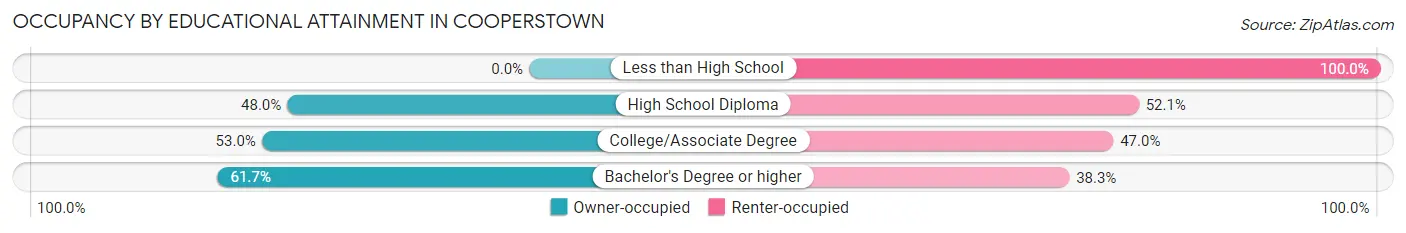
| Household Size | Owner-occupied | Renter-occupied |
| Less than High School | 0 (0.0%) | 7 (100.0%) |
| High School Diploma | 35 (47.9%) | 38 (52.0%) |
| College/Associate Degree | 115 (53.0%) | 102 (47.0%) |
| Bachelor's Degree or higher | 342 (61.7%) | 212 (38.3%) |
Occupancy by Age of Householder in Cooperstown
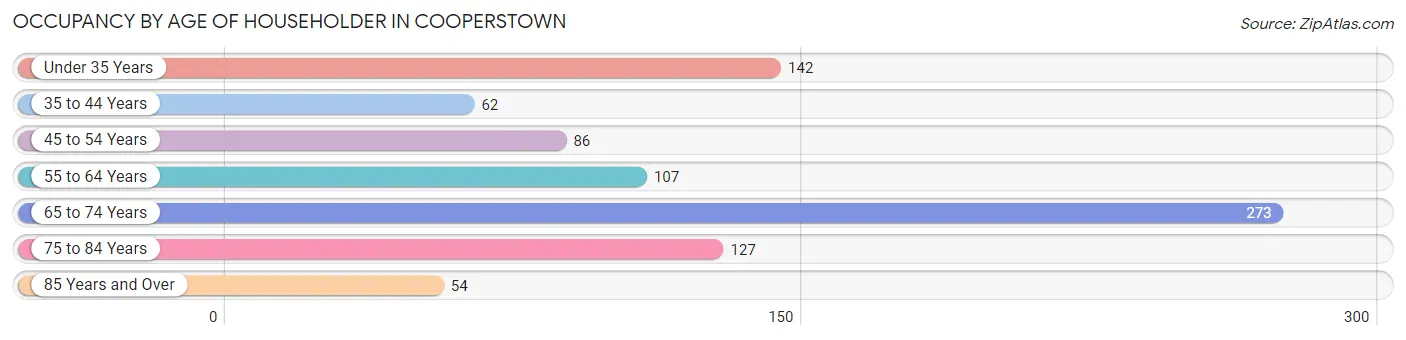
| Age Bracket | # Households | % Households |
| Under 35 Years | 142 | 16.7% |
| 35 to 44 Years | 62 | 7.3% |
| 45 to 54 Years | 86 | 10.1% |
| 55 to 64 Years | 107 | 12.6% |
| 65 to 74 Years | 273 | 32.1% |
| 75 to 84 Years | 127 | 14.9% |
| 85 Years and Over | 54 | 6.4% |
| Total | 851 | 100.0% |
Housing Finances in Cooperstown
Median Income by Occupancy in Cooperstown
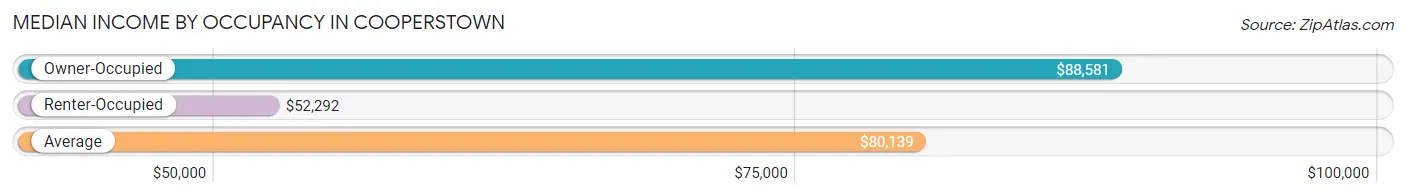
| Occupancy Type | # Households | Median Income |
| Owner-Occupied | 492 (57.8%) | $88,581 |
| Renter-Occupied | 359 (42.2%) | $52,292 |
| Average | 851 (100.0%) | $80,139 |
Occupancy by Householder Income Bracket in Cooperstown
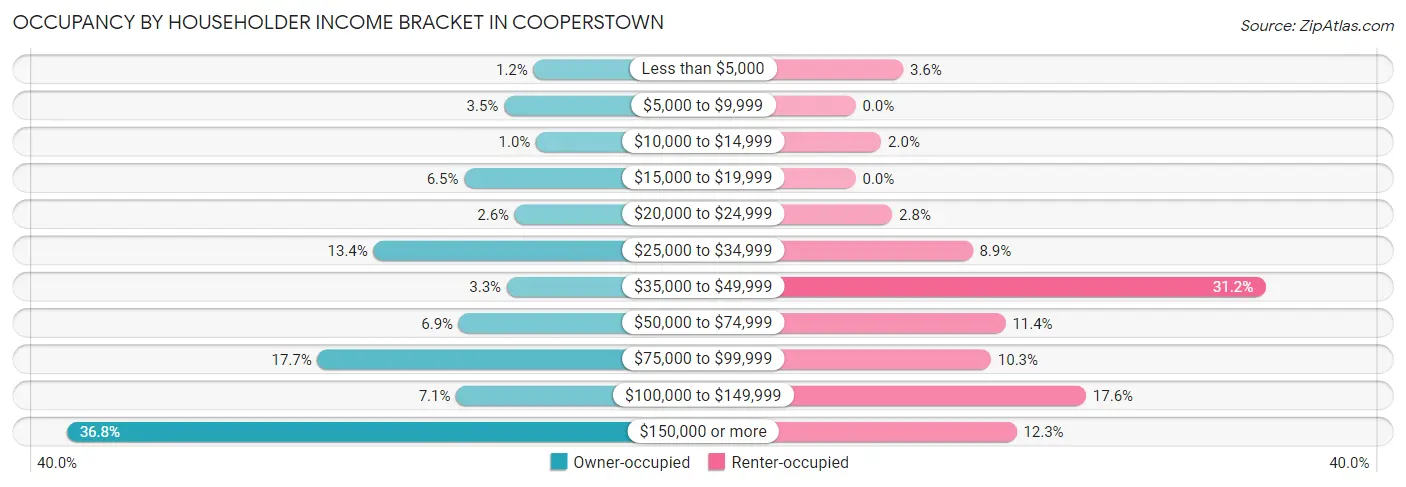
| Income Bracket | Owner-occupied | Renter-occupied |
| Less than $5,000 | 6 (1.2%) | 13 (3.6%) |
| $5,000 to $9,999 | 17 (3.5%) | 0 (0.0%) |
| $10,000 to $14,999 | 5 (1.0%) | 7 (1.9%) |
| $15,000 to $19,999 | 32 (6.5%) | 0 (0.0%) |
| $20,000 to $24,999 | 13 (2.6%) | 10 (2.8%) |
| $25,000 to $34,999 | 66 (13.4%) | 32 (8.9%) |
| $35,000 to $49,999 | 16 (3.3%) | 112 (31.2%) |
| $50,000 to $74,999 | 34 (6.9%) | 41 (11.4%) |
| $75,000 to $99,999 | 87 (17.7%) | 37 (10.3%) |
| $100,000 to $149,999 | 35 (7.1%) | 63 (17.5%) |
| $150,000 or more | 181 (36.8%) | 44 (12.3%) |
| Total | 492 (100.0%) | 359 (100.0%) |
Monthly Housing Cost Tiers in Cooperstown
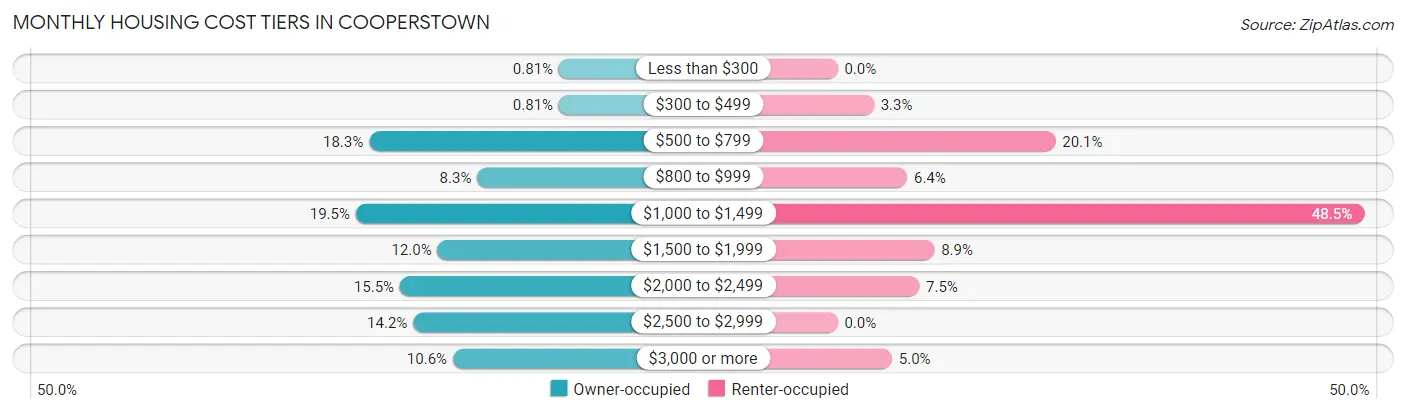
| Monthly Cost | Owner-occupied | Renter-occupied |
| Less than $300 | 4 (0.8%) | 0 (0.0%) |
| $300 to $499 | 4 (0.8%) | 12 (3.3%) |
| $500 to $799 | 90 (18.3%) | 72 (20.1%) |
| $800 to $999 | 41 (8.3%) | 23 (6.4%) |
| $1,000 to $1,499 | 96 (19.5%) | 174 (48.5%) |
| $1,500 to $1,999 | 59 (12.0%) | 32 (8.9%) |
| $2,000 to $2,499 | 76 (15.4%) | 27 (7.5%) |
| $2,500 to $2,999 | 70 (14.2%) | 0 (0.0%) |
| $3,000 or more | 52 (10.6%) | 18 (5.0%) |
| Total | 492 (100.0%) | 359 (100.0%) |
Physical Housing Characteristics in Cooperstown
Housing Structures in Cooperstown
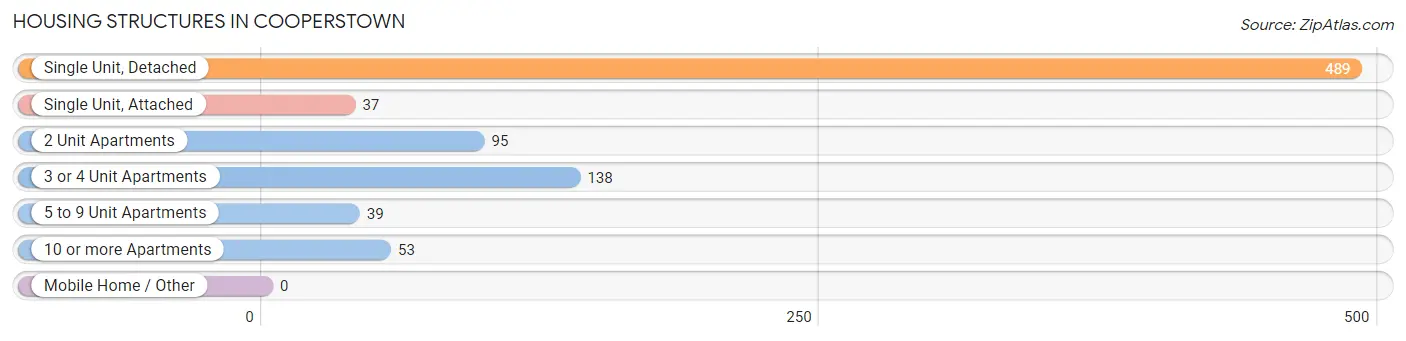
| Structure Type | # Housing Units | % Housing Units |
| Single Unit, Detached | 489 | 57.5% |
| Single Unit, Attached | 37 | 4.3% |
| 2 Unit Apartments | 95 | 11.2% |
| 3 or 4 Unit Apartments | 138 | 16.2% |
| 5 to 9 Unit Apartments | 39 | 4.6% |
| 10 or more Apartments | 53 | 6.2% |
| Mobile Home / Other | 0 | 0.0% |
| Total | 851 | 100.0% |
Housing Structures by Occupancy in Cooperstown
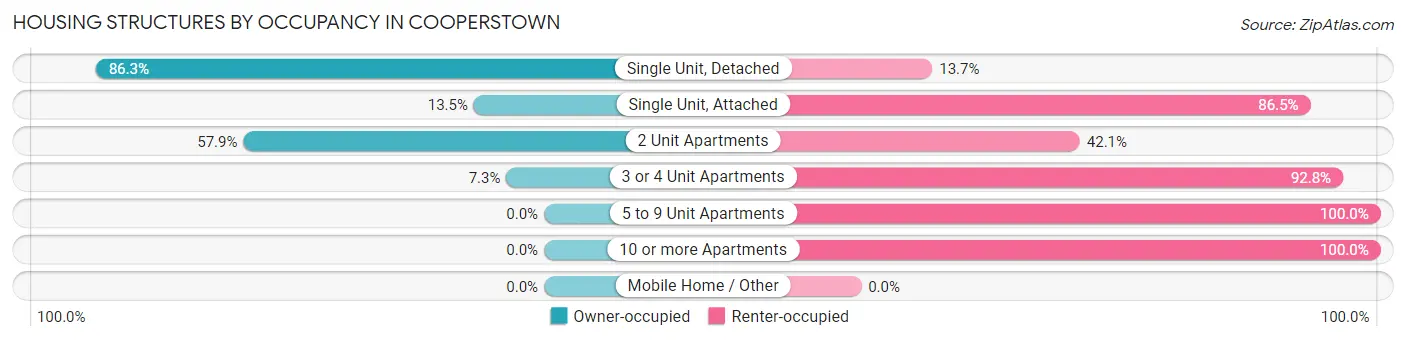
| Structure Type | Owner-occupied | Renter-occupied |
| Single Unit, Detached | 422 (86.3%) | 67 (13.7%) |
| Single Unit, Attached | 5 (13.5%) | 32 (86.5%) |
| 2 Unit Apartments | 55 (57.9%) | 40 (42.1%) |
| 3 or 4 Unit Apartments | 10 (7.2%) | 128 (92.7%) |
| 5 to 9 Unit Apartments | 0 (0.0%) | 39 (100.0%) |
| 10 or more Apartments | 0 (0.0%) | 53 (100.0%) |
| Mobile Home / Other | 0 (0.0%) | 0 (0.0%) |
| Total | 492 (57.8%) | 359 (42.2%) |
Housing Structures by Number of Rooms in Cooperstown
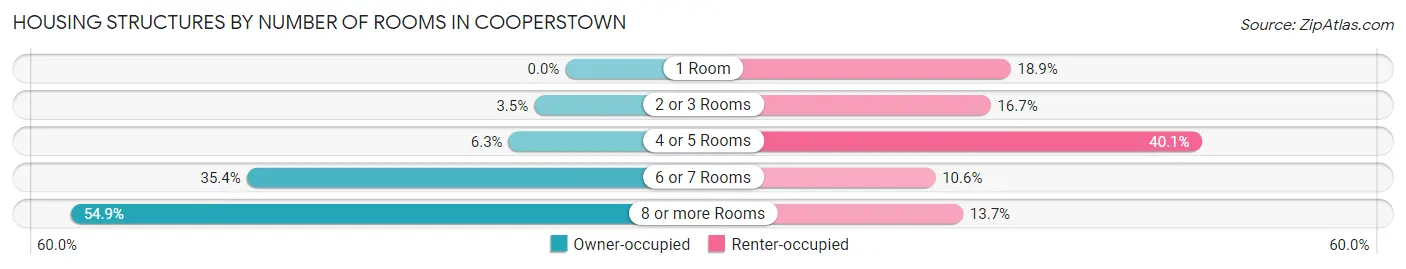
| Number of Rooms | Owner-occupied | Renter-occupied |
| 1 Room | 0 (0.0%) | 68 (18.9%) |
| 2 or 3 Rooms | 17 (3.5%) | 60 (16.7%) |
| 4 or 5 Rooms | 31 (6.3%) | 144 (40.1%) |
| 6 or 7 Rooms | 174 (35.4%) | 38 (10.6%) |
| 8 or more Rooms | 270 (54.9%) | 49 (13.7%) |
| Total | 492 (100.0%) | 359 (100.0%) |
Housing Structure by Heating Type in Cooperstown
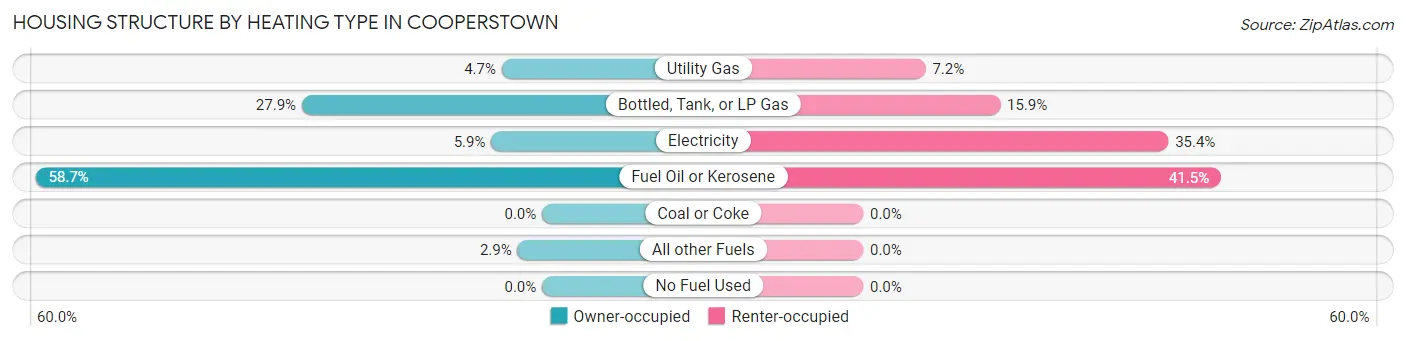
| Heating Type | Owner-occupied | Renter-occupied |
| Utility Gas | 23 (4.7%) | 26 (7.2%) |
| Bottled, Tank, or LP Gas | 137 (27.9%) | 57 (15.9%) |
| Electricity | 29 (5.9%) | 127 (35.4%) |
| Fuel Oil or Kerosene | 289 (58.7%) | 149 (41.5%) |
| Coal or Coke | 0 (0.0%) | 0 (0.0%) |
| All other Fuels | 14 (2.9%) | 0 (0.0%) |
| No Fuel Used | 0 (0.0%) | 0 (0.0%) |
| Total | 492 (100.0%) | 359 (100.0%) |
Household Vehicle Usage in Cooperstown
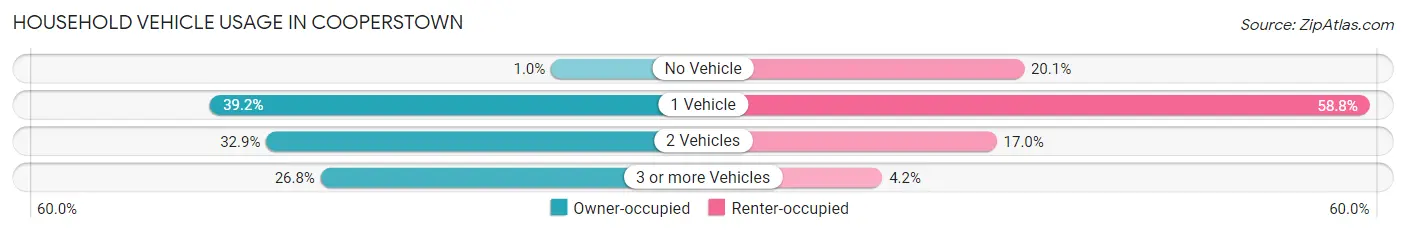
| Vehicles per Household | Owner-occupied | Renter-occupied |
| No Vehicle | 5 (1.0%) | 72 (20.1%) |
| 1 Vehicle | 193 (39.2%) | 211 (58.8%) |
| 2 Vehicles | 162 (32.9%) | 61 (17.0%) |
| 3 or more Vehicles | 132 (26.8%) | 15 (4.2%) |
| Total | 492 (100.0%) | 359 (100.0%) |
Real Estate & Mortgages in Cooperstown
Real Estate and Mortgage Overview in Cooperstown
| Characteristic | Without Mortgage | With Mortgage |
| Housing Units | 235 | 257 |
| Median Property Value | $462,800 | $362,300 |
| Median Household Income | $84,063 | $96 |
| Monthly Housing Costs | $1,092 | $42 |
| Real Estate Taxes | $8,556 | $17 |
Property Value by Mortgage Status in Cooperstown
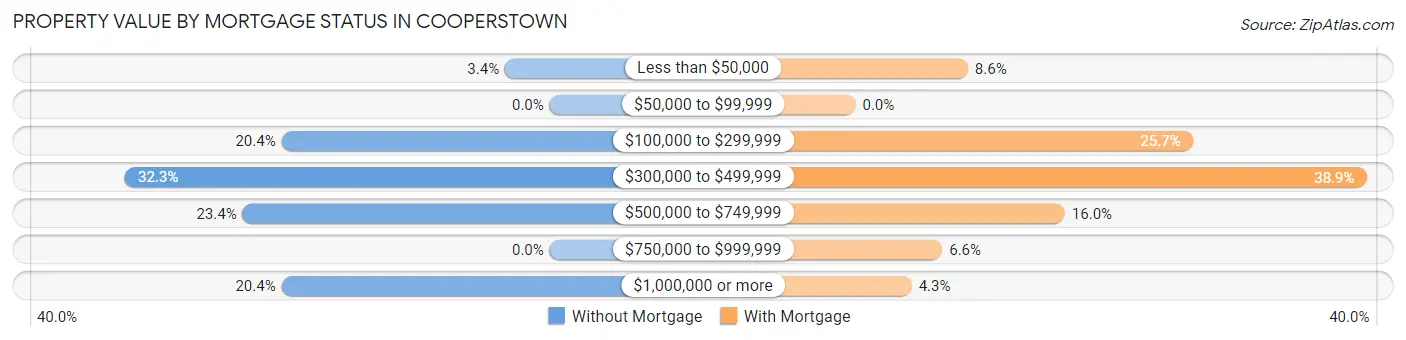
| Property Value | Without Mortgage | With Mortgage |
| Less than $50,000 | 8 (3.4%) | 22 (8.6%) |
| $50,000 to $99,999 | 0 (0.0%) | 0 (0.0%) |
| $100,000 to $299,999 | 48 (20.4%) | 66 (25.7%) |
| $300,000 to $499,999 | 76 (32.3%) | 100 (38.9%) |
| $500,000 to $749,999 | 55 (23.4%) | 41 (16.0%) |
| $750,000 to $999,999 | 0 (0.0%) | 17 (6.6%) |
| $1,000,000 or more | 48 (20.4%) | 11 (4.3%) |
| Total | 235 (100.0%) | 257 (100.0%) |
Household Income by Mortgage Status in Cooperstown
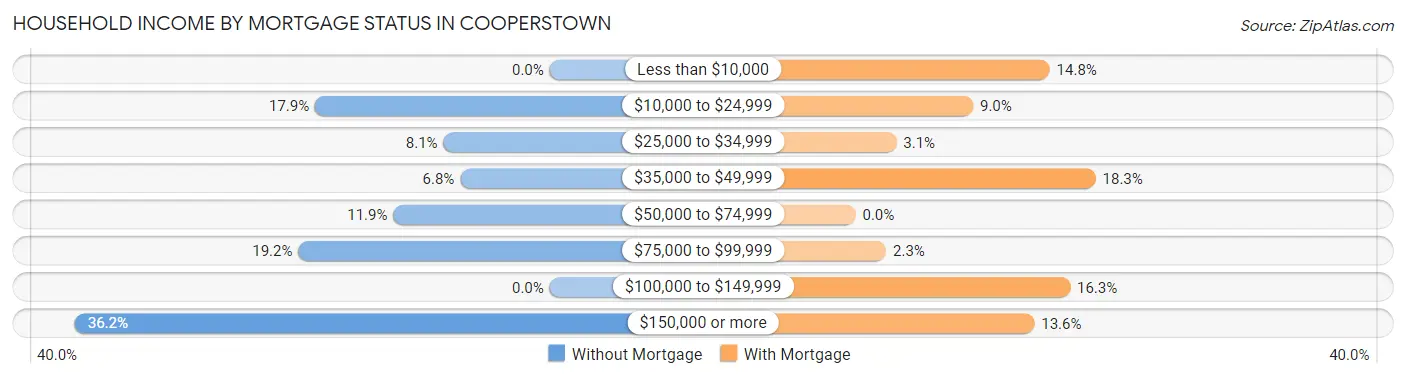
| Household Income | Without Mortgage | With Mortgage |
| Less than $10,000 | 0 (0.0%) | 38 (14.8%) |
| $10,000 to $24,999 | 42 (17.9%) | 23 (8.9%) |
| $25,000 to $34,999 | 19 (8.1%) | 8 (3.1%) |
| $35,000 to $49,999 | 16 (6.8%) | 47 (18.3%) |
| $50,000 to $74,999 | 28 (11.9%) | 0 (0.0%) |
| $75,000 to $99,999 | 45 (19.2%) | 6 (2.3%) |
| $100,000 to $149,999 | 0 (0.0%) | 42 (16.3%) |
| $150,000 or more | 85 (36.2%) | 35 (13.6%) |
| Total | 235 (100.0%) | 257 (100.0%) |
Property Value to Household Income Ratio in Cooperstown
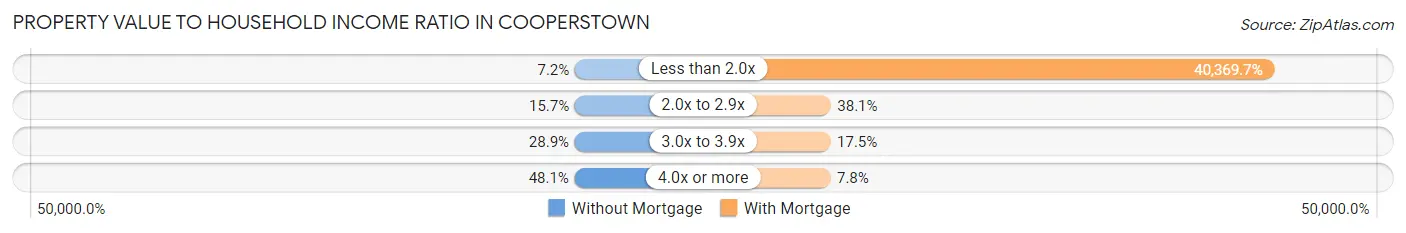
| Value-to-Income Ratio | Without Mortgage | With Mortgage |
| Less than 2.0x | 17 (7.2%) | 103,750 (40,369.7%) |
| 2.0x to 2.9x | 37 (15.7%) | 98 (38.1%) |
| 3.0x to 3.9x | 68 (28.9%) | 45 (17.5%) |
| 4.0x or more | 113 (48.1%) | 20 (7.8%) |
| Total | 235 (100.0%) | 257 (100.0%) |
Real Estate Taxes by Mortgage Status in Cooperstown
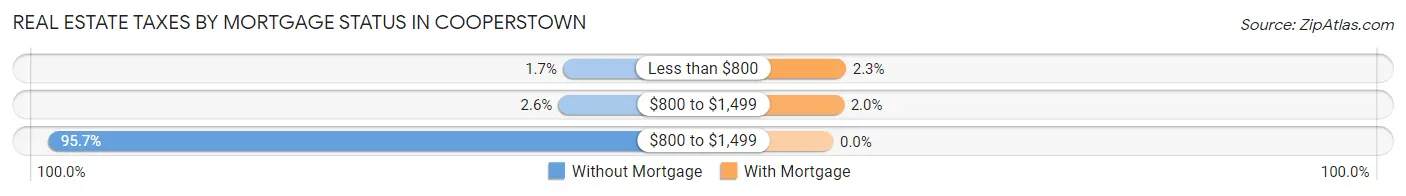
| Property Taxes | Without Mortgage | With Mortgage |
| Less than $800 | 4 (1.7%) | 6 (2.3%) |
| $800 to $1,499 | 6 (2.5%) | 5 (1.9%) |
| $800 to $1,499 | 225 (95.7%) | 0 (0.0%) |
| Total | 235 (100.0%) | 257 (100.0%) |
Health & Disability in Cooperstown
Health Insurance Coverage by Age in Cooperstown
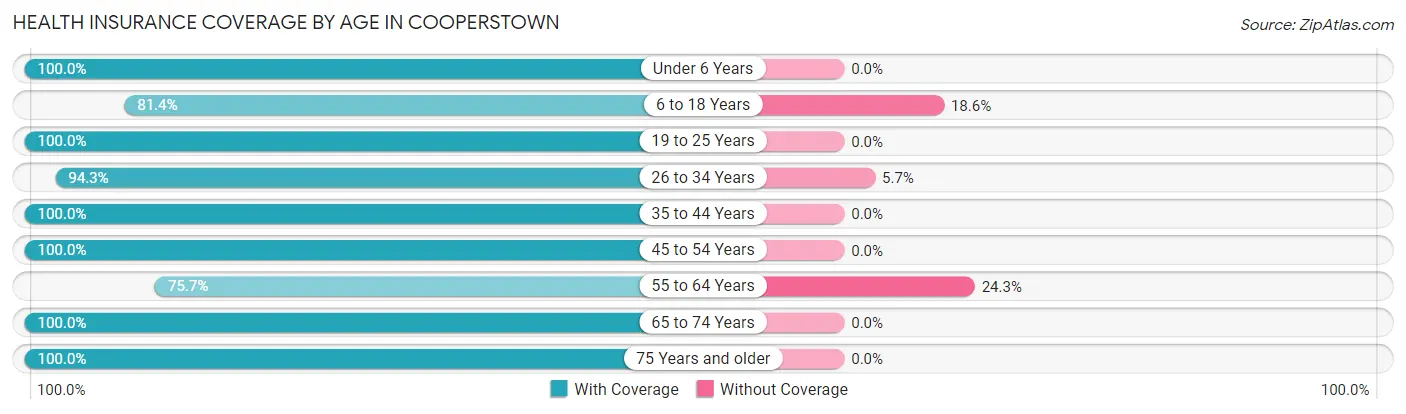
| Age Bracket | With Coverage | Without Coverage |
| Under 6 Years | 42 (100.0%) | 0 (0.0%) |
| 6 to 18 Years | 219 (81.4%) | 50 (18.6%) |
| 19 to 25 Years | 253 (100.0%) | 0 (0.0%) |
| 26 to 34 Years | 279 (94.3%) | 17 (5.7%) |
| 35 to 44 Years | 92 (100.0%) | 0 (0.0%) |
| 45 to 54 Years | 143 (100.0%) | 0 (0.0%) |
| 55 to 64 Years | 196 (75.7%) | 63 (24.3%) |
| 65 to 74 Years | 361 (100.0%) | 0 (0.0%) |
| 75 Years and older | 304 (100.0%) | 0 (0.0%) |
| Total | 1,889 (93.6%) | 130 (6.4%) |
Health Insurance Coverage by Citizenship Status in Cooperstown
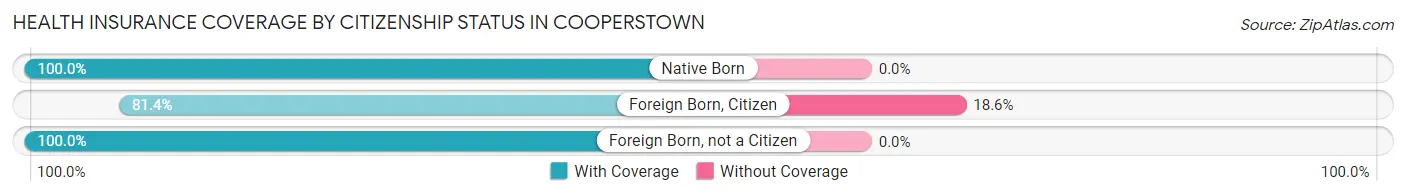
| Citizenship Status | With Coverage | Without Coverage |
| Native Born | 42 (100.0%) | 0 (0.0%) |
| Foreign Born, Citizen | 219 (81.4%) | 50 (18.6%) |
| Foreign Born, not a Citizen | 253 (100.0%) | 0 (0.0%) |
Health Insurance Coverage by Household Income in Cooperstown
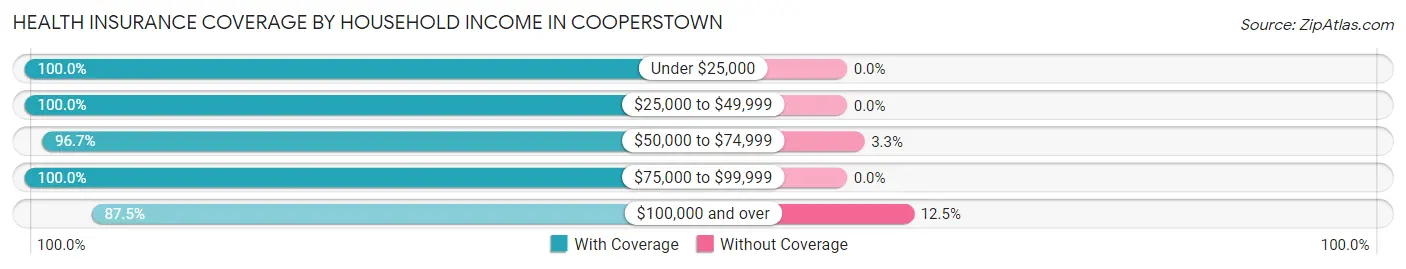
| Household Income | With Coverage | Without Coverage |
| Under $25,000 | 178 (100.0%) | 0 (0.0%) |
| $25,000 to $49,999 | 300 (100.0%) | 0 (0.0%) |
| $50,000 to $74,999 | 148 (96.7%) | 5 (3.3%) |
| $75,000 to $99,999 | 263 (100.0%) | 0 (0.0%) |
| $100,000 and over | 872 (87.5%) | 125 (12.5%) |
Public vs Private Health Insurance Coverage by Age in Cooperstown
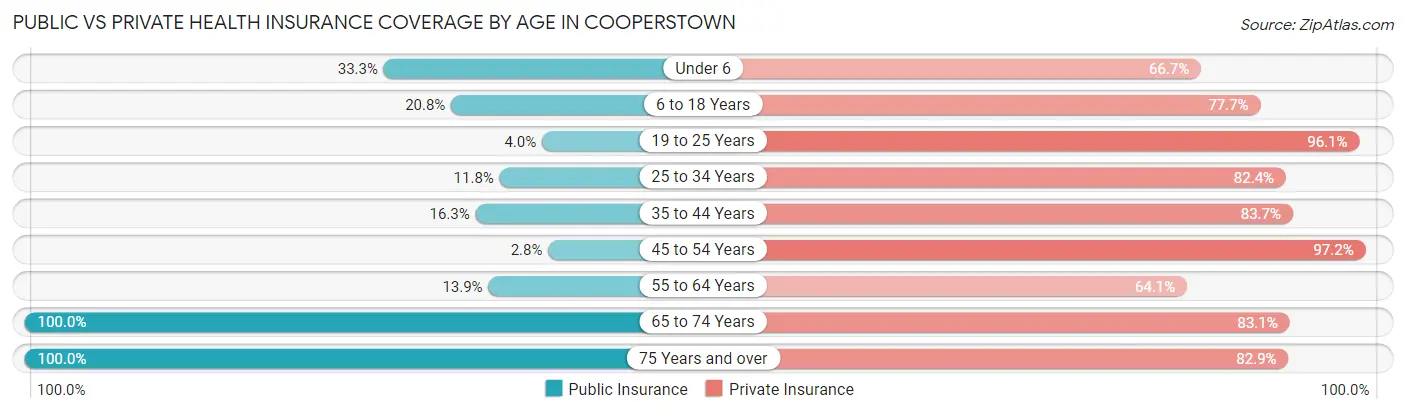
| Age Bracket | Public Insurance | Private Insurance |
| Under 6 | 14 (33.3%) | 28 (66.7%) |
| 6 to 18 Years | 56 (20.8%) | 209 (77.7%) |
| 19 to 25 Years | 10 (4.0%) | 243 (96.1%) |
| 25 to 34 Years | 35 (11.8%) | 244 (82.4%) |
| 35 to 44 Years | 15 (16.3%) | 77 (83.7%) |
| 45 to 54 Years | 4 (2.8%) | 139 (97.2%) |
| 55 to 64 Years | 36 (13.9%) | 166 (64.1%) |
| 65 to 74 Years | 361 (100.0%) | 300 (83.1%) |
| 75 Years and over | 304 (100.0%) | 252 (82.9%) |
| Total | 835 (41.4%) | 1,658 (82.1%) |
Disability Status by Sex by Age in Cooperstown
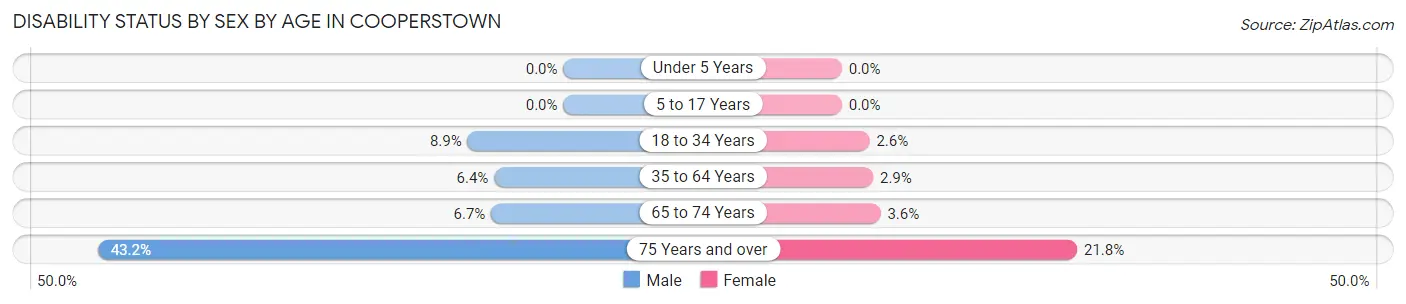
| Age Bracket | Male | Female |
| Under 5 Years | 0 (0.0%) | 0 (0.0%) |
| 5 to 17 Years | 0 (0.0%) | 0 (0.0%) |
| 18 to 34 Years | 28 (8.9%) | 9 (2.6%) |
| 35 to 64 Years | 14 (6.4%) | 8 (2.9%) |
| 65 to 74 Years | 13 (6.7%) | 6 (3.6%) |
| 75 Years and over | 70 (43.2%) | 31 (21.8%) |
Disability Class by Sex by Age in Cooperstown
Disability Class: Hearing Difficulty
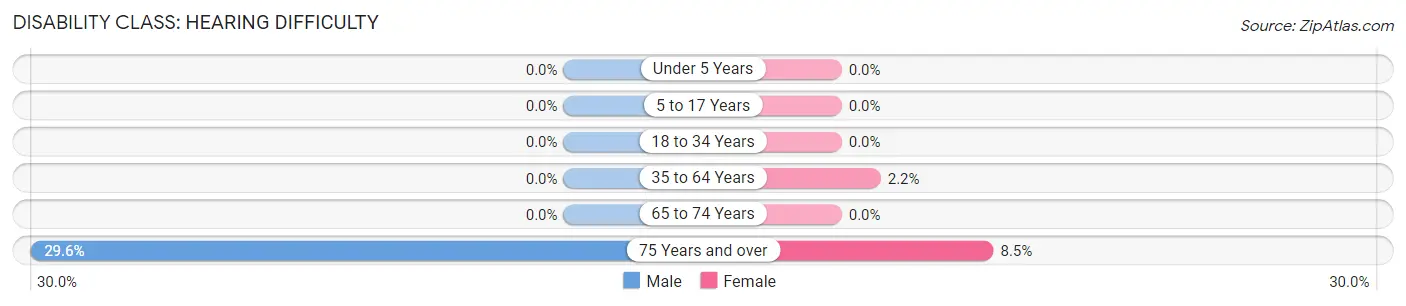
| Age Bracket | Male | Female |
| Under 5 Years | 0 (0.0%) | 0 (0.0%) |
| 5 to 17 Years | 0 (0.0%) | 0 (0.0%) |
| 18 to 34 Years | 0 (0.0%) | 0 (0.0%) |
| 35 to 64 Years | 0 (0.0%) | 6 (2.2%) |
| 65 to 74 Years | 0 (0.0%) | 0 (0.0%) |
| 75 Years and over | 48 (29.6%) | 12 (8.5%) |
Disability Class: Vision Difficulty
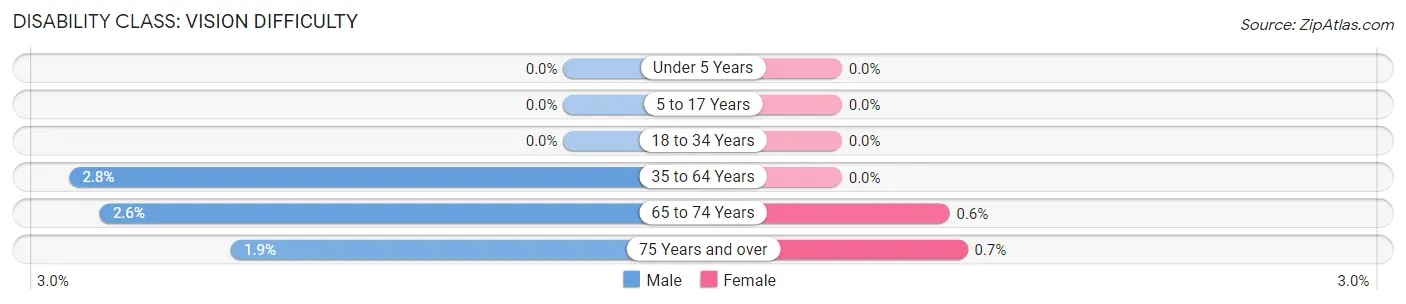
| Age Bracket | Male | Female |
| Under 5 Years | 0 (0.0%) | 0 (0.0%) |
| 5 to 17 Years | 0 (0.0%) | 0 (0.0%) |
| 18 to 34 Years | 0 (0.0%) | 0 (0.0%) |
| 35 to 64 Years | 6 (2.8%) | 0 (0.0%) |
| 65 to 74 Years | 5 (2.6%) | 1 (0.6%) |
| 75 Years and over | 3 (1.8%) | 1 (0.7%) |
Disability Class: Cognitive Difficulty
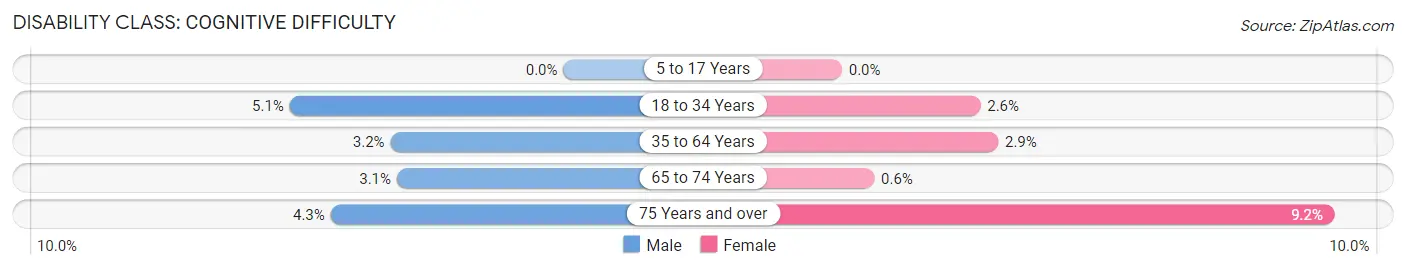
| Age Bracket | Male | Female |
| 5 to 17 Years | 0 (0.0%) | 0 (0.0%) |
| 18 to 34 Years | 16 (5.1%) | 9 (2.6%) |
| 35 to 64 Years | 7 (3.2%) | 8 (2.9%) |
| 65 to 74 Years | 6 (3.1%) | 1 (0.6%) |
| 75 Years and over | 7 (4.3%) | 13 (9.1%) |
Disability Class: Ambulatory Difficulty
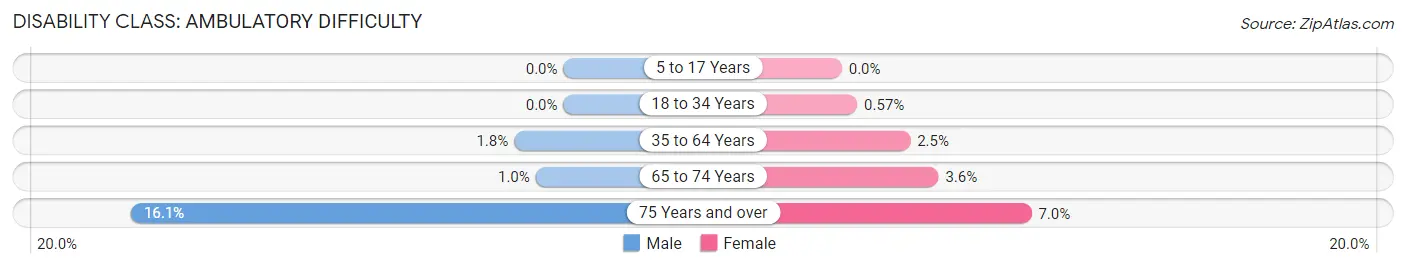
| Age Bracket | Male | Female |
| 5 to 17 Years | 0 (0.0%) | 0 (0.0%) |
| 18 to 34 Years | 0 (0.0%) | 2 (0.6%) |
| 35 to 64 Years | 4 (1.8%) | 7 (2.5%) |
| 65 to 74 Years | 2 (1.0%) | 6 (3.6%) |
| 75 Years and over | 26 (16.1%) | 10 (7.0%) |
Disability Class: Self-Care Difficulty
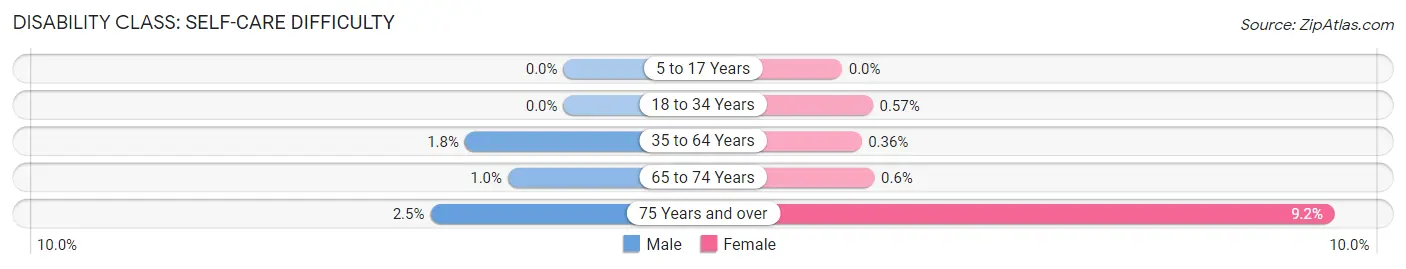
| Age Bracket | Male | Female |
| 5 to 17 Years | 0 (0.0%) | 0 (0.0%) |
| 18 to 34 Years | 0 (0.0%) | 2 (0.6%) |
| 35 to 64 Years | 4 (1.8%) | 1 (0.4%) |
| 65 to 74 Years | 2 (1.0%) | 1 (0.6%) |
| 75 Years and over | 4 (2.5%) | 13 (9.1%) |
Technology Access in Cooperstown
Computing Device Access in Cooperstown
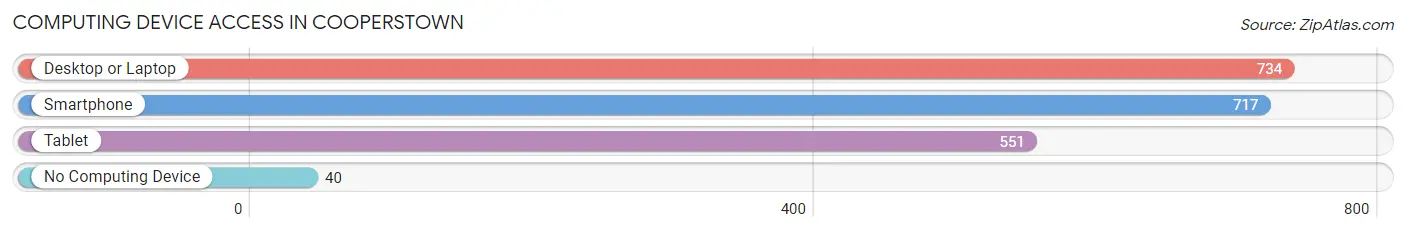
| Device Type | # Households | % Households |
| Desktop or Laptop | 734 | 86.3% |
| Smartphone | 717 | 84.3% |
| Tablet | 551 | 64.7% |
| No Computing Device | 40 | 4.7% |
| Total | 851 | 100.0% |
Internet Access in Cooperstown
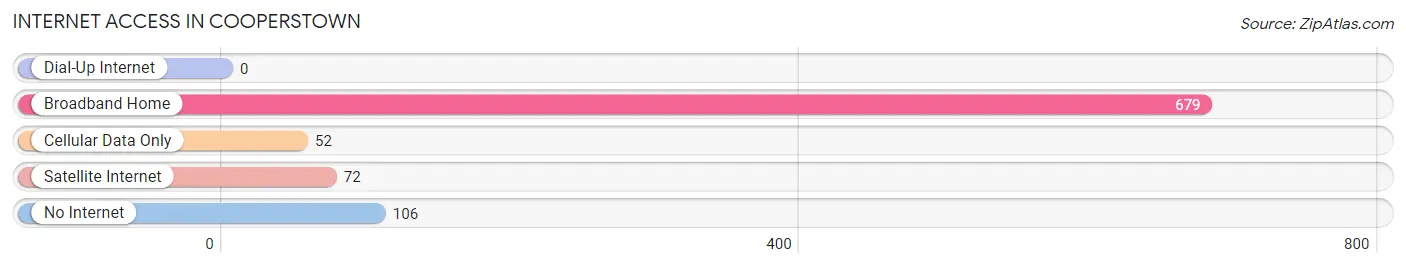
| Internet Type | # Households | % Households |
| Dial-Up Internet | 0 | 0.0% |
| Broadband Home | 679 | 79.8% |
| Cellular Data Only | 52 | 6.1% |
| Satellite Internet | 72 | 8.5% |
| No Internet | 106 | 12.5% |
| Total | 851 | 100.0% |
Cooperstown Summary
Cooperstown, NY is a small village located in Otsego County, New York. It is situated in the foothills of the Catskill Mountains, about 30 miles south of Utica and 90 miles west of Albany. The village is best known as the home of the National Baseball Hall of Fame and Museum, which opened in 1939.
History
Cooperstown was founded in 1786 by William Cooper, a Revolutionary War veteran and father of the famous writer James Fenimore Cooper. The village was originally called Otsego, after the nearby lake, but was later renamed Cooperstown in honor of its founder.
The village grew slowly in the 19th century, but began to experience a surge in population in the early 20th century, when the National Baseball Hall of Fame and Museum opened. The museum was established to honor the game of baseball and its greatest players, and it quickly became a popular tourist destination.
Geography
Cooperstown is located in the foothills of the Catskill Mountains, about 30 miles south of Utica and 90 miles west of Albany. The village is situated on the banks of Otsego Lake, which is the source of the Susquehanna River. The village is surrounded by rolling hills and forests, and is home to several parks and nature preserves.
The climate in Cooperstown is humid continental, with cold winters and warm summers. The average annual temperature is around 50°F (10°C), and the average annual precipitation is around 40 inches (102 cm).
Economy
The economy of Cooperstown is largely based on tourism. The village is home to the National Baseball Hall of Fame and Museum, which attracts thousands of visitors each year. The village also has several other attractions, including the Fenimore Art Museum, the Farmers' Museum, and the Glimmerglass Opera.
In addition to tourism, Cooperstown is home to several small businesses, including restaurants, shops, and galleries. The village also has a thriving agricultural sector, with several farms producing dairy products, fruits, and vegetables.
Demographics
As of the 2010 census, the population of Cooperstown was 1,852. The racial makeup of the village was 95.3% White, 0.9% African American, 0.3% Native American, 0.7% Asian, 0.1% Pacific Islander, and 2.7% from other races. The median household income was $45,938, and the median family income was $54,844.
Cooperstown is a small village with a rich history and a vibrant culture. It is home to the National Baseball Hall of Fame and Museum, as well as several other attractions. The village has a thriving economy based on tourism and agriculture, and its population is diverse and welcoming.
Common Questions
What is Per Capita Income in Cooperstown?
Per Capita income in Cooperstown is $56,348.
What is the Median Family Income in Cooperstown?
Median Family Income in Cooperstown is $109,688.
What is the Median Household income in Cooperstown?
Median Household Income in Cooperstown is $80,139.
What is Income or Wage Gap in Cooperstown?
Income or Wage Gap in Cooperstown is 12.0%.
Women in Cooperstown earn 88.0 cents for every dollar earned by a man.
What is Inequality or Gini Index in Cooperstown?
Inequality or Gini Index in Cooperstown is 0.53.
What is the Total Population of Cooperstown?
Total Population of Cooperstown is 2,034.
What is the Total Male Population of Cooperstown?
Total Male Population of Cooperstown is 1,016.
What is the Total Female Population of Cooperstown?
Total Female Population of Cooperstown is 1,018.
What is the Ratio of Males per 100 Females in Cooperstown?
There are 99.80 Males per 100 Females in Cooperstown.
What is the Ratio of Females per 100 Males in Cooperstown?
There are 100.20 Females per 100 Males in Cooperstown.
What is the Median Population Age in Cooperstown?
Median Population Age in Cooperstown is 50.7 Years.
What is the Average Family Size in Cooperstown
Average Family Size in Cooperstown is 3.0 People.
What is the Average Household Size in Cooperstown
Average Household Size in Cooperstown is 2.2 People.
How Large is the Labor Force in Cooperstown?
There are 1,017 People in the Labor Forcein in Cooperstown.
What is the Percentage of People in the Labor Force in Cooperstown?
54.7% of People are in the Labor Force in Cooperstown.
What is the Unemployment Rate in Cooperstown?
Unemployment Rate in Cooperstown is 5.5%.