Cities with the Largest Pakistani Community in New York
RELATED REPORTS & OPTIONS
Pakistani
New York
Compare Cities
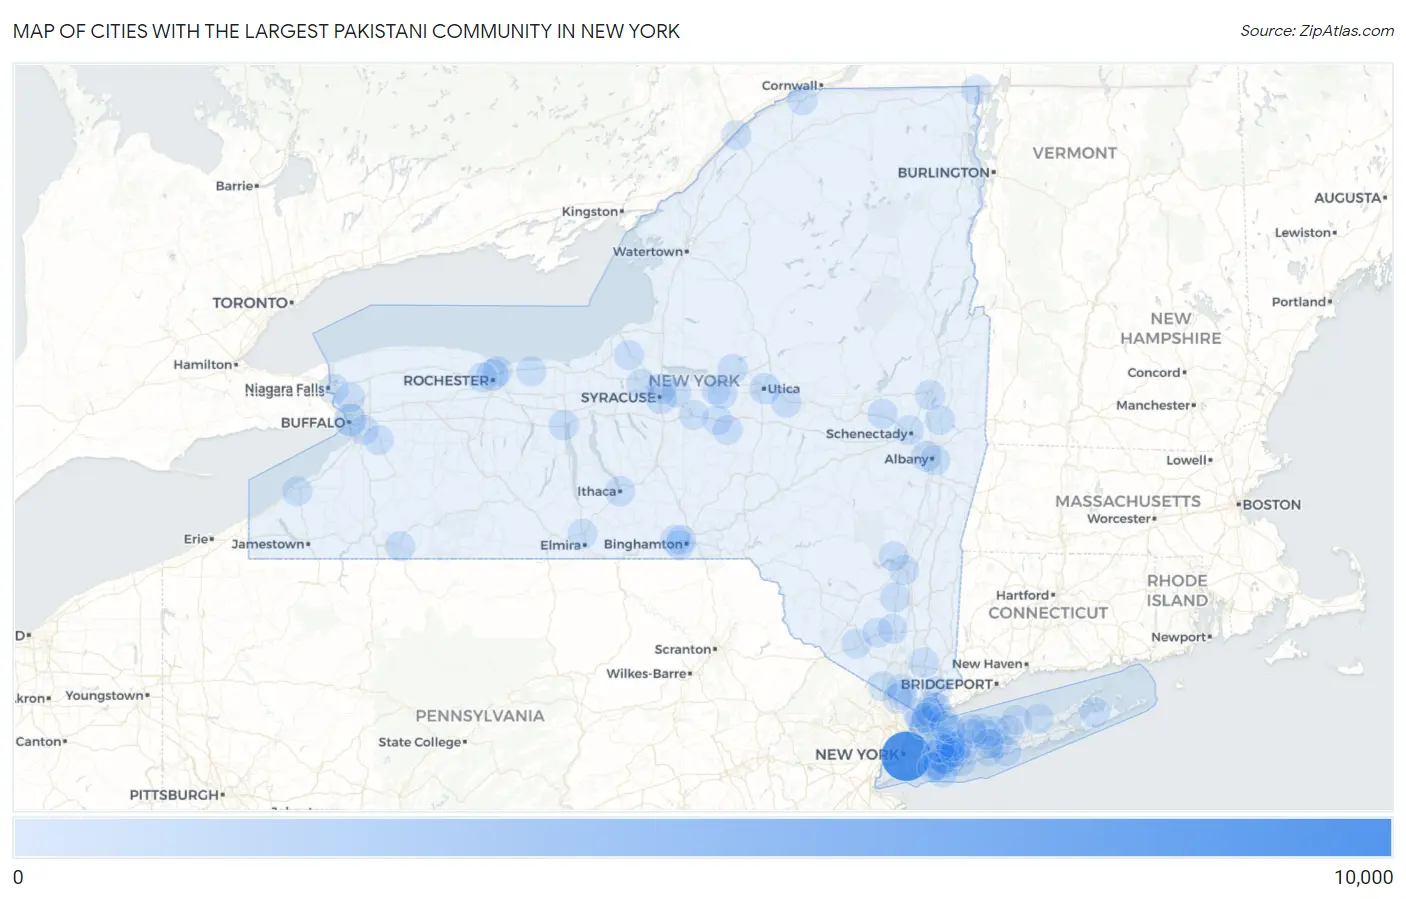
Map of Cities with the Largest Pakistani Community in New York
0
10,000
Cities with the Largest Pakistani Community in New York
| City | Pakistani | vs State | vs National | |
| 1. | New York | 8,894 | 17,192(51.73%)#1 | 321,133(2.77%)#2 |
| 2. | Buffalo | 979 | 17,192(5.69%)#2 | 321,133(0.30%)#26 |
| 3. | Rochester | 776 | 17,192(4.51%)#3 | 321,133(0.24%)#39 |
| 4. | Utica | 509 | 17,192(2.96%)#4 | 321,133(0.16%)#74 |
| 5. | Syracuse | 372 | 17,192(2.16%)#5 | 321,133(0.12%)#111 |
| 6. | Yonkers | 305 | 17,192(1.77%)#6 | 321,133(0.09%)#139 |
| 7. | Albany | 301 | 17,192(1.75%)#7 | 321,133(0.09%)#143 |
| 8. | Mount Vernon | 172 | 17,192(1.00%)#8 | 321,133(0.05%)#335 |
| 9. | Central Islip | 171 | 17,192(0.99%)#9 | 321,133(0.05%)#343 |
| 10. | Levittown | 153 | 17,192(0.89%)#10 | 321,133(0.05%)#384 |
| 11. | Ilion | 139 | 17,192(0.81%)#11 | 321,133(0.04%)#440 |
| 12. | New Rochelle | 138 | 17,192(0.80%)#12 | 321,133(0.04%)#443 |
| 13. | White Plains | 113 | 17,192(0.66%)#13 | 321,133(0.04%)#551 |
| 14. | Ithaca | 112 | 17,192(0.65%)#14 | 321,133(0.03%)#563 |
| 15. | Smithtown | 111 | 17,192(0.65%)#15 | 321,133(0.03%)#566 |
| 16. | Amsterdam | 111 | 17,192(0.65%)#16 | 321,133(0.03%)#568 |
| 17. | Mattydale | 102 | 17,192(0.59%)#17 | 321,133(0.03%)#616 |
| 18. | Carle Place | 99 | 17,192(0.58%)#18 | 321,133(0.03%)#640 |
| 19. | Geneva | 95 | 17,192(0.55%)#19 | 321,133(0.03%)#664 |
| 20. | Baldwin | 90 | 17,192(0.52%)#20 | 321,133(0.03%)#698 |
| 21. | Roessleville | 86 | 17,192(0.50%)#21 | 321,133(0.03%)#724 |
| 22. | Gananda | 77 | 17,192(0.45%)#22 | 321,133(0.02%)#813 |
| 23. | Sherrill | 76 | 17,192(0.44%)#23 | 321,133(0.02%)#824 |
| 24. | Seaford | 70 | 17,192(0.41%)#24 | 321,133(0.02%)#877 |
| 25. | Village Green | 65 | 17,192(0.38%)#25 | 321,133(0.02%)#919 |
| 26. | Endwell | 64 | 17,192(0.37%)#26 | 321,133(0.02%)#928 |
| 27. | Rockville Centre | 58 | 17,192(0.34%)#27 | 321,133(0.02%)#1,018 |
| 28. | Rensselaer | 55 | 17,192(0.32%)#28 | 321,133(0.02%)#1,047 |
| 29. | Greenville Cdp Westchester County | 51 | 17,192(0.30%)#29 | 321,133(0.02%)#1,107 |
| 30. | Hicksville | 46 | 17,192(0.27%)#30 | 321,133(0.01%)#1,197 |
| 31. | Munsey Park | 46 | 17,192(0.27%)#31 | 321,133(0.01%)#1,215 |
| 32. | West Sayville | 44 | 17,192(0.26%)#32 | 321,133(0.01%)#1,249 |
| 33. | Irondequoit | 40 | 17,192(0.23%)#33 | 321,133(0.01%)#1,324 |
| 34. | Noyack | 40 | 17,192(0.23%)#34 | 321,133(0.01%)#1,344 |
| 35. | Elmont | 38 | 17,192(0.22%)#35 | 321,133(0.01%)#1,375 |
| 36. | Woodmere | 38 | 17,192(0.22%)#36 | 321,133(0.01%)#1,385 |
| 37. | New Square | 35 | 17,192(0.20%)#37 | 321,133(0.01%)#1,466 |
| 38. | Plainview | 34 | 17,192(0.20%)#38 | 321,133(0.01%)#1,477 |
| 39. | Fulton | 34 | 17,192(0.20%)#39 | 321,133(0.01%)#1,487 |
| 40. | New Paltz | 32 | 17,192(0.19%)#40 | 321,133(0.01%)#1,550 |
| 41. | Minoa | 31 | 17,192(0.18%)#41 | 321,133(0.01%)#1,577 |
| 42. | North Gates | 29 | 17,192(0.17%)#42 | 321,133(0.01%)#1,632 |
| 43. | Uniondale | 28 | 17,192(0.16%)#43 | 321,133(0.01%)#1,651 |
| 44. | East Northport | 28 | 17,192(0.16%)#44 | 321,133(0.01%)#1,661 |
| 45. | Mount Sinai | 27 | 17,192(0.16%)#45 | 321,133(0.01%)#1,686 |
| 46. | Old Westbury | 27 | 17,192(0.16%)#46 | 321,133(0.01%)#1,694 |
| 47. | Bay Shore | 26 | 17,192(0.15%)#47 | 321,133(0.01%)#1,713 |
| 48. | Garden City Park | 26 | 17,192(0.15%)#48 | 321,133(0.01%)#1,726 |
| 49. | Shrub Oak | 26 | 17,192(0.15%)#49 | 321,133(0.01%)#1,736 |
| 50. | West Seneca | 25 | 17,192(0.15%)#50 | 321,133(0.01%)#1,741 |
| 51. | Armonk | 24 | 17,192(0.14%)#51 | 321,133(0.01%)#1,805 |
| 52. | Rouses Point | 24 | 17,192(0.14%)#52 | 321,133(0.01%)#1,811 |
| 53. | Niagara Falls | 22 | 17,192(0.13%)#53 | 321,133(0.01%)#1,864 |
| 54. | Centereach | 22 | 17,192(0.13%)#54 | 321,133(0.01%)#1,871 |
| 55. | Kingston | 22 | 17,192(0.13%)#55 | 321,133(0.01%)#1,875 |
| 56. | Hastings On Hudson | 22 | 17,192(0.13%)#56 | 321,133(0.01%)#1,892 |
| 57. | Hewlett | 22 | 17,192(0.13%)#57 | 321,133(0.01%)#1,895 |
| 58. | Mechanicville | 22 | 17,192(0.13%)#58 | 321,133(0.01%)#1,898 |
| 59. | Zena | 21 | 17,192(0.12%)#59 | 321,133(0.01%)#1,935 |
| 60. | Saratoga Springs | 20 | 17,192(0.12%)#60 | 321,133(0.01%)#1,952 |
| 61. | Wading River | 20 | 17,192(0.12%)#61 | 321,133(0.01%)#1,972 |
| 62. | Lakeview | 20 | 17,192(0.12%)#62 | 321,133(0.01%)#1,974 |
| 63. | Scotia | 19 | 17,192(0.11%)#63 | 321,133(0.01%)#2,012 |
| 64. | Commack | 18 | 17,192(0.10%)#64 | 321,133(0.01%)#2,032 |
| 65. | Middletown | 17 | 17,192(0.10%)#65 | 321,133(0.01%)#2,077 |
| 66. | Long Beach | 16 | 17,192(0.09%)#66 | 321,133(0.00%)#2,128 |
| 67. | Scarsdale | 15 | 17,192(0.09%)#67 | 321,133(0.00%)#2,195 |
| 68. | Westbury | 15 | 17,192(0.09%)#68 | 321,133(0.00%)#2,198 |
| 69. | Inwood | 15 | 17,192(0.09%)#69 | 321,133(0.00%)#2,206 |
| 70. | Binghamton University | 15 | 17,192(0.09%)#70 | 321,133(0.00%)#2,214 |
| 71. | Ontario | 15 | 17,192(0.09%)#71 | 321,133(0.00%)#2,224 |
| 72. | Rye | 14 | 17,192(0.08%)#72 | 321,133(0.00%)#2,252 |
| 73. | Chestnut Ridge | 13 | 17,192(0.08%)#73 | 321,133(0.00%)#2,310 |
| 74. | Manhasset Hills | 13 | 17,192(0.08%)#74 | 321,133(0.00%)#2,323 |
| 75. | Huntington Station | 12 | 17,192(0.07%)#75 | 321,133(0.00%)#2,346 |
| 76. | Rome | 12 | 17,192(0.07%)#76 | 321,133(0.00%)#2,348 |
| 77. | Oneida | 12 | 17,192(0.07%)#77 | 321,133(0.00%)#2,369 |
| 78. | Morrisville | 12 | 17,192(0.07%)#78 | 321,133(0.00%)#2,397 |
| 79. | Brentwood | 11 | 17,192(0.06%)#79 | 321,133(0.00%)#2,409 |
| 80. | Glen Cove | 11 | 17,192(0.06%)#80 | 321,133(0.00%)#2,424 |
| 81. | Eastchester | 11 | 17,192(0.06%)#81 | 321,133(0.00%)#2,434 |
| 82. | Olean | 11 | 17,192(0.06%)#82 | 321,133(0.00%)#2,439 |
| 83. | East Aurora | 11 | 17,192(0.06%)#83 | 321,133(0.00%)#2,456 |
| 84. | North Tonawanda | 10 | 17,192(0.06%)#84 | 321,133(0.00%)#2,497 |
| 85. | Nanuet | 10 | 17,192(0.06%)#85 | 321,133(0.00%)#2,506 |
| 86. | Massena | 10 | 17,192(0.06%)#86 | 321,133(0.00%)#2,514 |
| 87. | Ogdensburg | 10 | 17,192(0.06%)#87 | 321,133(0.00%)#2,516 |
| 88. | Horseheads | 10 | 17,192(0.06%)#88 | 321,133(0.00%)#2,527 |
| 89. | Hamilton | 10 | 17,192(0.06%)#89 | 321,133(0.00%)#2,537 |
| 90. | Sloatsburg | 10 | 17,192(0.06%)#90 | 321,133(0.00%)#2,541 |
| 91. | Cazenovia | 10 | 17,192(0.06%)#91 | 321,133(0.00%)#2,543 |
| 92. | Montgomery | 9 | 17,192(0.05%)#92 | 321,133(0.00%)#2,615 |
| 93. | Locust Valley | 9 | 17,192(0.05%)#93 | 321,133(0.00%)#2,617 |
| 94. | Varna | 9 | 17,192(0.05%)#94 | 321,133(0.00%)#2,637 |
| 95. | East Meadow | 8 | 17,192(0.05%)#95 | 321,133(0.00%)#2,647 |
| 96. | Harrison | 8 | 17,192(0.05%)#96 | 321,133(0.00%)#2,653 |
| 97. | Huntington | 8 | 17,192(0.05%)#97 | 321,133(0.00%)#2,663 |
| 98. | Johnson City | 8 | 17,192(0.05%)#98 | 321,133(0.00%)#2,671 |
| 99. | Orange Lake | 8 | 17,192(0.05%)#99 | 321,133(0.00%)#2,680 |
| 100. | Fredonia | 8 | 17,192(0.05%)#100 | 321,133(0.00%)#2,682 |
Common Questions
What are the Top 10 Cities with the Largest Pakistani Community in New York?
Top 10 Cities with the Largest Pakistani Community in New York are:
#1
8,894
#2
979
#3
776
#4
509
#5
372
#6
305
#7
301
#8
172
#9
171
#10
153
What city has the Largest Pakistani Community in New York?
New York has the Largest Pakistani Community in New York with 8,894.
What is the Total Pakistani Population in the State of New York?
Total Pakistani Population in New York is 17,192.
What is the Total Pakistani Population in the United States?
Total Pakistani Population in the United States is 321,133.