Cities with the Highest Percentage of Immigrants from Ecuador in New York
RELATED REPORTS & OPTIONS
Ecuador
New York
Compare Cities
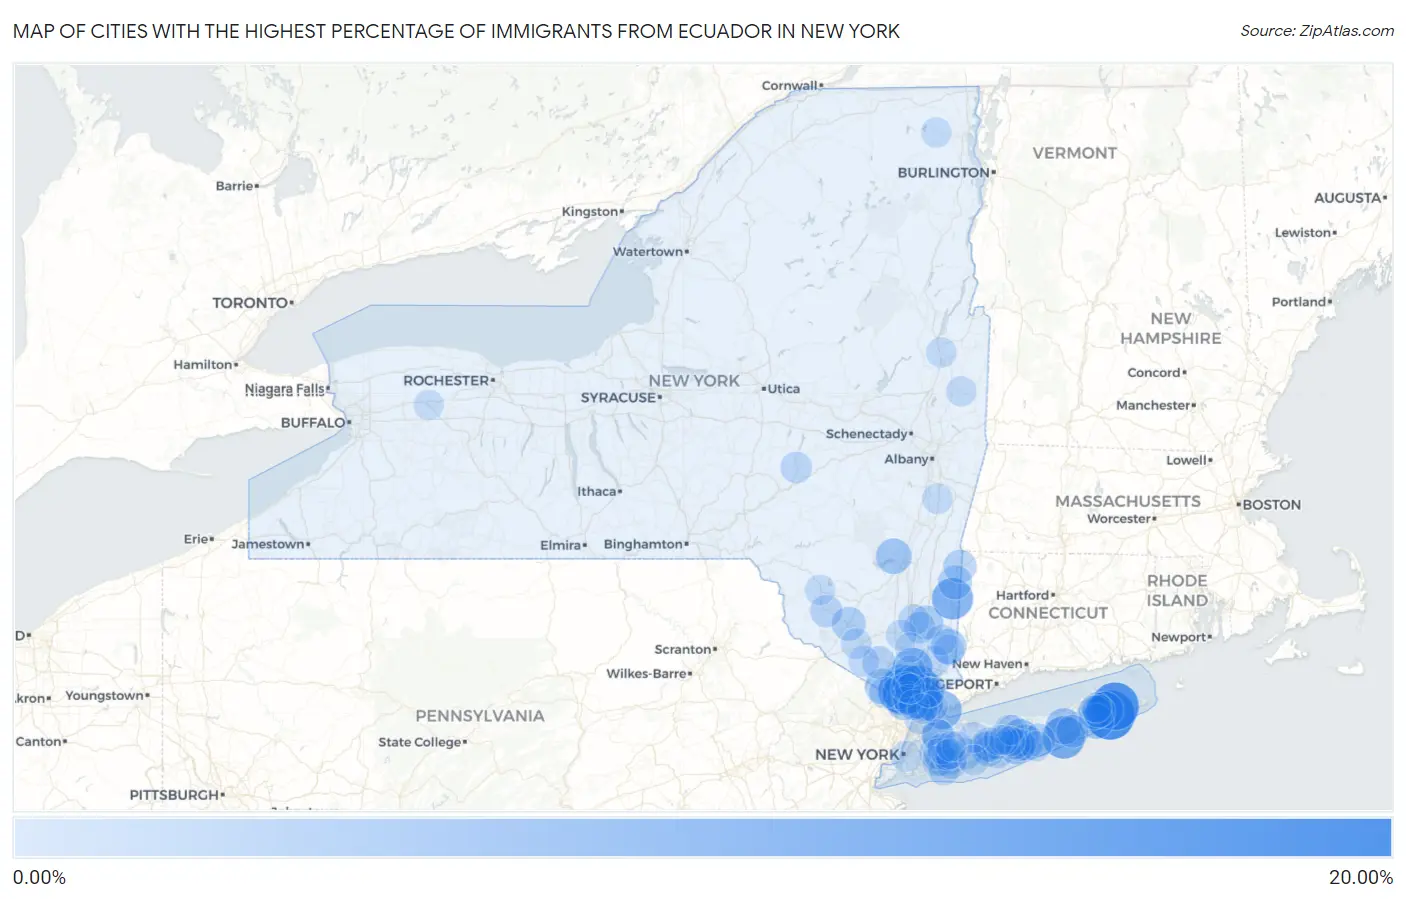
Map of Cities with the Highest Percentage of Immigrants from Ecuador in New York
0.00%
20.00%
Cities with the Highest Percentage of Immigrants from Ecuador in New York
| City | Ecuador | vs State | vs National | |
| 1. | East Hampton North | 16.50% | 0.89%(+15.6)#13 | 0.15%(+16.4)#3,010 |
| 2. | Springs | 15.03% | 0.89%(+14.1)#327 | 0.15%(+14.9)#12,166 |
| 3. | Hillcrest | 11.54% | 0.89%(+10.7)#328 | 0.15%(+11.4)#12,167 |
| 4. | Quogue | 10.62% | 0.89%(+9.74)#329 | 0.15%(+10.5)#12,168 |
| 5. | Sleepy Hollow | 10.28% | 0.89%(+9.40)#330 | 0.15%(+10.1)#12,169 |
| 6. | Ossining | 9.66% | 0.89%(+8.77)#331 | 0.15%(+9.52)#12,170 |
| 7. | Dover Plains | 9.62% | 0.89%(+8.73)#332 | 0.15%(+9.47)#12,171 |
| 8. | Nanuet | 8.60% | 0.89%(+7.71)#333 | 0.15%(+8.45)#12,172 |
| 9. | Peekskill | 8.23% | 0.89%(+7.34)#334 | 0.15%(+8.09)#12,173 |
| 10. | Port Chester | 7.37% | 0.89%(+6.49)#335 | 0.15%(+7.23)#12,174 |
| 11. | Medford | 6.29% | 0.89%(+5.40)#336 | 0.15%(+6.14)#12,175 |
| 12. | Northwest Harbor | 6.04% | 0.89%(+5.15)#337 | 0.15%(+5.89)#12,176 |
| 13. | Elmsford | 5.89% | 0.89%(+5.01)#338 | 0.15%(+5.75)#12,177 |
| 14. | Flanders | 5.52% | 0.89%(+4.63)#339 | 0.15%(+5.38)#12,178 |
| 15. | Patchogue | 5.42% | 0.89%(+4.53)#340 | 0.15%(+5.27)#12,179 |
| 16. | North Bellport | 5.33% | 0.89%(+4.44)#341 | 0.15%(+5.18)#12,180 |
| 17. | Zena | 5.10% | 0.89%(+4.21)#342 | 0.15%(+4.95)#12,181 |
| 18. | Fairview Cdp Westchester County | 4.90% | 0.89%(+4.02)#343 | 0.15%(+4.76)#12,182 |
| 19. | Brewster Hill | 4.75% | 0.89%(+3.86)#344 | 0.15%(+4.61)#12,183 |
| 20. | Sloatsburg | 4.74% | 0.89%(+3.85)#345 | 0.15%(+4.59)#12,184 |
| 21. | Bridgehampton | 4.72% | 0.89%(+3.84)#346 | 0.15%(+4.58)#12,185 |
| 22. | Pearl River | 4.69% | 0.89%(+3.81)#347 | 0.15%(+4.55)#12,186 |
| 23. | Pleasantville | 4.09% | 0.89%(+3.20)#348 | 0.15%(+3.95)#12,187 |
| 24. | Mount Ivy | 4.05% | 0.89%(+3.16)#349 | 0.15%(+3.90)#12,188 |
| 25. | Hopewell Junction | 3.76% | 0.89%(+2.87)#350 | 0.15%(+3.62)#12,189 |
| 26. | Noyack | 3.75% | 0.89%(+2.86)#351 | 0.15%(+3.61)#12,190 |
| 27. | Amenia | 3.73% | 0.89%(+2.84)#352 | 0.15%(+3.59)#12,191 |
| 28. | Wurtsboro | 3.61% | 0.89%(+2.72)#353 | 0.15%(+3.47)#12,192 |
| 29. | Bellerose | 3.50% | 0.89%(+2.62)#354 | 0.15%(+3.36)#12,193 |
| 30. | Spring Valley | 3.45% | 0.89%(+2.56)#355 | 0.15%(+3.30)#12,194 |
| 31. | Baxter Estates | 3.40% | 0.89%(+2.51)#356 | 0.15%(+3.25)#12,195 |
| 32. | Millerton | 3.13% | 0.89%(+2.24)#357 | 0.15%(+2.99)#12,196 |
| 33. | Moriches | 3.12% | 0.89%(+2.24)#358 | 0.15%(+2.98)#12,197 |
| 34. | Sag Harbor | 2.82% | 0.89%(+1.93)#359 | 0.15%(+2.68)#12,198 |
| 35. | Haverstraw | 2.81% | 0.89%(+1.92)#360 | 0.15%(+2.66)#12,199 |
| 36. | Walton Park | 2.80% | 0.89%(+1.92)#361 | 0.15%(+2.66)#12,200 |
| 37. | Hampton Bays | 2.75% | 0.89%(+1.86)#362 | 0.15%(+2.61)#12,201 |
| 38. | Brentwood | 2.54% | 0.89%(+1.65)#363 | 0.15%(+2.39)#12,202 |
| 39. | Monticello | 2.46% | 0.89%(+1.58)#364 | 0.15%(+2.32)#12,306 |
| 40. | West Nyack | 2.44% | 0.89%(+1.55)#365 | 0.15%(+2.30)#12,307 |
| 41. | East Patchogue | 2.34% | 0.89%(+1.45)#366 | 0.15%(+2.20)#12,308 |
| 42. | Manorhaven | 2.14% | 0.89%(+1.25)#367 | 0.15%(+1.99)#12,309 |
| 43. | Croton On Hudson | 2.04% | 0.89%(+1.15)#368 | 0.15%(+1.89)#12,310 |
| 44. | New Hamburg | 1.95% | 0.89%(+1.07)#369 | 0.15%(+1.81)#12,311 |
| 45. | Milford | 1.95% | 0.89%(+1.06)#370 | 0.15%(+1.80)#12,312 |
| 46. | Hillburn | 1.95% | 0.89%(+1.06)#371 | 0.15%(+1.80)#12,313 |
| 47. | East Islip | 1.88% | 0.89%(+0.991)#372 | 0.15%(+1.73)#12,314 |
| 48. | Brinckerhoff | 1.83% | 0.89%(+0.939)#373 | 0.15%(+1.68)#12,315 |
| 49. | Shenorock | 1.81% | 0.89%(+0.918)#374 | 0.15%(+1.66)#12,316 |
| 50. | Buchanan | 1.80% | 0.89%(+0.917)#375 | 0.15%(+1.66)#12,317 |
| 51. | Wappingers Falls | 1.80% | 0.89%(+0.913)#376 | 0.15%(+1.66)#12,318 |
| 52. | Baywood | 1.75% | 0.89%(+0.866)#377 | 0.15%(+1.61)#12,319 |
| 53. | Malverne | 1.72% | 0.89%(+0.837)#378 | 0.15%(+1.58)#12,320 |
| 54. | North Patchogue | 1.71% | 0.89%(+0.818)#379 | 0.15%(+1.56)#12,321 |
| 55. | Roosevelt | 1.67% | 0.89%(+0.782)#380 | 0.15%(+1.52)#12,322 |
| 56. | Central Islip | 1.63% | 0.89%(+0.742)#381 | 0.15%(+1.48)#12,323 |
| 57. | Yonkers | 1.61% | 0.89%(+0.727)#382 | 0.15%(+1.47)#12,324 |
| 58. | Bay Shore | 1.58% | 0.89%(+0.690)#383 | 0.15%(+1.43)#12,325 |
| 59. | South Farmingdale | 1.58% | 0.89%(+0.690)#384 | 0.15%(+1.43)#12,326 |
| 60. | North Bay Shore | 1.53% | 0.89%(+0.646)#385 | 0.15%(+1.39)#12,327 |
| 61. | Valley Stream | 1.50% | 0.89%(+0.612)#386 | 0.15%(+1.35)#12,328 |
| 62. | New York | 1.46% | 0.89%(+0.573)#387 | 0.15%(+1.32)#12,329 |
| 63. | South Floral Park | 1.45% | 0.89%(+0.565)#388 | 0.15%(+1.31)#12,330 |
| 64. | Brewster | 1.44% | 0.89%(+0.549)#389 | 0.15%(+1.29)#12,331 |
| 65. | Lake Carmel | 1.43% | 0.89%(+0.547)#390 | 0.15%(+1.29)#12,332 |
| 66. | Florida | 1.43% | 0.89%(+0.543)#391 | 0.15%(+1.28)#12,333 |
| 67. | South Huntington | 1.40% | 0.89%(+0.510)#392 | 0.15%(+1.25)#12,334 |
| 68. | Island Park | 1.39% | 0.89%(+0.507)#393 | 0.15%(+1.25)#12,335 |
| 69. | Freeport | 1.39% | 0.89%(+0.501)#394 | 0.15%(+1.24)#12,336 |
| 70. | Middletown | 1.36% | 0.89%(+0.472)#395 | 0.15%(+1.21)#12,337 |
| 71. | New Hackensack | 1.35% | 0.89%(+0.467)#396 | 0.15%(+1.21)#12,338 |
| 72. | Garden City Park | 1.35% | 0.89%(+0.463)#397 | 0.15%(+1.21)#12,339 |
| 73. | Newburgh | 1.28% | 0.89%(+0.392)#398 | 0.15%(+1.13)#12,340 |
| 74. | Hempstead | 1.27% | 0.89%(+0.381)#399 | 0.15%(+1.12)#12,341 |
| 75. | Blauvelt | 1.26% | 0.89%(+0.374)#400 | 0.15%(+1.12)#12,342 |
| 76. | Centereach | 1.17% | 0.89%(+0.285)#401 | 0.15%(+1.03)#12,343 |
| 77. | White Plains | 1.16% | 0.89%(+0.270)#402 | 0.15%(+1.01)#12,344 |
| 78. | Hicksville | 1.12% | 0.89%(+0.233)#403 | 0.15%(+0.975)#12,345 |
| 79. | Liberty | 1.11% | 0.89%(+0.226)#404 | 0.15%(+0.968)#12,346 |
| 80. | Kinderhook | 1.11% | 0.89%(+0.223)#405 | 0.15%(+0.965)#12,347 |
| 81. | New City | 1.07% | 0.89%(+0.182)#406 | 0.15%(+0.925)#12,348 |
| 82. | Niagara University | 1.07% | 0.89%(+0.180)#407 | 0.15%(+0.922)#12,349 |
| 83. | Uniondale | 1.05% | 0.89%(+0.158)#408 | 0.15%(+0.900)#12,350 |
| 84. | Selden | 1.04% | 0.89%(+0.151)#409 | 0.15%(+0.893)#12,351 |
| 85. | Islandia | 1.04% | 0.89%(+0.150)#410 | 0.15%(+0.892)#12,352 |
| 86. | Glens Falls North | 1.02% | 0.89%(+0.135)#411 | 0.15%(+0.877)#12,353 |
| 87. | Mastic Beach | 1.01% | 0.89%(+0.119)#412 | 0.15%(+0.862)#12,354 |
| 88. | Copiague | 1.00% | 0.89%(+0.115)#413 | 0.15%(+0.857)#12,355 |
| 89. | Greenwich | 0.99% | 0.89%(+0.102)#414 | 0.15%(+0.844)#12,356 |
| 90. | Dannemora | 0.98% | 0.89%(+0.091)#415 | 0.15%(+0.833)#12,357 |
| 91. | Piermont | 0.96% | 0.89%(+0.070)#416 | 0.15%(+0.812)#12,358 |
| 92. | Holbrook | 0.94% | 0.89%(+0.049)#417 | 0.15%(+0.792)#12,359 |
| 93. | Westbury | 0.91% | 0.89%(+0.025)#418 | 0.15%(+0.767)#12,360 |
| 94. | Thornwood | 0.91% | 0.89%(+0.022)#419 | 0.15%(+0.765)#12,361 |
| 95. | Ardsley | 0.88% | 0.89%(-0.010)#420 | 0.15%(+0.732)#12,362 |
| 96. | North Haven | 0.88% | 0.89%(-0.011)#421 | 0.15%(+0.731)#12,363 |
| 97. | Cold Spring | 0.87% | 0.89%(-0.020)#422 | 0.15%(+0.722)#12,364 |
| 98. | Batavia | 0.84% | 0.89%(-0.043)#423 | 0.15%(+0.699)#12,365 |
| 99. | Congers | 0.82% | 0.89%(-0.063)#424 | 0.15%(+0.679)#12,366 |
| 100. | Ronkonkoma | 0.82% | 0.89%(-0.065)#425 | 0.15%(+0.678)#12,367 |
Common Questions
What are the Top 10 Cities with the Highest Percentage of Immigrants from Ecuador in New York?
Top 10 Cities with the Highest Percentage of Immigrants from Ecuador in New York are:
#1
16.50%
#2
15.03%
#3
11.54%
#4
10.62%
#5
10.28%
#6
9.66%
#7
9.62%
#8
8.60%
#9
8.23%
#10
7.37%
What city has the Highest Percentage of Immigrants from Ecuador in New York?
East Hampton North has the Highest Percentage of Immigrants from Ecuador in New York with 16.50%.
What is the Percentage of Immigrants from Ecuador in the State of New York?
Percentage of Immigrants from Ecuador in New York is 0.89%.
What is the Percentage of Immigrants from Ecuador in the United States?
Percentage of Immigrants from Ecuador in the United States is 0.15%.