North Boston, NY Map & Demographics
North Boston Map
North Boston Overview
$39,925
PER CAPITA INCOME
$104,098
AVG FAMILY INCOME
$56,840
AVG HOUSEHOLD INCOME
30.7%
WAGE / INCOME GAP [ % ]
69.3¢/ $1
WAGE / INCOME GAP [ $ ]
0.38
INEQUALITY / GINI INDEX
2,554
TOTAL POPULATION
1,282
MALE POPULATION
1,272
FEMALE POPULATION
100.79
MALES / 100 FEMALES
99.22
FEMALES / 100 MALES
56.3
MEDIAN AGE
2.6
AVG FAMILY SIZE
1.9
AVG HOUSEHOLD SIZE
1,455
LABOR FORCE [ PEOPLE ]
60.1%
PERCENT IN LABOR FORCE
9.3%
UNEMPLOYMENT RATE
North Boston Area Codes
Income in North Boston
Income Overview in North Boston
Per Capita Income in North Boston is $39,925, while median incomes of families and households are $104,098 and $56,840 respectively.
| Characteristic | Number | Measure |
| Per Capita Income | 2,554 | $39,925 |
| Median Family Income | 694 | $104,098 |
| Mean Family Income | 694 | $105,136 |
| Median Household Income | 1,315 | $56,840 |
| Mean Household Income | 1,315 | $76,657 |
| Income Deficit | 694 | $0 |
| Wage / Income Gap (%) | 2,554 | 30.73% |
| Wage / Income Gap ($) | 2,554 | 69.27¢ per $1 |
| Gini / Inequality Index | 2,554 | 0.38 |
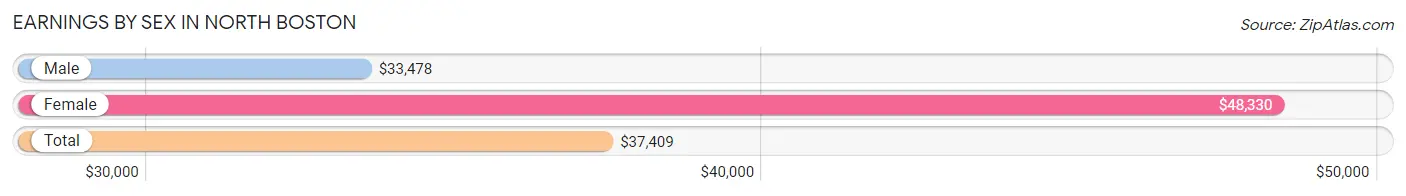
Earnings by Sex in North Boston
Average Earnings in North Boston are $37,409, $33,478 for men and $48,330 for women, a difference of 30.7%.
| Sex | Number | Average Earnings |
| Male | 812 (51.0%) | $33,478 |
| Female | 781 (49.0%) | $48,330 |
| Total | 1,593 (100.0%) | $37,409 |
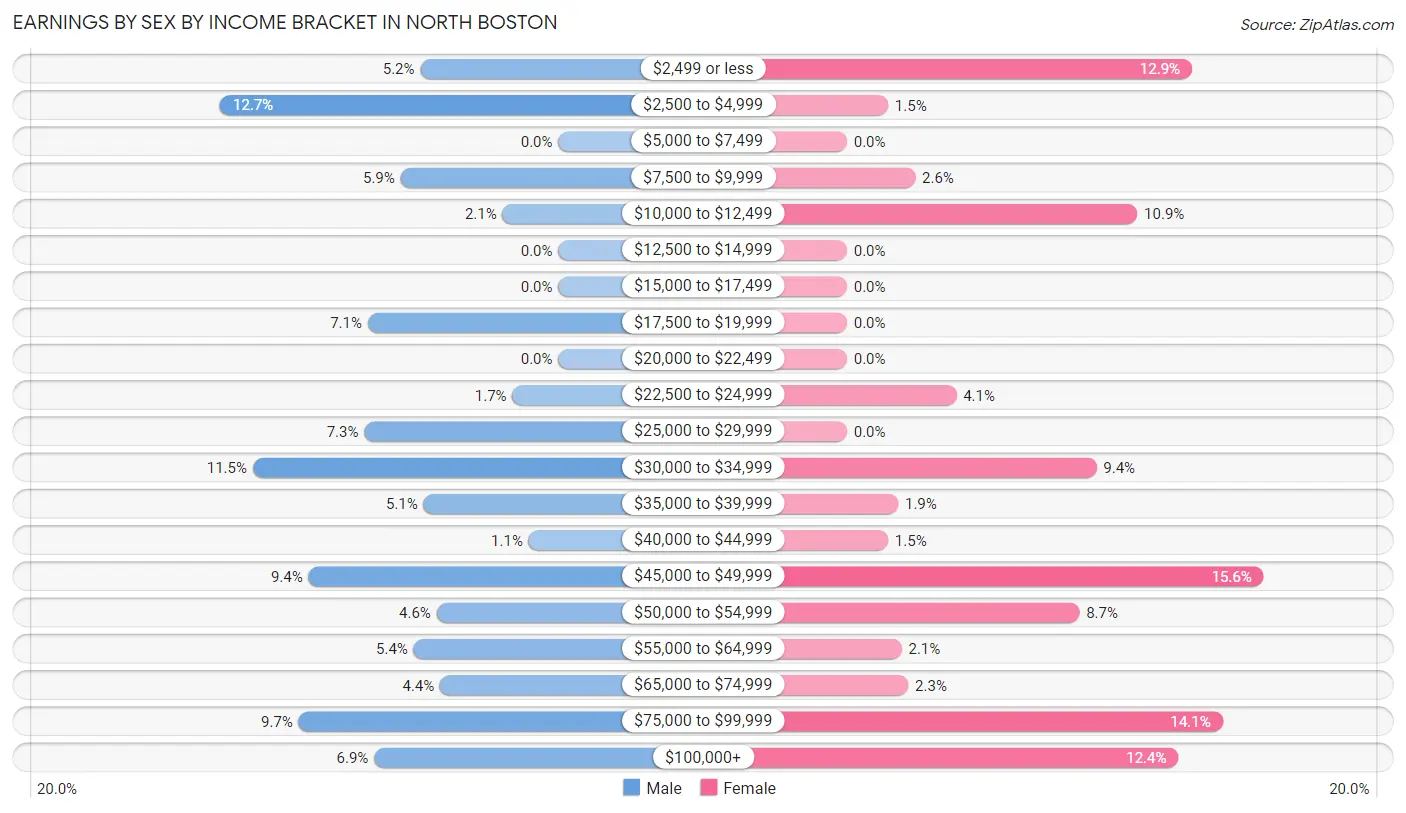
Earnings by Sex by Income Bracket in North Boston
The most common earnings brackets in North Boston are $2,500 to $4,999 for men (103 | 12.7%) and $45,000 to $49,999 for women (122 | 15.6%).
| Income | Male | Female |
| $2,499 or less | 42 (5.2%) | 101 (12.9%) |
| $2,500 to $4,999 | 103 (12.7%) | 12 (1.5%) |
| $5,000 to $7,499 | 0 (0.0%) | 0 (0.0%) |
| $7,500 to $9,999 | 48 (5.9%) | 20 (2.6%) |
| $10,000 to $12,499 | 17 (2.1%) | 85 (10.9%) |
| $12,500 to $14,999 | 0 (0.0%) | 0 (0.0%) |
| $15,000 to $17,499 | 0 (0.0%) | 0 (0.0%) |
| $17,500 to $19,999 | 58 (7.1%) | 0 (0.0%) |
| $20,000 to $22,499 | 0 (0.0%) | 0 (0.0%) |
| $22,500 to $24,999 | 14 (1.7%) | 32 (4.1%) |
| $25,000 to $29,999 | 59 (7.3%) | 0 (0.0%) |
| $30,000 to $34,999 | 93 (11.5%) | 73 (9.3%) |
| $35,000 to $39,999 | 41 (5.1%) | 15 (1.9%) |
| $40,000 to $44,999 | 9 (1.1%) | 12 (1.5%) |
| $45,000 to $49,999 | 76 (9.4%) | 122 (15.6%) |
| $50,000 to $54,999 | 37 (4.6%) | 68 (8.7%) |
| $55,000 to $64,999 | 44 (5.4%) | 16 (2.1%) |
| $65,000 to $74,999 | 36 (4.4%) | 18 (2.3%) |
| $75,000 to $99,999 | 79 (9.7%) | 110 (14.1%) |
| $100,000+ | 56 (6.9%) | 97 (12.4%) |
| Total | 812 (100.0%) | 781 (100.0%) |
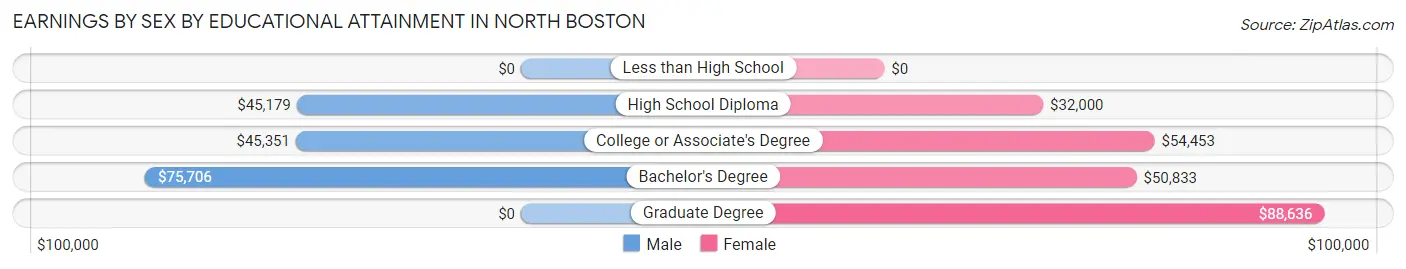
Earnings by Sex by Educational Attainment in North Boston
Average earnings in North Boston are $46,406 for men and $49,969 for women, a difference of 7.1%. Men with an educational attainment of bachelor's degree enjoy the highest average annual earnings of $75,706, while those with high school diploma education earn the least with $45,179. Women with an educational attainment of graduate degree earn the most with the average annual earnings of $88,636, while those with high school diploma education have the smallest earnings of $32,000.
| Educational Attainment | Male Income | Female Income |
| Less than High School | - | - |
| High School Diploma | $45,179 | $32,000 |
| College or Associate's Degree | $45,351 | $54,453 |
| Bachelor's Degree | $75,706 | $50,833 |
| Graduate Degree | - | - |
| Total | $46,406 | $49,969 |
Family Income in North Boston
Family Income Brackets in North Boston
According to the North Boston family income data, there are 274 families falling into the $100,000 to $149,999 income range, which is the most common income bracket and makes up 39.5% of all families.
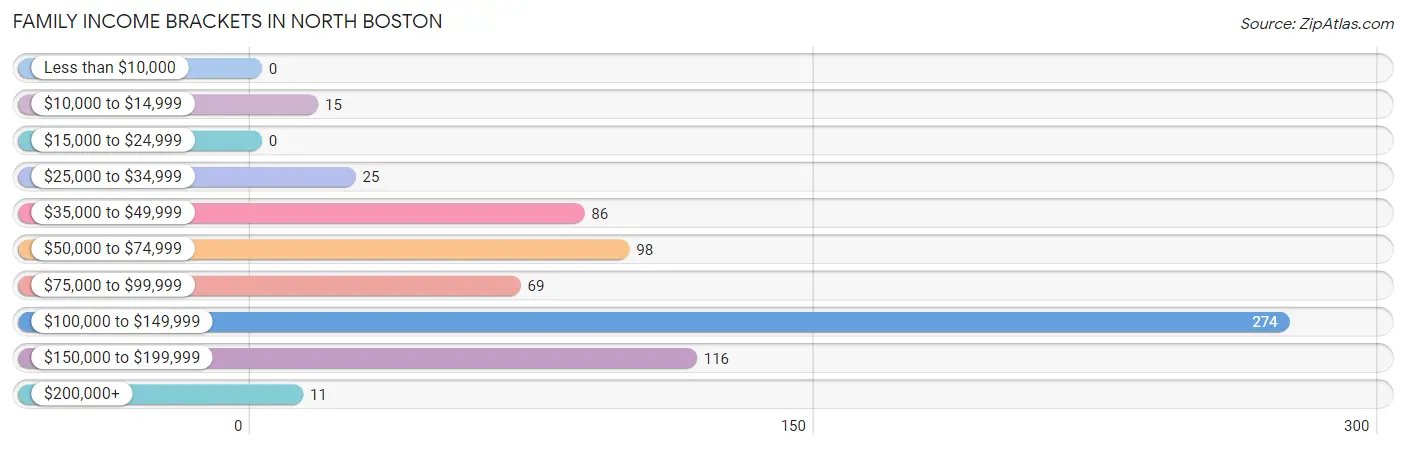
| Income Bracket | # Families | % Families |
| Less than $10,000 | 0 | 0.0% |
| $10,000 to $14,999 | 15 | 2.2% |
| $15,000 to $24,999 | 0 | 0.0% |
| $25,000 to $34,999 | 25 | 3.6% |
| $35,000 to $49,999 | 86 | 12.4% |
| $50,000 to $74,999 | 98 | 14.1% |
| $75,000 to $99,999 | 69 | 9.9% |
| $100,000 to $149,999 | 274 | 39.5% |
| $150,000 to $199,999 | 116 | 16.7% |
| $200,000+ | 11 | 1.6% |
Family Income by Famaliy Size in North Boston
5-person families (65 | 9.4%) account for the highest median family income in North Boston with $138,507 per family, while 2-person families (467 | 67.3%) have the highest median income of $45,974 per family member.
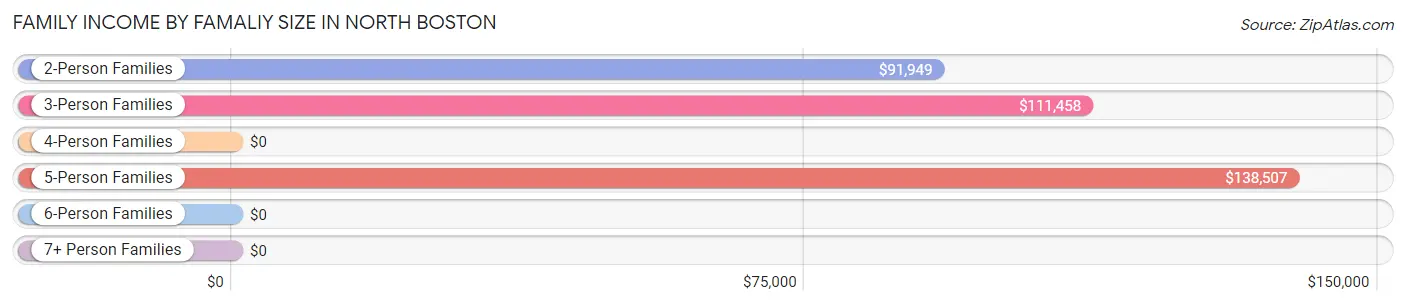
| Income Bracket | # Families | Median Income |
| 2-Person Families | 467 (67.3%) | $91,949 |
| 3-Person Families | 139 (20.0%) | $111,458 |
| 4-Person Families | 23 (3.3%) | $0 |
| 5-Person Families | 65 (9.4%) | $138,507 |
| 6-Person Families | 0 (0.0%) | $0 |
| 7+ Person Families | 0 (0.0%) | $0 |
| Total | 694 (100.0%) | $104,098 |
Family Income by Number of Earners in North Boston
The median family income in North Boston is $104,098, with families comprising 3+ earners (107) having the highest median family income of $138,090, while families with no earners (145) have the lowest median family income of $52,768, accounting for 15.4% and 20.9% of families, respectively.
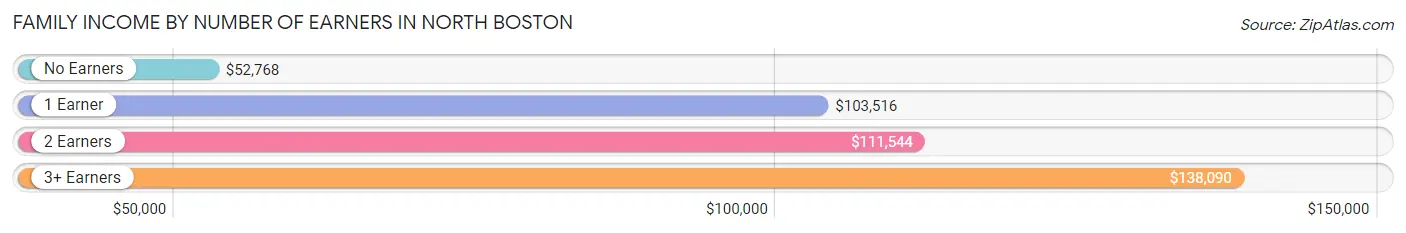
| Number of Earners | # Families | Median Income |
| No Earners | 145 (20.9%) | $52,768 |
| 1 Earner | 115 (16.6%) | $103,516 |
| 2 Earners | 327 (47.1%) | $111,544 |
| 3+ Earners | 107 (15.4%) | $138,090 |
| Total | 694 (100.0%) | $104,098 |
Household Income in North Boston
Household Income Brackets in North Boston
With 323 households falling in the category, the $100,000 to $149,999 income range is the most frequent in North Boston, accounting for 24.6% of all households. In contrast, only 11 households (0.8%) fall into the $200,000+ income bracket, making it the least populous group.
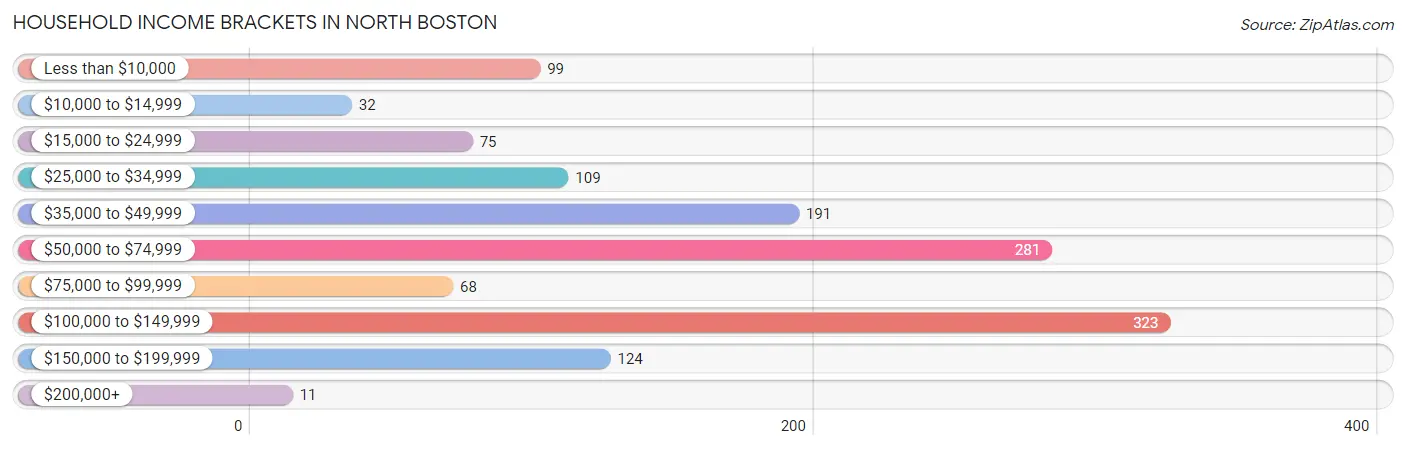
| Income Bracket | # Households | % Households |
| Less than $10,000 | 99 | 7.5% |
| $10,000 to $14,999 | 32 | 2.4% |
| $15,000 to $24,999 | 75 | 5.7% |
| $25,000 to $34,999 | 109 | 8.3% |
| $35,000 to $49,999 | 191 | 14.5% |
| $50,000 to $74,999 | 281 | 21.4% |
| $75,000 to $99,999 | 68 | 5.2% |
| $100,000 to $149,999 | 323 | 24.6% |
| $150,000 to $199,999 | 124 | 9.4% |
| $200,000+ | 11 | 0.8% |
Household Income by Householder Age in North Boston
The median household income in North Boston is $56,840, with the highest median household income of $96,719 found in the 45 to 64 years age bracket for the primary householder. A total of 669 households (50.9%) fall into this category. Meanwhile, the 15 to 24 years age bracket for the primary householder has the lowest median household income of $0, with 57 households (4.3%) in this group.
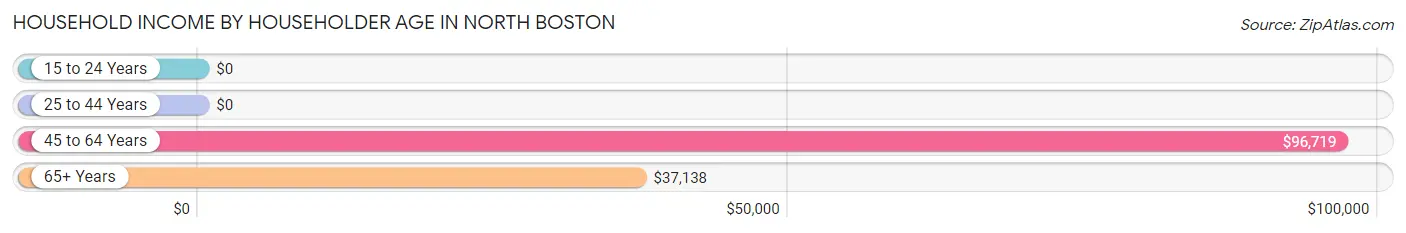
| Income Bracket | # Households | Median Income |
| 15 to 24 Years | 57 (4.3%) | $0 |
| 25 to 44 Years | 176 (13.4%) | $0 |
| 45 to 64 Years | 669 (50.9%) | $96,719 |
| 65+ Years | 413 (31.4%) | $37,138 |
| Total | 1,315 (100.0%) | $56,840 |
Poverty in North Boston
Income Below Poverty by Sex and Age in North Boston
With 7.9% poverty level for males and 8.3% for females among the residents of North Boston, 25 to 34 year old males and 25 to 34 year old females are the most vulnerable to poverty, with 48 males (64.9%) and 32 females (23.4%) in their respective age groups living below the poverty level.
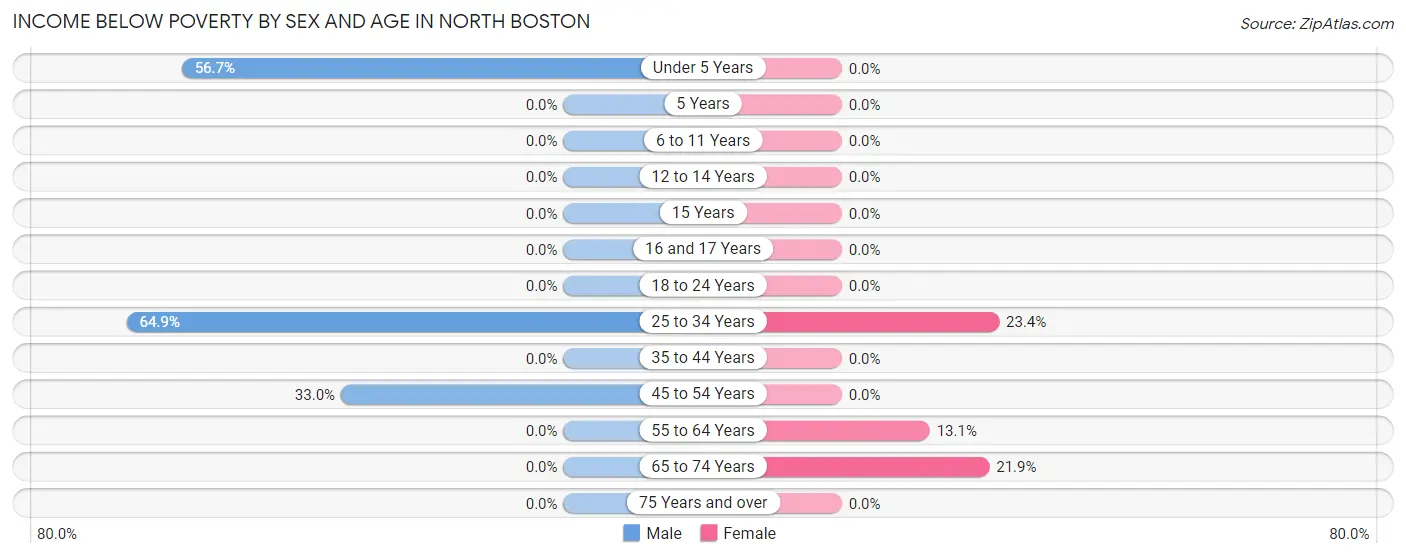
| Age Bracket | Male | Female |
| Under 5 Years | 17 (56.7%) | 0 (0.0%) |
| 5 Years | 0 (0.0%) | 0 (0.0%) |
| 6 to 11 Years | 0 (0.0%) | 0 (0.0%) |
| 12 to 14 Years | 0 (0.0%) | 0 (0.0%) |
| 15 Years | 0 (0.0%) | 0 (0.0%) |
| 16 and 17 Years | 0 (0.0%) | 0 (0.0%) |
| 18 to 24 Years | 0 (0.0%) | 0 (0.0%) |
| 25 to 34 Years | 48 (64.9%) | 32 (23.4%) |
| 35 to 44 Years | 0 (0.0%) | 0 (0.0%) |
| 45 to 54 Years | 36 (33.0%) | 0 (0.0%) |
| 55 to 64 Years | 0 (0.0%) | 44 (13.1%) |
| 65 to 74 Years | 0 (0.0%) | 30 (21.9%) |
| 75 Years and over | 0 (0.0%) | 0 (0.0%) |
| Total | 101 (7.9%) | 106 (8.3%) |
Income Above Poverty by Sex and Age in North Boston
According to the poverty statistics in North Boston, males aged 6 to 11 years and females aged under 5 years are the age groups that are most secure financially, with 100.0% of males and 100.0% of females in these age groups living above the poverty line.
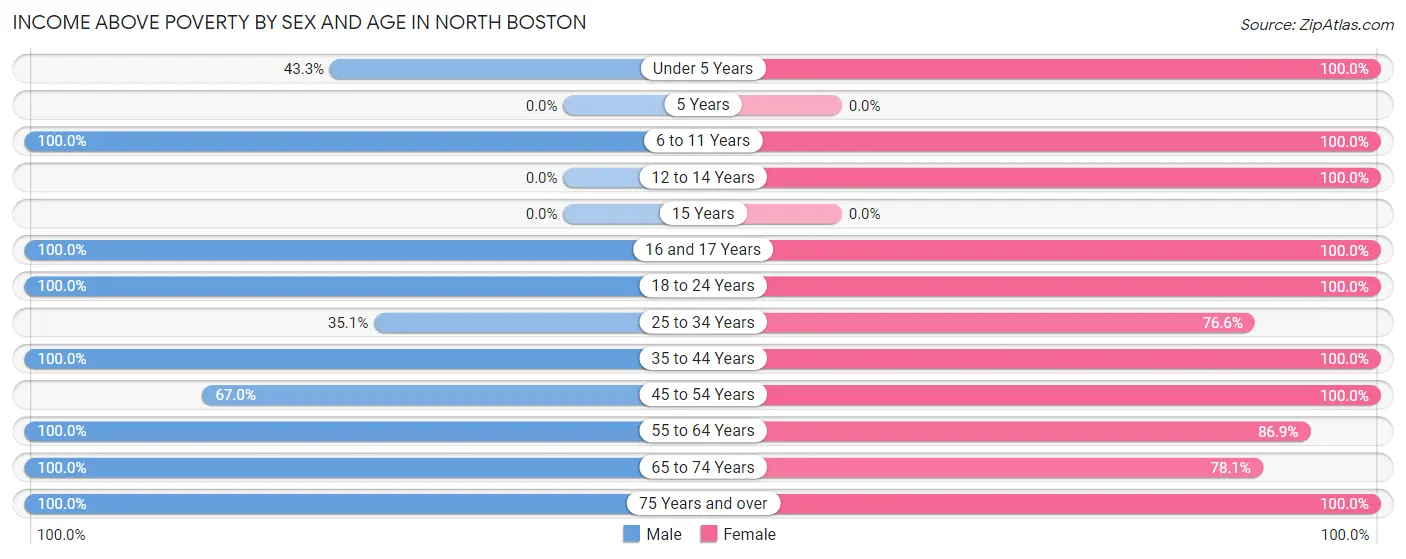
| Age Bracket | Male | Female |
| Under 5 Years | 13 (43.3%) | 10 (100.0%) |
| 5 Years | 0 (0.0%) | 0 (0.0%) |
| 6 to 11 Years | 55 (100.0%) | 18 (100.0%) |
| 12 to 14 Years | 0 (0.0%) | 20 (100.0%) |
| 15 Years | 0 (0.0%) | 0 (0.0%) |
| 16 and 17 Years | 69 (100.0%) | 113 (100.0%) |
| 18 to 24 Years | 168 (100.0%) | 70 (100.0%) |
| 25 to 34 Years | 26 (35.1%) | 105 (76.6%) |
| 35 to 44 Years | 85 (100.0%) | 56 (100.0%) |
| 45 to 54 Years | 73 (67.0%) | 184 (100.0%) |
| 55 to 64 Years | 450 (100.0%) | 293 (86.9%) |
| 65 to 74 Years | 122 (100.0%) | 107 (78.1%) |
| 75 Years and over | 120 (100.0%) | 190 (100.0%) |
| Total | 1,181 (92.1%) | 1,166 (91.7%) |
Income Below Poverty Among Married-Couple Families in North Boston
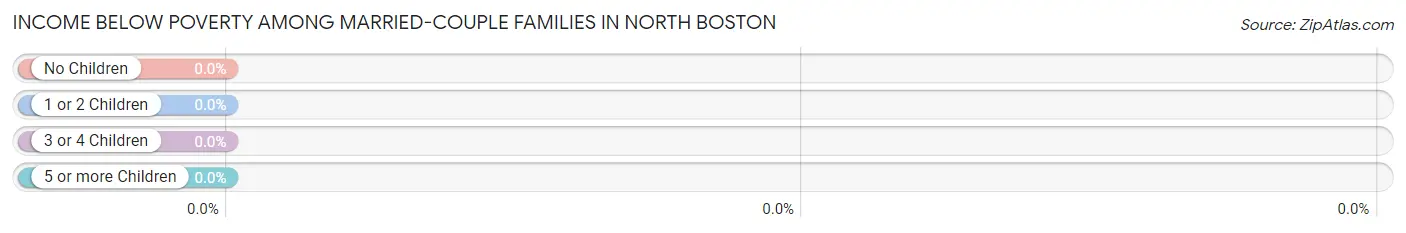
| Children | Above Poverty | Below Poverty |
| No Children | 453 (100.0%) | 0 (0.0%) |
| 1 or 2 Children | 27 (100.0%) | 0 (0.0%) |
| 3 or 4 Children | 57 (100.0%) | 0 (0.0%) |
| 5 or more Children | 0 (0.0%) | 0 (0.0%) |
| Total | 537 (100.0%) | 0 (0.0%) |
Income Below Poverty Among Single-Parent Households in North Boston
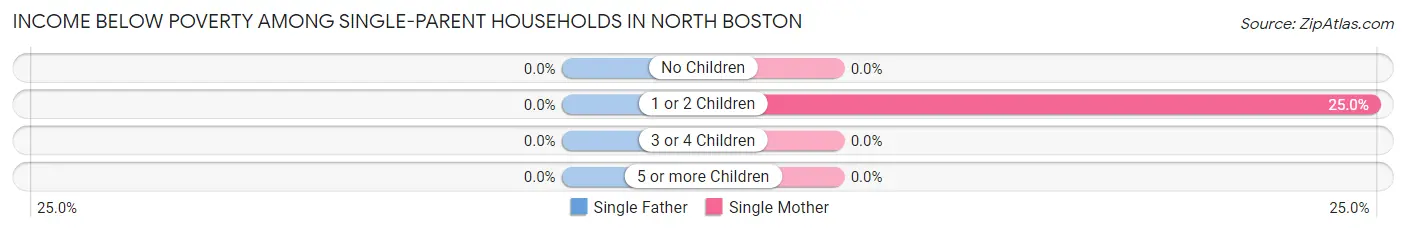
| Children | Single Father | Single Mother |
| No Children | 0 (0.0%) | 0 (0.0%) |
| 1 or 2 Children | 0 (0.0%) | 15 (25.0%) |
| 3 or 4 Children | 0 (0.0%) | 0 (0.0%) |
| 5 or more Children | 0 (0.0%) | 0 (0.0%) |
| Total | 0 (0.0%) | 15 (19.2%) |
Income Below Poverty Among Married-Couple vs Single-Parent Households in North Boston
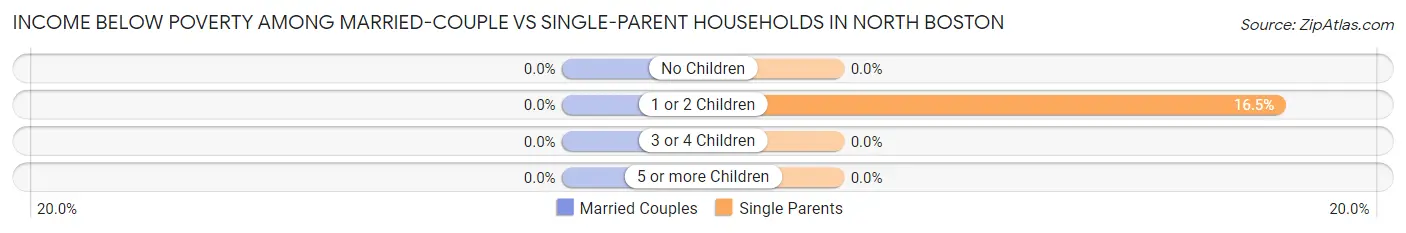
| Children | Married-Couple Families | Single-Parent Households |
| No Children | 0 (0.0%) | 0 (0.0%) |
| 1 or 2 Children | 0 (0.0%) | 15 (16.5%) |
| 3 or 4 Children | 0 (0.0%) | 0 (0.0%) |
| 5 or more Children | 0 (0.0%) | 0 (0.0%) |
| Total | 0 (0.0%) | 15 (9.6%) |
Race in North Boston
The most populous races in North Boston are White / Caucasian (2,340 | 91.6%), Two or more Races (197 | 7.7%), and Hispanic or Latino (36 | 1.4%).
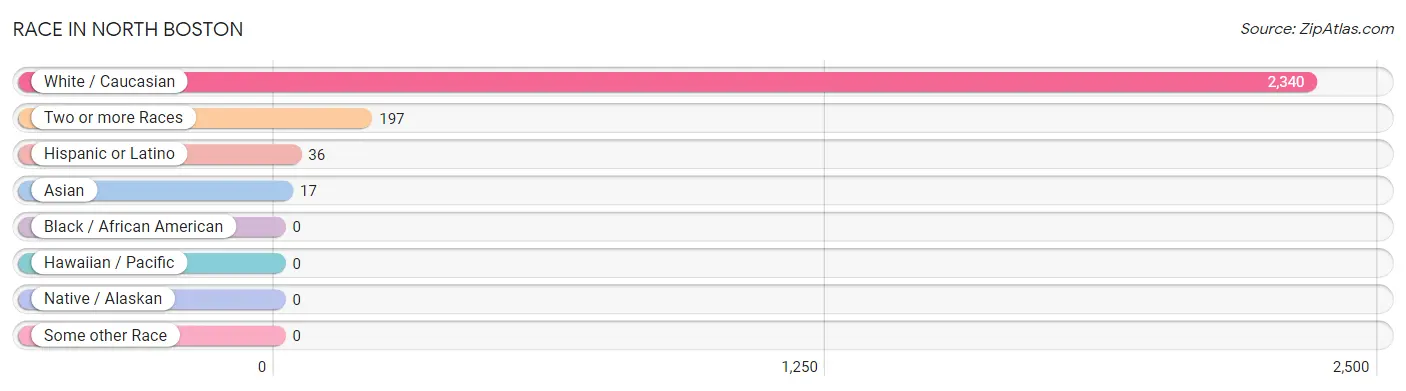
| Race | # Population | % Population |
| Asian | 17 | 0.7% |
| Black / African American | 0 | 0.0% |
| Hawaiian / Pacific | 0 | 0.0% |
| Hispanic or Latino | 36 | 1.4% |
| Native / Alaskan | 0 | 0.0% |
| White / Caucasian | 2,340 | 91.6% |
| Two or more Races | 197 | 7.7% |
| Some other Race | 0 | 0.0% |
| Total | 2,554 | 100.0% |
Ancestry in North Boston
The most populous ancestries reported in North Boston are German (769 | 30.1%), Irish (320 | 12.5%), Polish (290 | 11.4%), English (206 | 8.1%), and Italian (167 | 6.5%), together accounting for 68.6% of all North Boston residents.
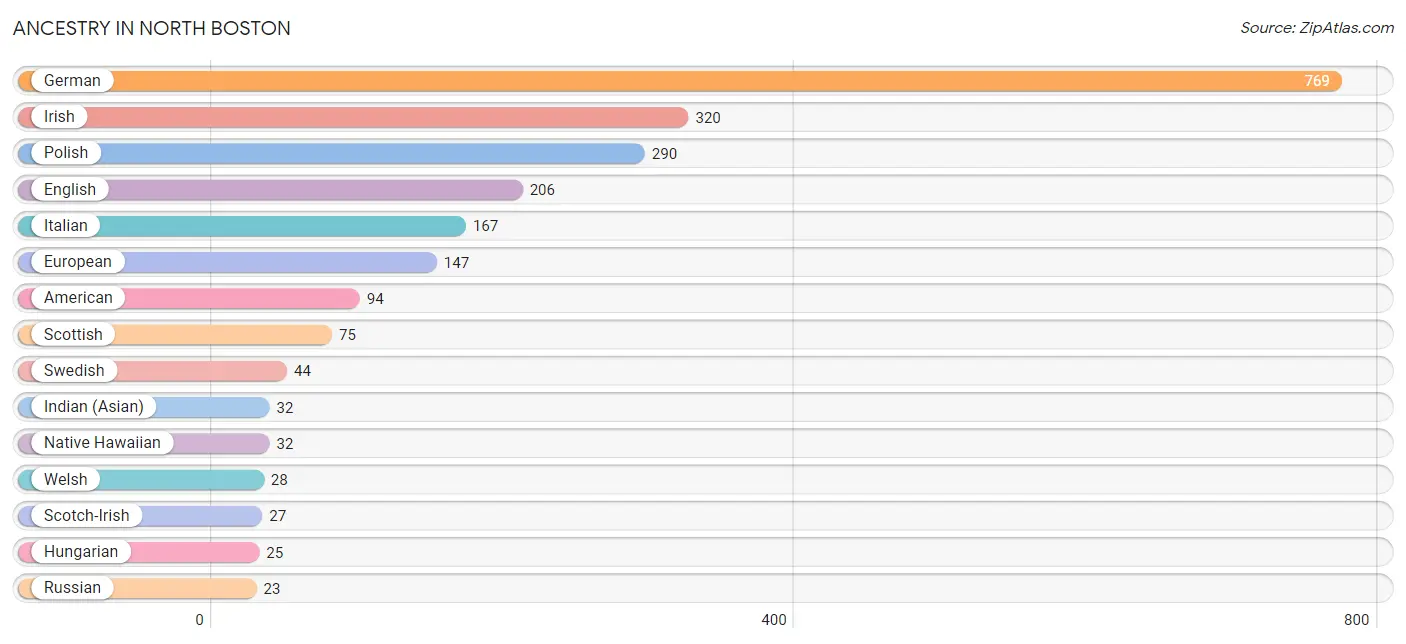
| Ancestry | # Population | % Population |
| American | 94 | 3.7% |
| Burmese | 17 | 0.7% |
| Canadian | 16 | 0.6% |
| Czech | 11 | 0.4% |
| Eastern European | 11 | 0.4% |
| English | 206 | 8.1% |
| European | 147 | 5.8% |
| French | 14 | 0.5% |
| French Canadian | 15 | 0.6% |
| German | 769 | 30.1% |
| Hungarian | 25 | 1.0% |
| Indian (Asian) | 32 | 1.3% |
| Irish | 320 | 12.5% |
| Italian | 167 | 6.5% |
| Native Hawaiian | 32 | 1.3% |
| Norwegian | 10 | 0.4% |
| Polish | 290 | 11.4% |
| Puerto Rican | 21 | 0.8% |
| Russian | 23 | 0.9% |
| Scotch-Irish | 27 | 1.1% |
| Scottish | 75 | 2.9% |
| Spaniard | 15 | 0.6% |
| Swedish | 44 | 1.7% |
| Welsh | 28 | 1.1% | View All 24 Rows |
Immigrants in North Boston
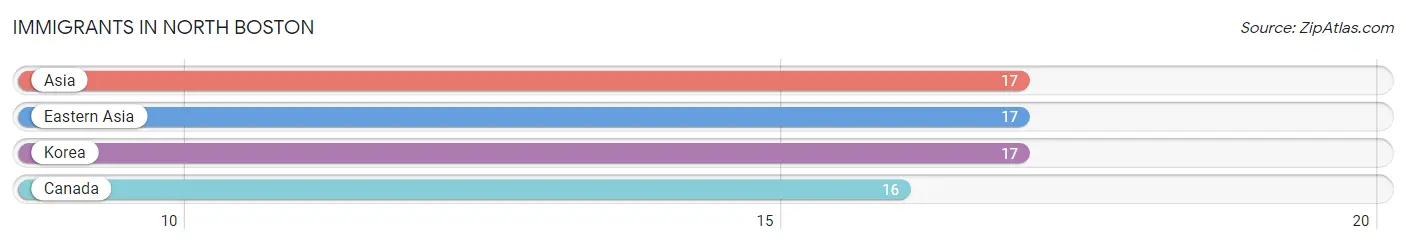
The most numerous immigrant groups reported in North Boston came from Asia (17 | 0.7%), Eastern Asia (17 | 0.7%), Korea (17 | 0.7%), and Canada (16 | 0.6%), together accounting for 2.6% of all North Boston residents.
| Immigration Origin | # Population | % Population |
| Asia | 17 | 0.7% |
| Canada | 16 | 0.6% |
| Eastern Asia | 17 | 0.7% |
| Korea | 17 | 0.7% | View All 4 Rows |
Sex and Age in North Boston
Sex and Age in North Boston
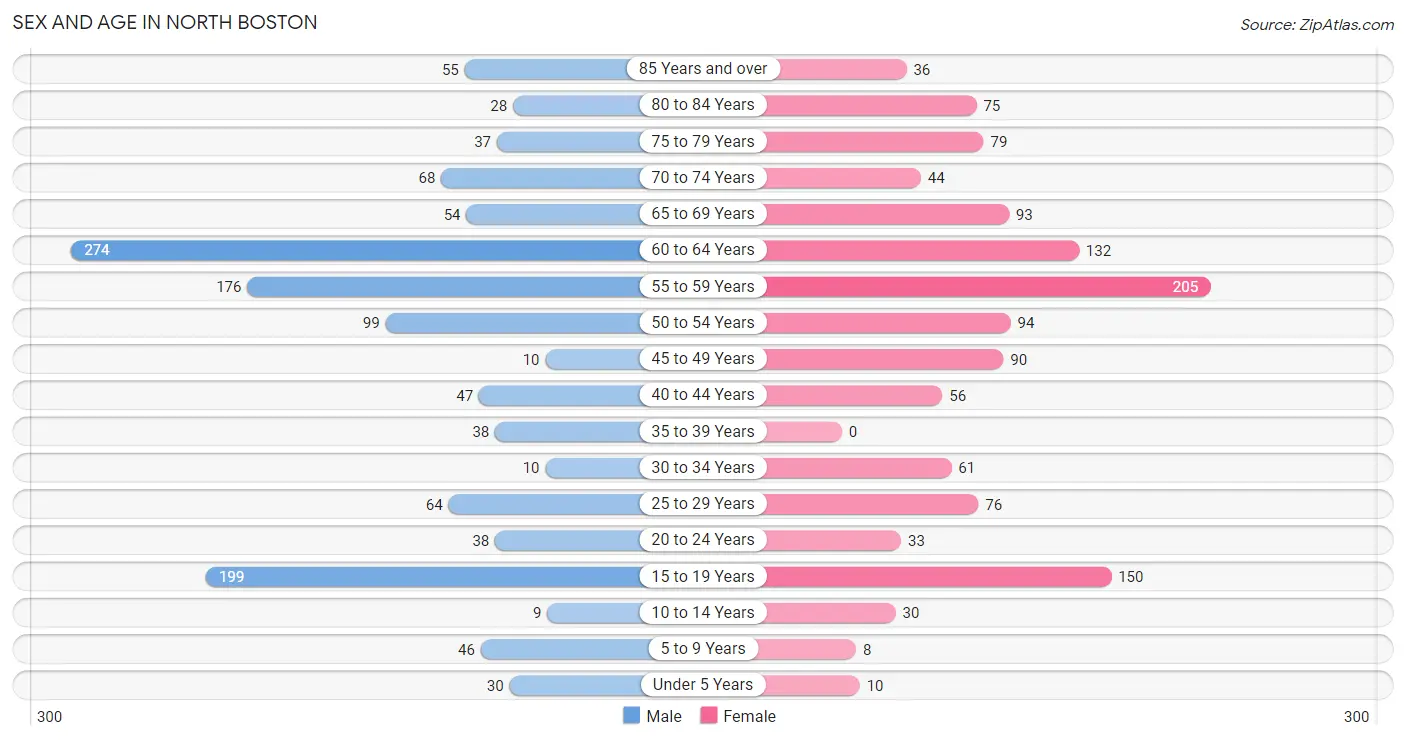
The most populous age groups in North Boston are 60 to 64 Years (274 | 21.4%) for men and 55 to 59 Years (205 | 16.1%) for women.
| Age Bracket | Male | Female |
| Under 5 Years | 30 (2.3%) | 10 (0.8%) |
| 5 to 9 Years | 46 (3.6%) | 8 (0.6%) |
| 10 to 14 Years | 9 (0.7%) | 30 (2.4%) |
| 15 to 19 Years | 199 (15.5%) | 150 (11.8%) |
| 20 to 24 Years | 38 (3.0%) | 33 (2.6%) |
| 25 to 29 Years | 64 (5.0%) | 76 (6.0%) |
| 30 to 34 Years | 10 (0.8%) | 61 (4.8%) |
| 35 to 39 Years | 38 (3.0%) | 0 (0.0%) |
| 40 to 44 Years | 47 (3.7%) | 56 (4.4%) |
| 45 to 49 Years | 10 (0.8%) | 90 (7.1%) |
| 50 to 54 Years | 99 (7.7%) | 94 (7.4%) |
| 55 to 59 Years | 176 (13.7%) | 205 (16.1%) |
| 60 to 64 Years | 274 (21.4%) | 132 (10.4%) |
| 65 to 69 Years | 54 (4.2%) | 93 (7.3%) |
| 70 to 74 Years | 68 (5.3%) | 44 (3.5%) |
| 75 to 79 Years | 37 (2.9%) | 79 (6.2%) |
| 80 to 84 Years | 28 (2.2%) | 75 (5.9%) |
| 85 Years and over | 55 (4.3%) | 36 (2.8%) |
| Total | 1,282 (100.0%) | 1,272 (100.0%) |
Families and Households in North Boston
Median Family Size in North Boston
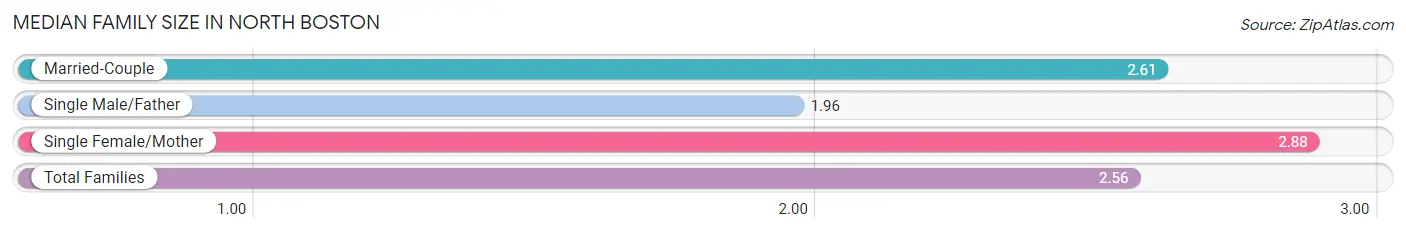
The median family size in North Boston is 2.56 persons per family, with single female/mother families (78 | 11.2%) accounting for the largest median family size of 2.88 persons per family. On the other hand, single male/father families (79 | 11.4%) represent the smallest median family size with 1.96 persons per family.
| Family Type | # Families | Family Size |
| Married-Couple | 537 (77.4%) | 2.61 |
| Single Male/Father | 79 (11.4%) | 1.96 |
| Single Female/Mother | 78 (11.2%) | 2.88 |
| Total Families | 694 (100.0%) | 2.56 |
Median Household Size in North Boston
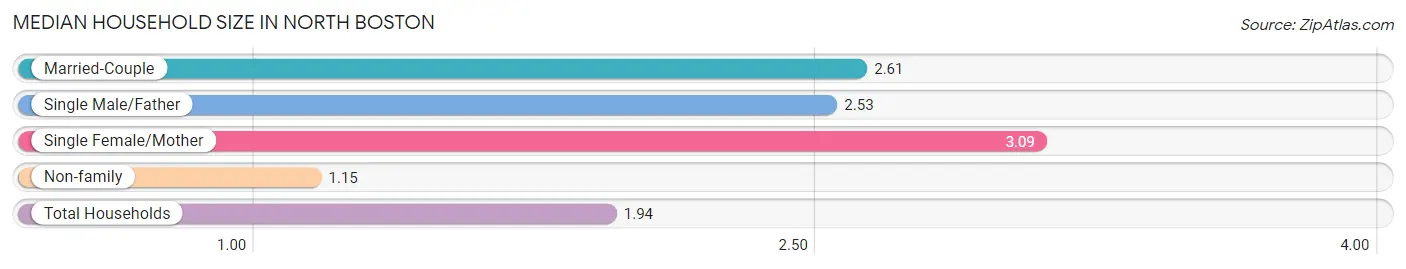
The median household size in North Boston is 1.94 persons per household, with single female/mother households (78 | 5.9%) accounting for the largest median household size of 3.09 persons per household. non-family households (621 | 47.2%) represent the smallest median household size with 1.15 persons per household.
| Household Type | # Households | Household Size |
| Married-Couple | 537 (40.8%) | 2.61 |
| Single Male/Father | 79 (6.0%) | 2.53 |
| Single Female/Mother | 78 (5.9%) | 3.09 |
| Non-family | 621 (47.2%) | 1.15 |
| Total Households | 1,315 (100.0%) | 1.94 |
Household Size by Marriage Status in North Boston
Out of a total of 1,315 households in North Boston, 694 (52.8%) are family households, while 621 (47.2%) are nonfamily households. The most numerous type of family households are 2-person households, comprising 404, and the most common type of nonfamily households are 1-person households, comprising 534.
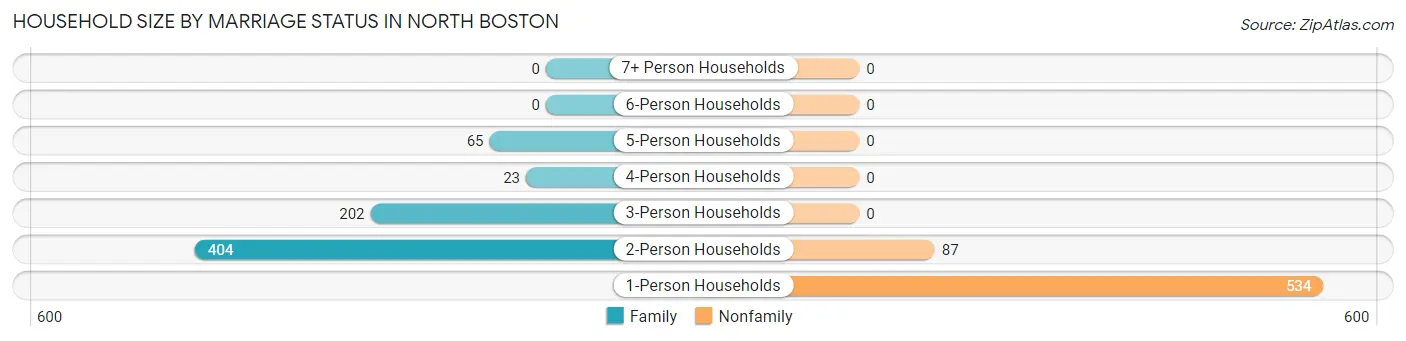
| Household Size | Family Households | Nonfamily Households |
| 1-Person Households | - | 534 (40.6%) |
| 2-Person Households | 404 (30.7%) | 87 (6.6%) |
| 3-Person Households | 202 (15.4%) | 0 (0.0%) |
| 4-Person Households | 23 (1.8%) | 0 (0.0%) |
| 5-Person Households | 65 (4.9%) | 0 (0.0%) |
| 6-Person Households | 0 (0.0%) | 0 (0.0%) |
| 7+ Person Households | 0 (0.0%) | 0 (0.0%) |
| Total | 694 (52.8%) | 621 (47.2%) |
Female Fertility in North Boston
Fertility by Age in North Boston
| Age Bracket | Women with Births | Births / 1,000 Women |
| 15 to 19 years | 0 (0.0%) | 0.0 |
| 20 to 34 years | 0 (0.0%) | 0.0 |
| 35 to 50 years | 0 (0.0%) | 0.0 |
| Total | 0 (0.0%) | 0.0 |
Fertility by Age by Marriage Status in North Boston
| Age Bracket | Married | Unmarried |
| 15 to 19 years | 0 (0.0%) | 0 (0.0%) |
| 20 to 34 years | 0 (0.0%) | 0 (0.0%) |
| 35 to 50 years | 0 (0.0%) | 0 (0.0%) |
| Total | 0 (0.0%) | 0 (0.0%) |
Fertility by Education in North Boston
| Educational Attainment | Women with Births | Births / 1,000 Women |
| Less than High School | 0 (0.0%) | 0.0 |
| High School Diploma | 0 (0.0%) | 0.0 |
| College or Associate's Degree | 0 (0.0%) | 0.0 |
| Bachelor's Degree | 0 (0.0%) | 0.0 |
| Graduate Degree | 0 (0.0%) | 0.0 |
| Total | 0 (0.0%) | 0.0 |
Fertility by Education by Marriage Status in North Boston
| Educational Attainment | Married | Unmarried |
| Less than High School | 0 (0.0%) | 0 (0.0%) |
| High School Diploma | 0 (0.0%) | 0 (0.0%) |
| College or Associate's Degree | 0 (0.0%) | 0 (0.0%) |
| Bachelor's Degree | 0 (0.0%) | 0 (0.0%) |
| Graduate Degree | 0 (0.0%) | 0 (0.0%) |
| Total | 0 (0.0%) | 0 (0.0%) |
Employment Characteristics in North Boston
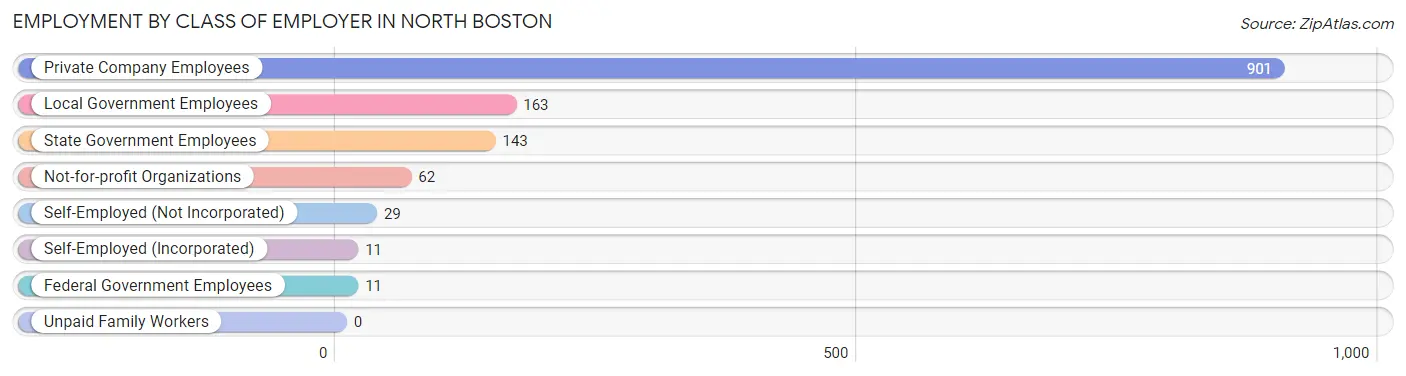
Employment by Class of Employer in North Boston
Among the 1,320 employed individuals in North Boston, private company employees (901 | 68.3%), local government employees (163 | 12.3%), and state government employees (143 | 10.8%) make up the most common classes of employment.
| Employer Class | # Employees | % Employees |
| Private Company Employees | 901 | 68.3% |
| Self-Employed (Incorporated) | 11 | 0.8% |
| Self-Employed (Not Incorporated) | 29 | 2.2% |
| Not-for-profit Organizations | 62 | 4.7% |
| Local Government Employees | 163 | 12.3% |
| State Government Employees | 143 | 10.8% |
| Federal Government Employees | 11 | 0.8% |
| Unpaid Family Workers | 0 | 0.0% |
| Total | 1,320 | 100.0% |
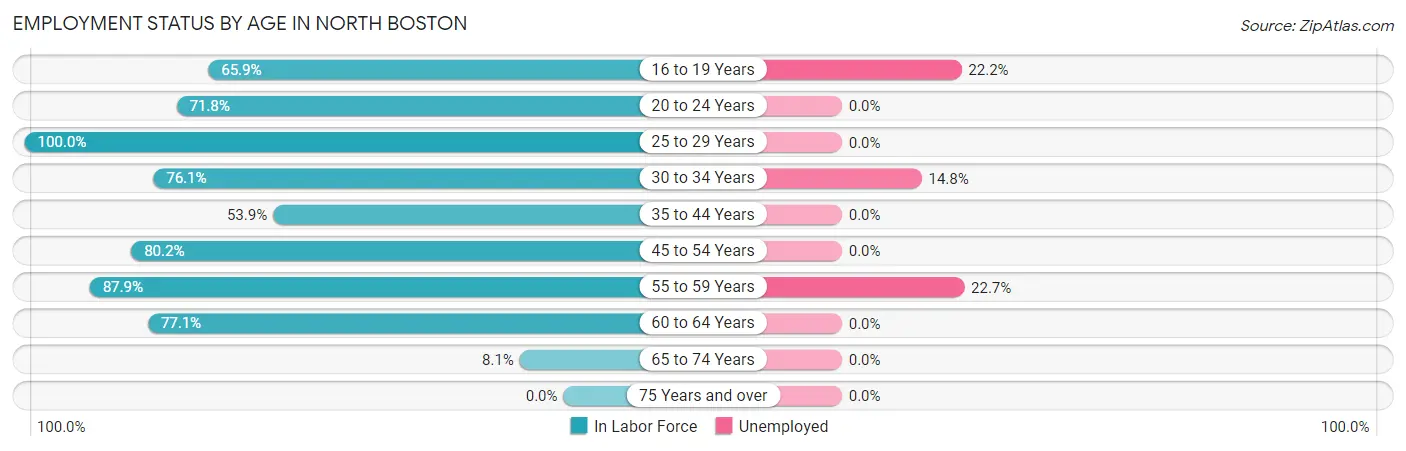
Employment Status by Age in North Boston
According to the labor force statistics for North Boston, out of the total population over 16 years of age (2,421), 60.1% or 1,455 individuals are in the labor force, with 9.3% or 135 of them unemployed. The age group with the highest labor force participation rate is 25 to 29 years, with 100.0% or 140 individuals in the labor force. Within the labor force, the 55 to 59 years age range has the highest percentage of unemployed individuals, with 22.7% or 76 of them being unemployed.
| Age Bracket | In Labor Force | Unemployed |
| 16 to 19 Years | 230 (65.9%) | 51 (22.2%) |
| 20 to 24 Years | 51 (71.8%) | 0 (0.0%) |
| 25 to 29 Years | 140 (100.0%) | 0 (0.0%) |
| 30 to 34 Years | 54 (76.1%) | 8 (14.8%) |
| 35 to 44 Years | 76 (53.9%) | 0 (0.0%) |
| 45 to 54 Years | 235 (80.2%) | 0 (0.0%) |
| 55 to 59 Years | 335 (87.9%) | 76 (22.7%) |
| 60 to 64 Years | 313 (77.1%) | 0 (0.0%) |
| 65 to 74 Years | 21 (8.1%) | 0 (0.0%) |
| 75 Years and over | 0 (0.0%) | 0 (0.0%) |
| Total | 1,455 (60.1%) | 135 (9.3%) |
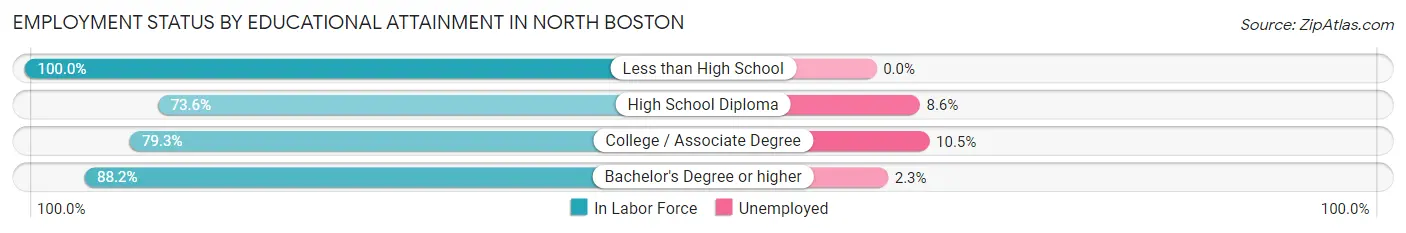
Employment Status by Educational Attainment in North Boston
According to labor force statistics for North Boston, 80.5% of individuals (1,153) out of the total population between 25 and 64 years of age (1,432) are in the labor force, with 7.3% or 84 of them being unemployed. The group with the highest labor force participation rate are those with the educational attainment of less than high school, with 100.0% or 22 individuals in the labor force. Within the labor force, individuals with college / associate degree education have the highest percentage of unemployment, with 10.5% or 51 of them being unemployed.
| Educational Attainment | In Labor Force | Unemployed |
| Less than High School | 22 (100.0%) | 0 (0.0%) |
| High School Diploma | 292 (73.6%) | 34 (8.6%) |
| College / Associate Degree | 488 (79.3%) | 65 (10.5%) |
| Bachelor's Degree or higher | 351 (88.2%) | 9 (2.3%) |
| Total | 1,153 (80.5%) | 105 (7.3%) |
Employment Occupations by Sex in North Boston
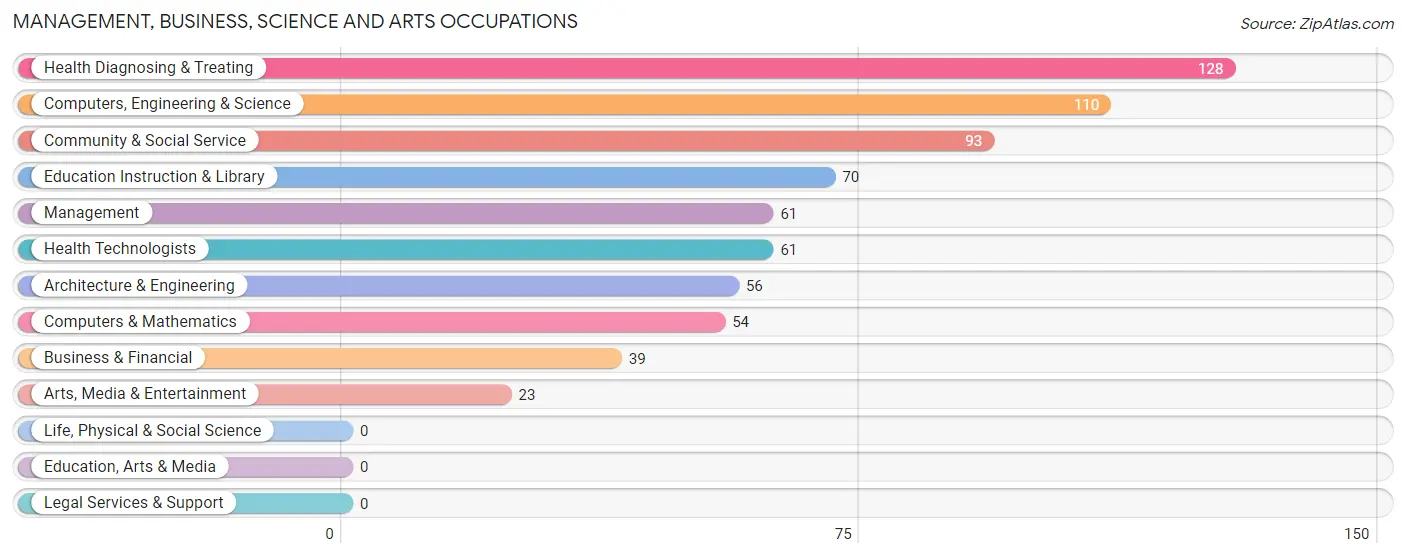
Management, Business, Science and Arts Occupations
The most common Management, Business, Science and Arts occupations in North Boston are Health Diagnosing & Treating (128 | 9.7%), Computers, Engineering & Science (110 | 8.3%), Community & Social Service (93 | 7.0%), Education Instruction & Library (70 | 5.3%), and Management (61 | 4.6%).
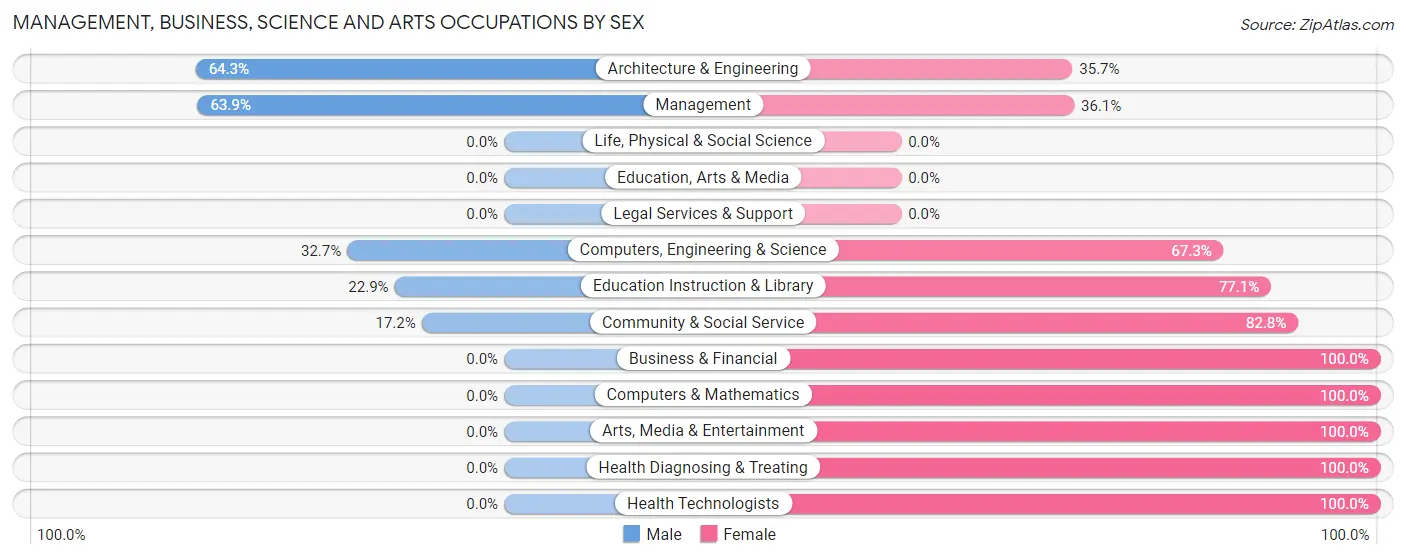
Management, Business, Science and Arts Occupations by Sex
Within the Management, Business, Science and Arts occupations in North Boston, the most male-oriented occupations are Architecture & Engineering (64.3%), Management (63.9%), and Computers, Engineering & Science (32.7%), while the most female-oriented occupations are Business & Financial (100.0%), Computers & Mathematics (100.0%), and Arts, Media & Entertainment (100.0%).
| Occupation | Male | Female |
| Management | 39 (63.9%) | 22 (36.1%) |
| Business & Financial | 0 (0.0%) | 39 (100.0%) |
| Computers, Engineering & Science | 36 (32.7%) | 74 (67.3%) |
| Computers & Mathematics | 0 (0.0%) | 54 (100.0%) |
| Architecture & Engineering | 36 (64.3%) | 20 (35.7%) |
| Life, Physical & Social Science | 0 (0.0%) | 0 (0.0%) |
| Community & Social Service | 16 (17.2%) | 77 (82.8%) |
| Education, Arts & Media | 0 (0.0%) | 0 (0.0%) |
| Legal Services & Support | 0 (0.0%) | 0 (0.0%) |
| Education Instruction & Library | 16 (22.9%) | 54 (77.1%) |
| Arts, Media & Entertainment | 0 (0.0%) | 23 (100.0%) |
| Health Diagnosing & Treating | 0 (0.0%) | 128 (100.0%) |
| Health Technologists | 0 (0.0%) | 61 (100.0%) |
| Total (Category) | 91 (21.1%) | 340 (78.9%) |
| Total (Overall) | 649 (49.2%) | 671 (50.8%) |
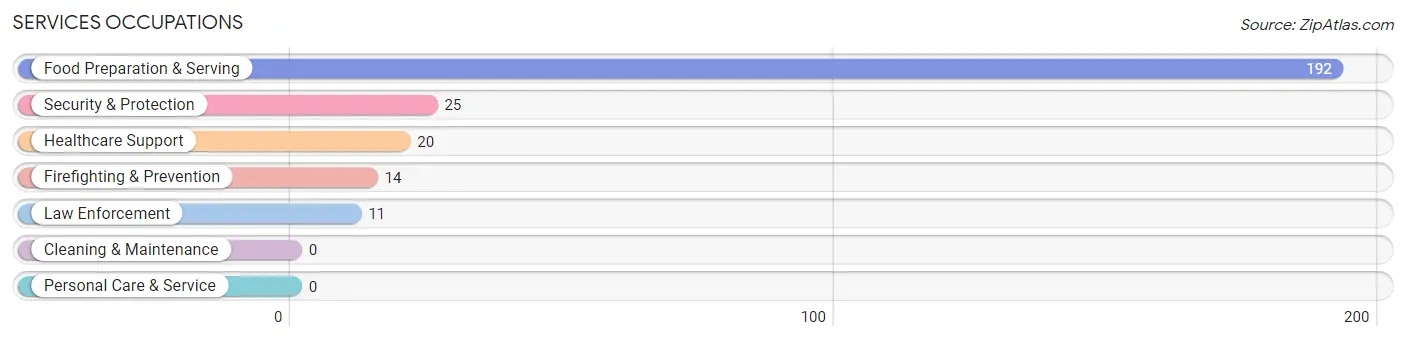
Services Occupations
The most common Services occupations in North Boston are Food Preparation & Serving (192 | 14.5%), Security & Protection (25 | 1.9%), Healthcare Support (20 | 1.5%), Firefighting & Prevention (14 | 1.1%), and Law Enforcement (11 | 0.8%).
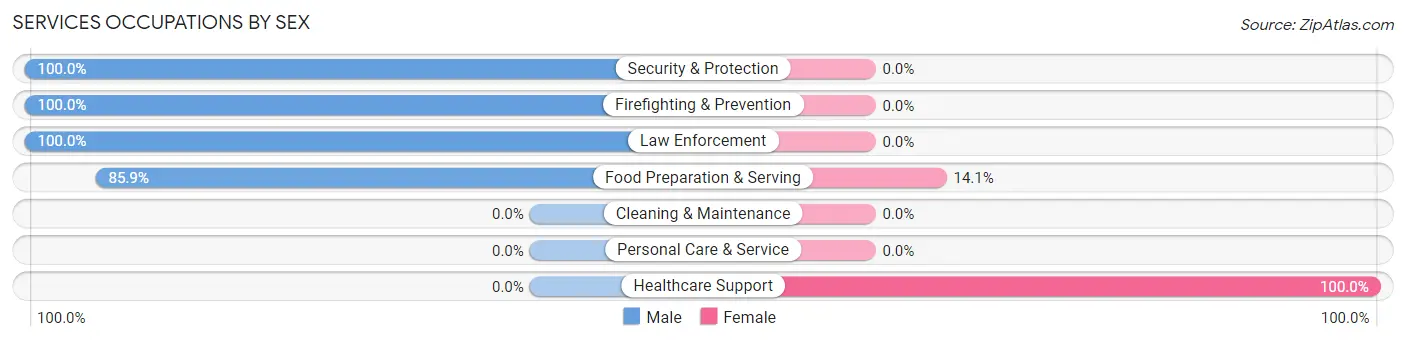
Services Occupations by Sex
Within the Services occupations in North Boston, the most male-oriented occupations are Security & Protection (100.0%), Firefighting & Prevention (100.0%), and Law Enforcement (100.0%), while the most female-oriented occupations are Healthcare Support (100.0%), and Food Preparation & Serving (14.1%).
| Occupation | Male | Female |
| Healthcare Support | 0 (0.0%) | 20 (100.0%) |
| Security & Protection | 25 (100.0%) | 0 (0.0%) |
| Firefighting & Prevention | 14 (100.0%) | 0 (0.0%) |
| Law Enforcement | 11 (100.0%) | 0 (0.0%) |
| Food Preparation & Serving | 165 (85.9%) | 27 (14.1%) |
| Cleaning & Maintenance | 0 (0.0%) | 0 (0.0%) |
| Personal Care & Service | 0 (0.0%) | 0 (0.0%) |
| Total (Category) | 190 (80.2%) | 47 (19.8%) |
| Total (Overall) | 649 (49.2%) | 671 (50.8%) |
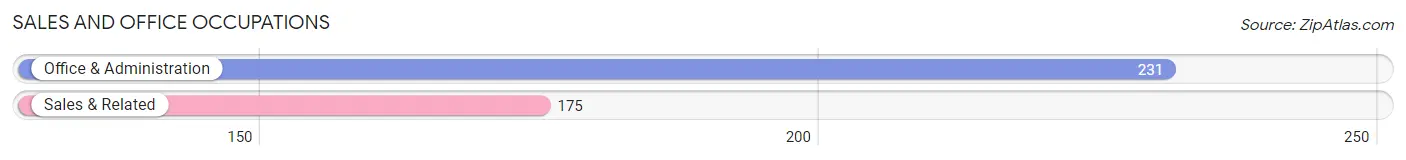
Sales and Office Occupations
The most common Sales and Office occupations in North Boston are Office & Administration (231 | 17.5%), and Sales & Related (175 | 13.3%).
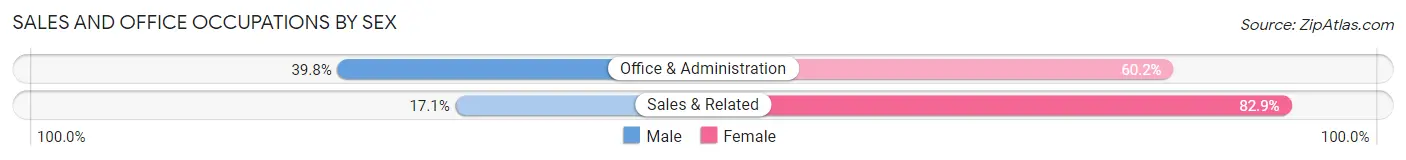
Sales and Office Occupations by Sex
| Occupation | Male | Female |
| Sales & Related | 30 (17.1%) | 145 (82.9%) |
| Office & Administration | 92 (39.8%) | 139 (60.2%) |
| Total (Category) | 122 (30.0%) | 284 (70.0%) |
| Total (Overall) | 649 (49.2%) | 671 (50.8%) |
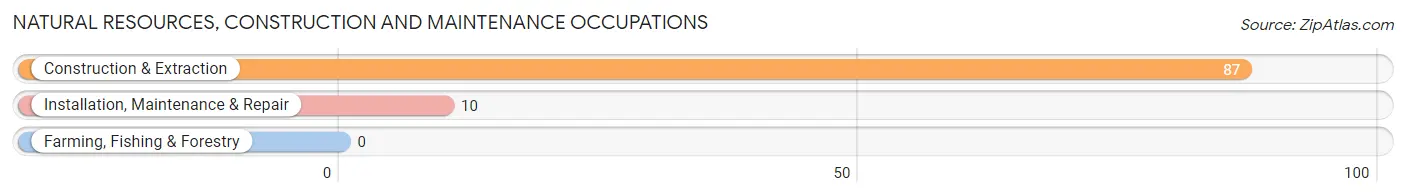
Natural Resources, Construction and Maintenance Occupations
The most common Natural Resources, Construction and Maintenance occupations in North Boston are Construction & Extraction (87 | 6.6%), and Installation, Maintenance & Repair (10 | 0.8%).
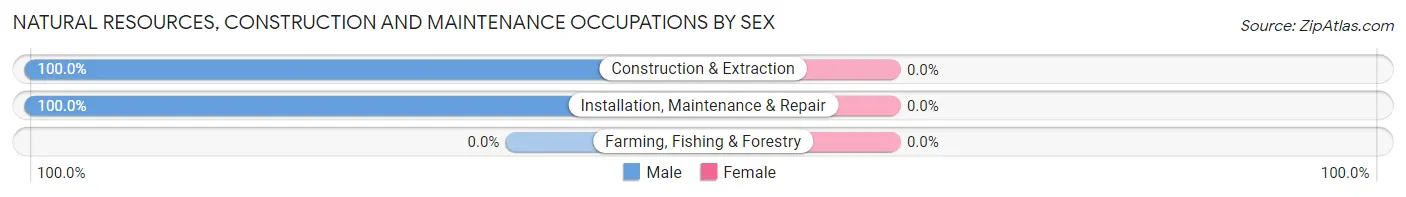
Natural Resources, Construction and Maintenance Occupations by Sex
| Occupation | Male | Female |
| Farming, Fishing & Forestry | 0 (0.0%) | 0 (0.0%) |
| Construction & Extraction | 87 (100.0%) | 0 (0.0%) |
| Installation, Maintenance & Repair | 10 (100.0%) | 0 (0.0%) |
| Total (Category) | 97 (100.0%) | 0 (0.0%) |
| Total (Overall) | 649 (49.2%) | 671 (50.8%) |
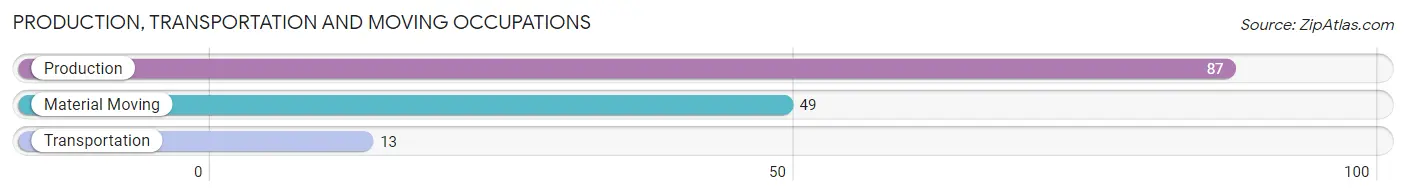
Production, Transportation and Moving Occupations
The most common Production, Transportation and Moving occupations in North Boston are Production (87 | 6.6%), Material Moving (49 | 3.7%), and Transportation (13 | 1.0%).
Production, Transportation and Moving Occupations by Sex
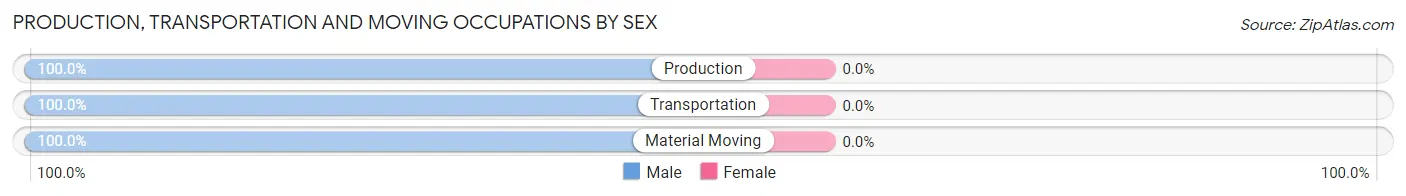
| Occupation | Male | Female |
| Production | 87 (100.0%) | 0 (0.0%) |
| Transportation | 13 (100.0%) | 0 (0.0%) |
| Material Moving | 49 (100.0%) | 0 (0.0%) |
| Total (Category) | 149 (100.0%) | 0 (0.0%) |
| Total (Overall) | 649 (49.2%) | 671 (50.8%) |
Employment Industries by Sex in North Boston
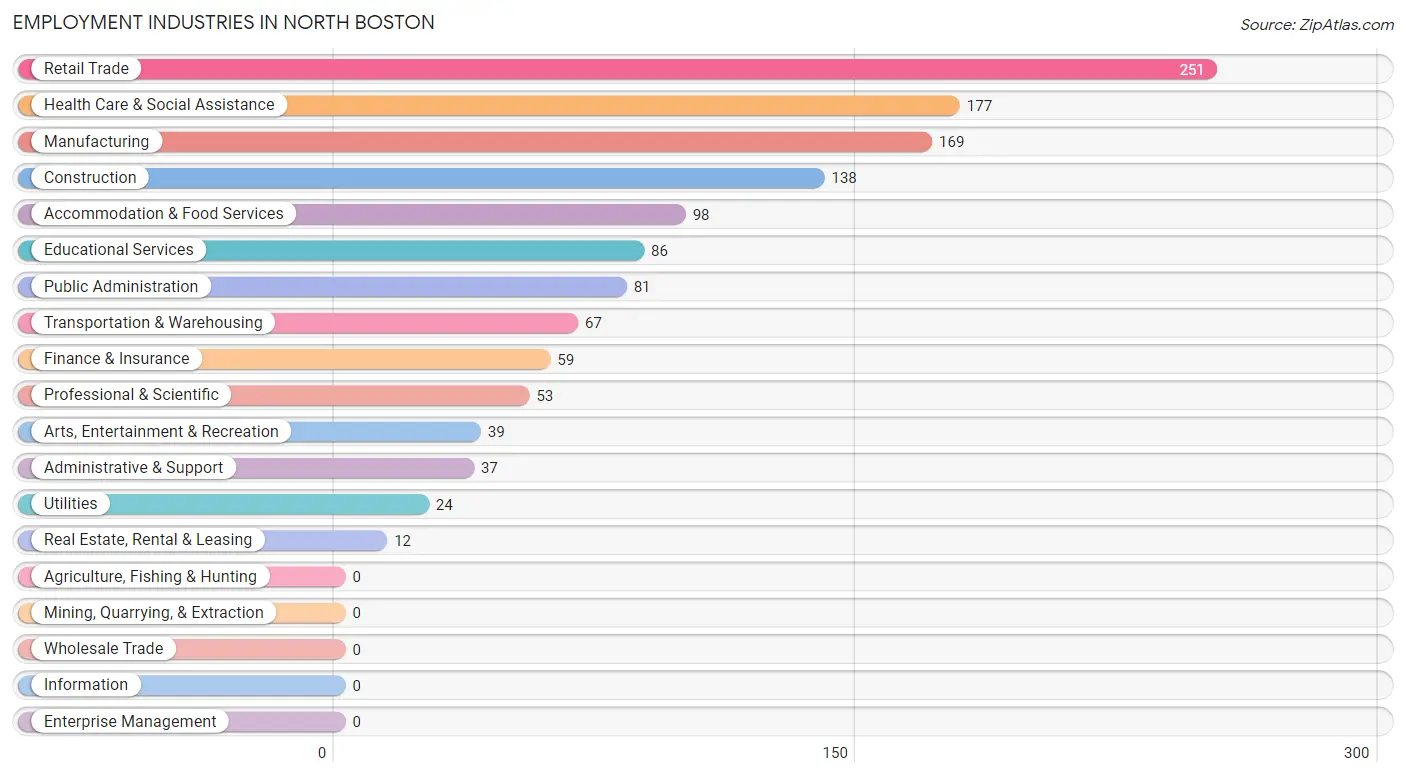
Employment Industries in North Boston
The major employment industries in North Boston include Retail Trade (251 | 19.0%), Health Care & Social Assistance (177 | 13.4%), Manufacturing (169 | 12.8%), Construction (138 | 10.4%), and Accommodation & Food Services (98 | 7.4%).
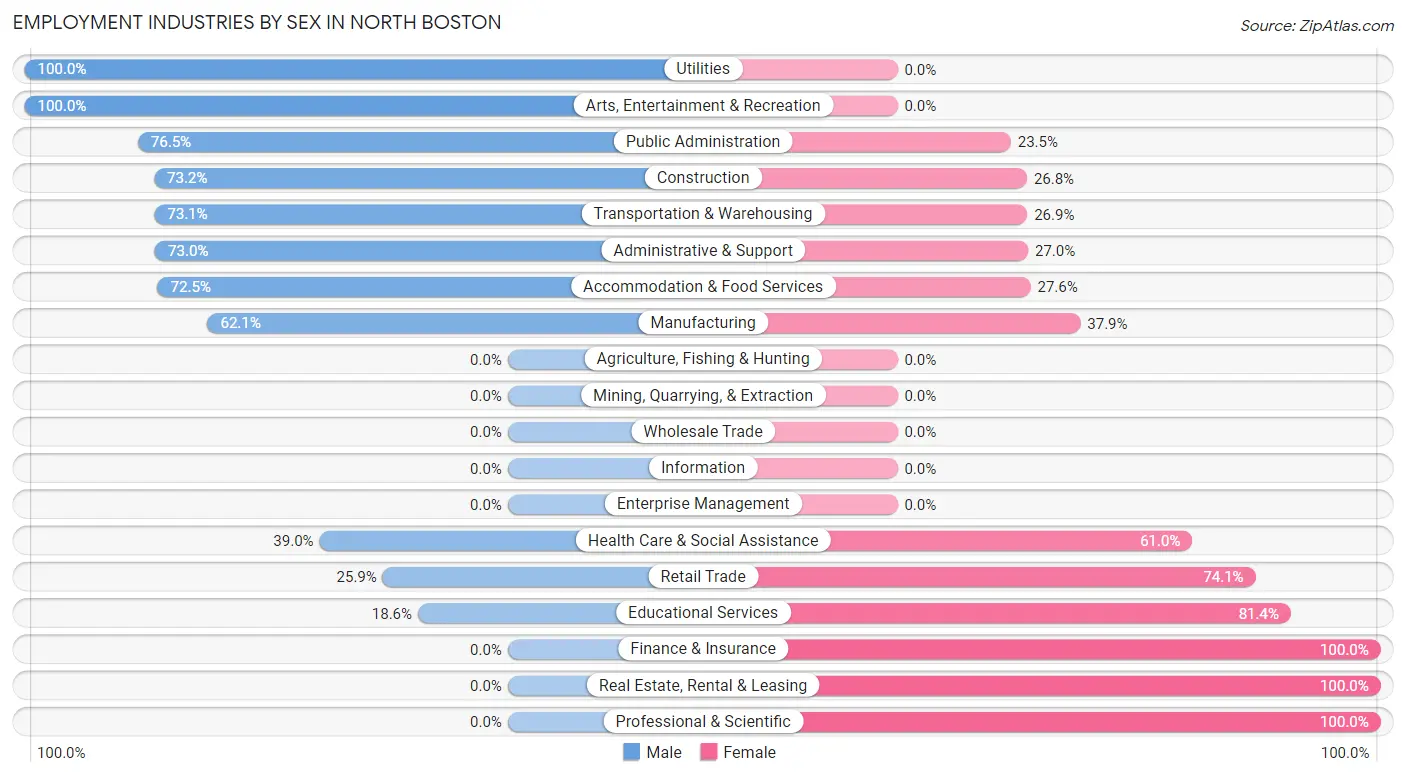
Employment Industries by Sex in North Boston
The North Boston industries that see more men than women are Utilities (100.0%), Arts, Entertainment & Recreation (100.0%), and Public Administration (76.5%), whereas the industries that tend to have a higher number of women are Finance & Insurance (100.0%), Real Estate, Rental & Leasing (100.0%), and Professional & Scientific (100.0%).
| Industry | Male | Female |
| Agriculture, Fishing & Hunting | 0 (0.0%) | 0 (0.0%) |
| Mining, Quarrying, & Extraction | 0 (0.0%) | 0 (0.0%) |
| Construction | 101 (73.2%) | 37 (26.8%) |
| Manufacturing | 105 (62.1%) | 64 (37.9%) |
| Wholesale Trade | 0 (0.0%) | 0 (0.0%) |
| Retail Trade | 65 (25.9%) | 186 (74.1%) |
| Transportation & Warehousing | 49 (73.1%) | 18 (26.9%) |
| Utilities | 24 (100.0%) | 0 (0.0%) |
| Information | 0 (0.0%) | 0 (0.0%) |
| Finance & Insurance | 0 (0.0%) | 59 (100.0%) |
| Real Estate, Rental & Leasing | 0 (0.0%) | 12 (100.0%) |
| Professional & Scientific | 0 (0.0%) | 53 (100.0%) |
| Enterprise Management | 0 (0.0%) | 0 (0.0%) |
| Administrative & Support | 27 (73.0%) | 10 (27.0%) |
| Educational Services | 16 (18.6%) | 70 (81.4%) |
| Health Care & Social Assistance | 69 (39.0%) | 108 (61.0%) |
| Arts, Entertainment & Recreation | 39 (100.0%) | 0 (0.0%) |
| Accommodation & Food Services | 71 (72.5%) | 27 (27.6%) |
| Public Administration | 62 (76.5%) | 19 (23.5%) |
| Total | 649 (49.2%) | 671 (50.8%) |
Education in North Boston
School Enrollment in North Boston
The most common levels of schooling among the 410 students in North Boston are high school (175 | 42.7%), college / undergraduate (96 | 23.4%), and elementary school (54 | 13.2%).
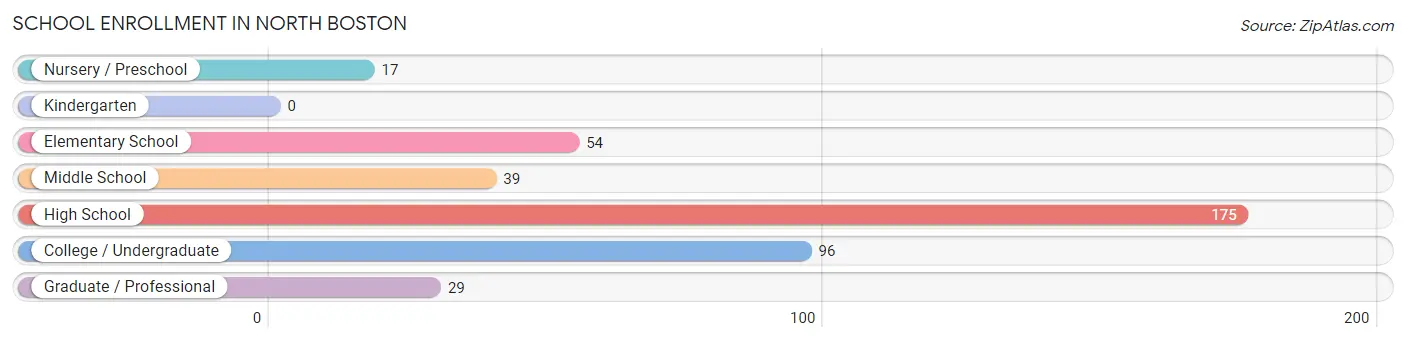
| School Level | # Students | % Students |
| Nursery / Preschool | 17 | 4.2% |
| Kindergarten | 0 | 0.0% |
| Elementary School | 54 | 13.2% |
| Middle School | 39 | 9.5% |
| High School | 175 | 42.7% |
| College / Undergraduate | 96 | 23.4% |
| Graduate / Professional | 29 | 7.1% |
| Total | 410 | 100.0% |
School Enrollment by Age by Funding Source in North Boston
Out of a total of 410 students who are enrolled in schools in North Boston, 97 (23.7%) attend a private institution, while the remaining 313 (76.3%) are enrolled in public schools. The age group of 3 to 4 year olds has the highest likelihood of being enrolled in private schools, with 17 (100.0% in the age bracket) enrolled. Conversely, the age group of 10 to 14 year olds has the lowest likelihood of being enrolled in a private school, with 39 (100.0% in the age bracket) attending a public institution.
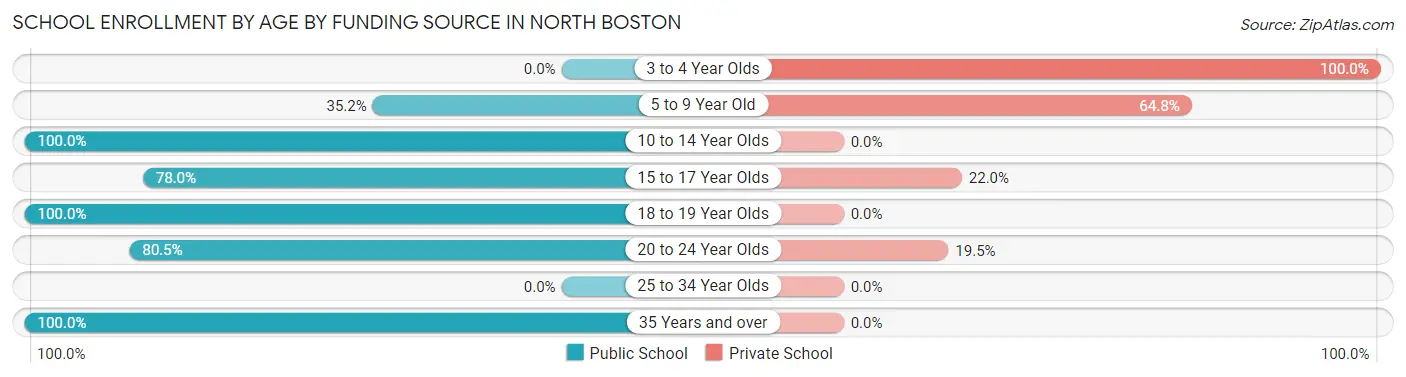
| Age Bracket | Public School | Private School |
| 3 to 4 Year Olds | 0 (0.0%) | 17 (100.0%) |
| 5 to 9 Year Old | 19 (35.2%) | 35 (64.8%) |
| 10 to 14 Year Olds | 39 (100.0%) | 0 (0.0%) |
| 15 to 17 Year Olds | 131 (78.0%) | 37 (22.0%) |
| 18 to 19 Year Olds | 83 (100.0%) | 0 (0.0%) |
| 20 to 24 Year Olds | 33 (80.5%) | 8 (19.5%) |
| 25 to 34 Year Olds | 0 (0.0%) | 0 (0.0%) |
| 35 Years and over | 8 (100.0%) | 0 (0.0%) |
| Total | 313 (76.3%) | 97 (23.7%) |
Educational Attainment by Field of Study in North Boston
Business (166 | 32.9%), science & technology (96 | 19.1%), education (84 | 16.7%), engineering (42 | 8.3%), and bio, nature & agricultural (39 | 7.7%) are the most common fields of study among 504 individuals in North Boston who have obtained a bachelor's degree or higher.
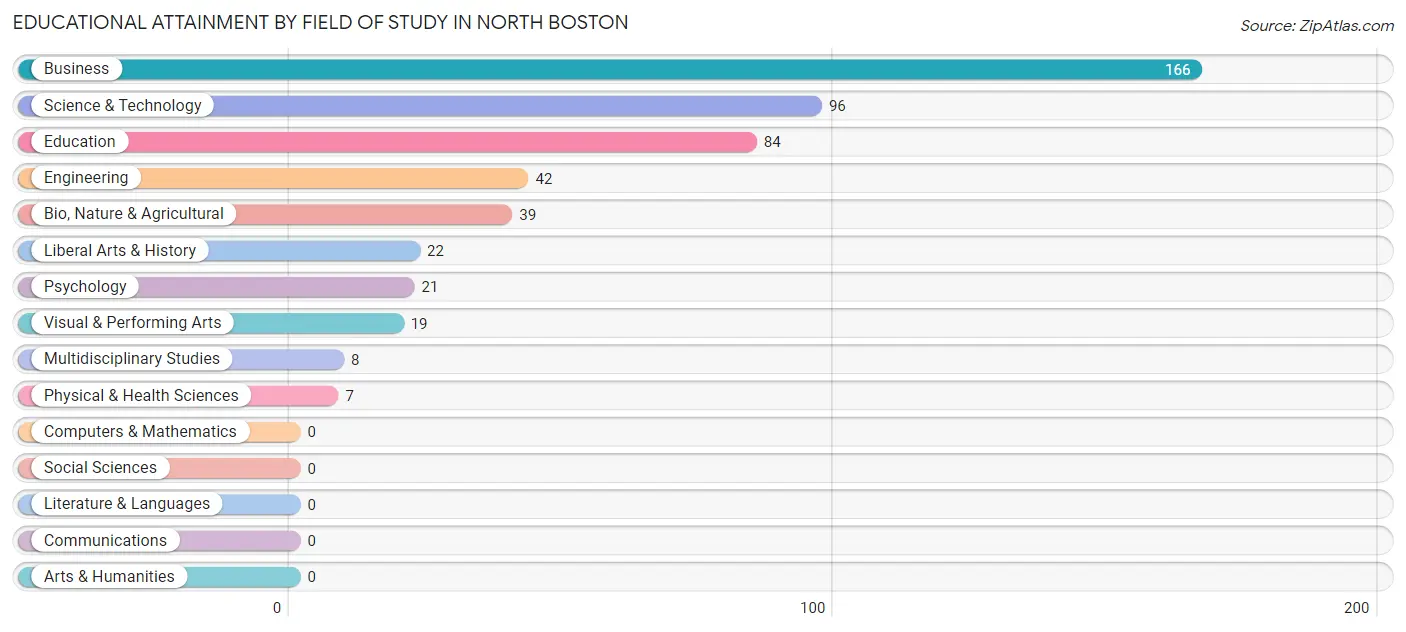
| Field of Study | # Graduates | % Graduates |
| Computers & Mathematics | 0 | 0.0% |
| Bio, Nature & Agricultural | 39 | 7.7% |
| Physical & Health Sciences | 7 | 1.4% |
| Psychology | 21 | 4.2% |
| Social Sciences | 0 | 0.0% |
| Engineering | 42 | 8.3% |
| Multidisciplinary Studies | 8 | 1.6% |
| Science & Technology | 96 | 19.1% |
| Business | 166 | 32.9% |
| Education | 84 | 16.7% |
| Literature & Languages | 0 | 0.0% |
| Liberal Arts & History | 22 | 4.4% |
| Visual & Performing Arts | 19 | 3.8% |
| Communications | 0 | 0.0% |
| Arts & Humanities | 0 | 0.0% |
| Total | 504 | 100.0% |
Transportation & Commute in North Boston
Vehicle Availability by Sex in North Boston
The most prevalent vehicle ownership categories in North Boston are males with 2 vehicles (274, accounting for 42.2%) and females with 2 vehicles (181, making up 40.8%).
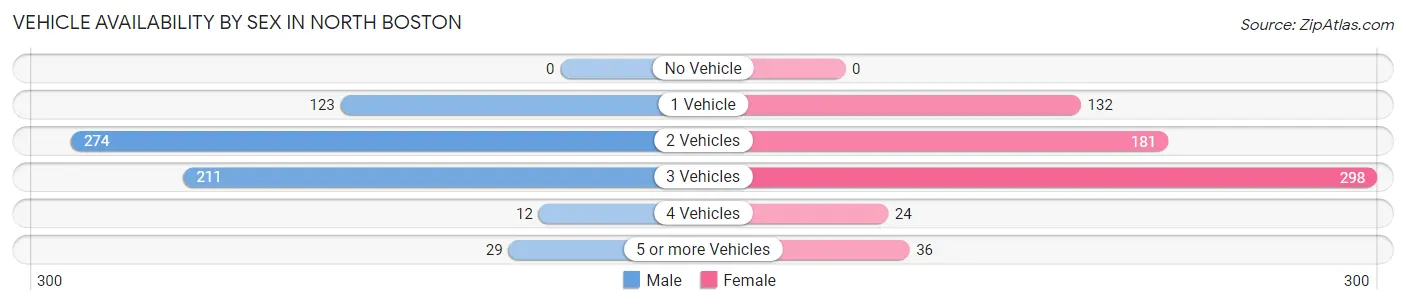
| Vehicles Available | Male | Female |
| No Vehicle | 0 (0.0%) | 0 (0.0%) |
| 1 Vehicle | 123 (19.0%) | 132 (19.7%) |
| 2 Vehicles | 274 (42.2%) | 181 (27.0%) |
| 3 Vehicles | 211 (32.5%) | 298 (44.4%) |
| 4 Vehicles | 12 (1.8%) | 24 (3.6%) |
| 5 or more Vehicles | 29 (4.5%) | 36 (5.4%) |
| Total | 649 (100.0%) | 671 (100.0%) |
Commute Time in North Boston
The most frequently occuring commute durations in North Boston are 30 to 34 minutes (280 commuters, 23.2%), 15 to 19 minutes (245 commuters, 20.3%), and 10 to 14 minutes (244 commuters, 20.2%).
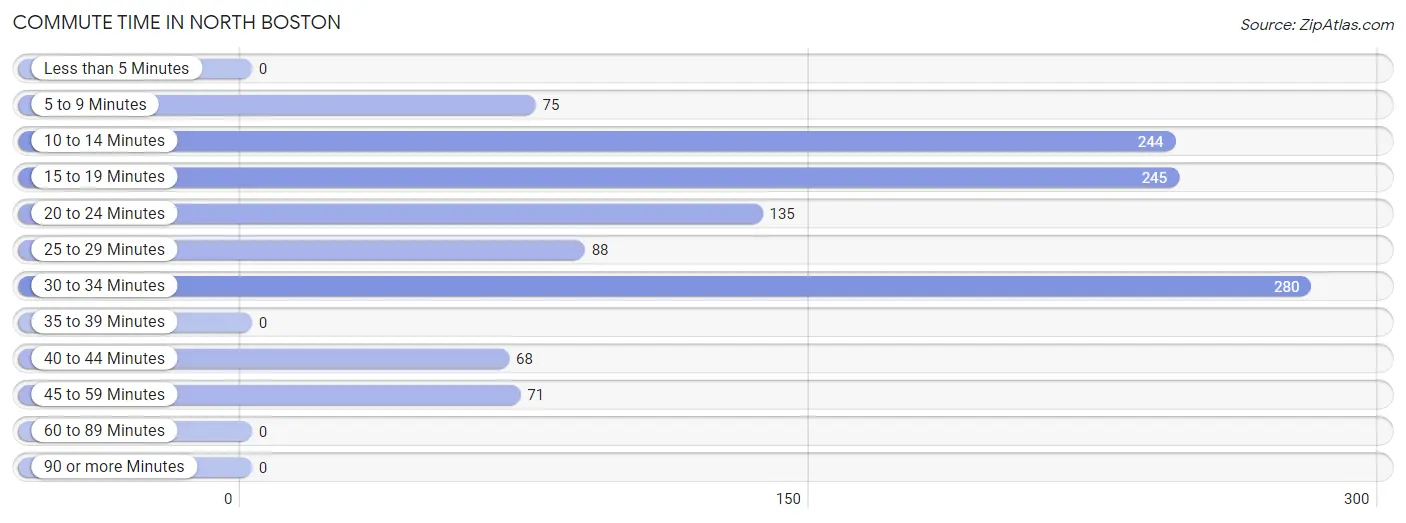
| Commute Time | # Commuters | % Commuters |
| Less than 5 Minutes | 0 | 0.0% |
| 5 to 9 Minutes | 75 | 6.2% |
| 10 to 14 Minutes | 244 | 20.2% |
| 15 to 19 Minutes | 245 | 20.3% |
| 20 to 24 Minutes | 135 | 11.2% |
| 25 to 29 Minutes | 88 | 7.3% |
| 30 to 34 Minutes | 280 | 23.2% |
| 35 to 39 Minutes | 0 | 0.0% |
| 40 to 44 Minutes | 68 | 5.6% |
| 45 to 59 Minutes | 71 | 5.9% |
| 60 to 89 Minutes | 0 | 0.0% |
| 90 or more Minutes | 0 | 0.0% |
Commute Time by Sex in North Boston
The most common commute times in North Boston are 15 to 19 minutes (168 commuters, 25.9%) for males and 30 to 34 minutes (145 commuters, 26.0%) for females.
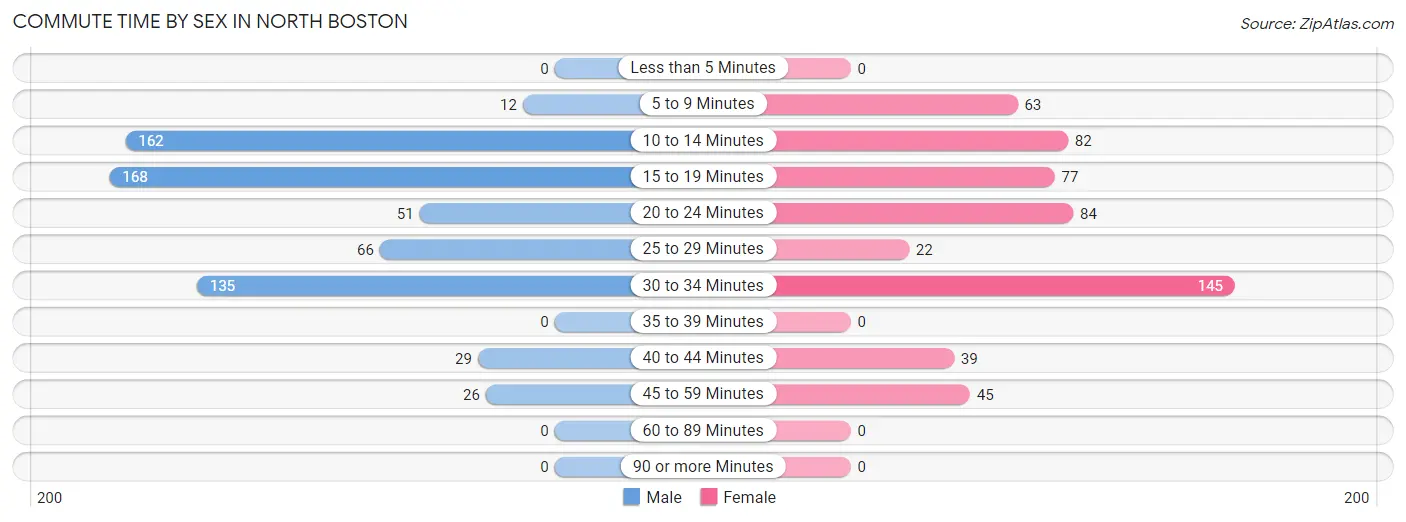
| Commute Time | Male | Female |
| Less than 5 Minutes | 0 (0.0%) | 0 (0.0%) |
| 5 to 9 Minutes | 12 (1.8%) | 63 (11.3%) |
| 10 to 14 Minutes | 162 (25.0%) | 82 (14.7%) |
| 15 to 19 Minutes | 168 (25.9%) | 77 (13.8%) |
| 20 to 24 Minutes | 51 (7.9%) | 84 (15.1%) |
| 25 to 29 Minutes | 66 (10.2%) | 22 (4.0%) |
| 30 to 34 Minutes | 135 (20.8%) | 145 (26.0%) |
| 35 to 39 Minutes | 0 (0.0%) | 0 (0.0%) |
| 40 to 44 Minutes | 29 (4.5%) | 39 (7.0%) |
| 45 to 59 Minutes | 26 (4.0%) | 45 (8.1%) |
| 60 to 89 Minutes | 0 (0.0%) | 0 (0.0%) |
| 90 or more Minutes | 0 (0.0%) | 0 (0.0%) |
Time of Departure to Work by Sex in North Boston
The most frequent times of departure to work in North Boston are 6:30 AM to 6:59 AM (201, 31.0%) for males and 6:30 AM to 6:59 AM (213, 38.2%) for females.
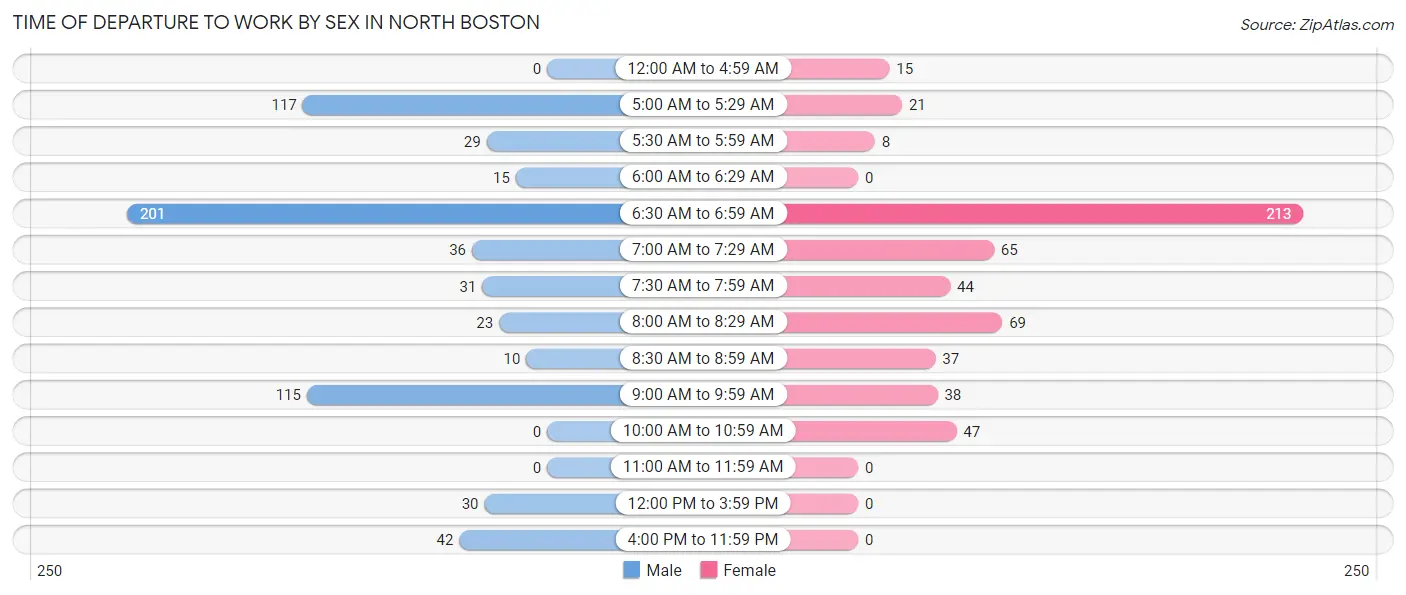
| Time of Departure | Male | Female |
| 12:00 AM to 4:59 AM | 0 (0.0%) | 15 (2.7%) |
| 5:00 AM to 5:29 AM | 117 (18.0%) | 21 (3.8%) |
| 5:30 AM to 5:59 AM | 29 (4.5%) | 8 (1.4%) |
| 6:00 AM to 6:29 AM | 15 (2.3%) | 0 (0.0%) |
| 6:30 AM to 6:59 AM | 201 (31.0%) | 213 (38.2%) |
| 7:00 AM to 7:29 AM | 36 (5.6%) | 65 (11.7%) |
| 7:30 AM to 7:59 AM | 31 (4.8%) | 44 (7.9%) |
| 8:00 AM to 8:29 AM | 23 (3.5%) | 69 (12.4%) |
| 8:30 AM to 8:59 AM | 10 (1.5%) | 37 (6.6%) |
| 9:00 AM to 9:59 AM | 115 (17.7%) | 38 (6.8%) |
| 10:00 AM to 10:59 AM | 0 (0.0%) | 47 (8.4%) |
| 11:00 AM to 11:59 AM | 0 (0.0%) | 0 (0.0%) |
| 12:00 PM to 3:59 PM | 30 (4.6%) | 0 (0.0%) |
| 4:00 PM to 11:59 PM | 42 (6.5%) | 0 (0.0%) |
| Total | 649 (100.0%) | 557 (100.0%) |
Housing Occupancy in North Boston
Occupancy by Ownership in North Boston
Of the total 1,315 dwellings in North Boston, owner-occupied units account for 1,003 (76.3%), while renter-occupied units make up 312 (23.7%).
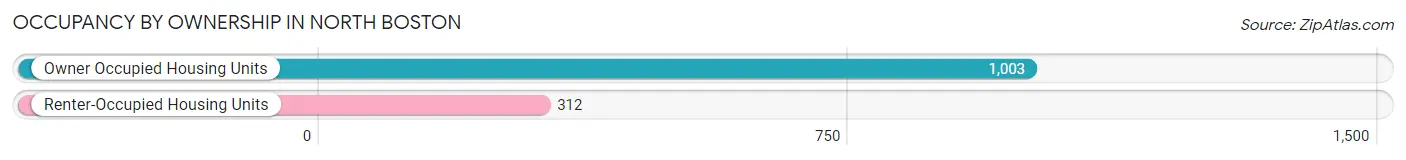
| Occupancy | # Housing Units | % Housing Units |
| Owner Occupied Housing Units | 1,003 | 76.3% |
| Renter-Occupied Housing Units | 312 | 23.7% |
| Total Occupied Housing Units | 1,315 | 100.0% |
Occupancy by Household Size in North Boston
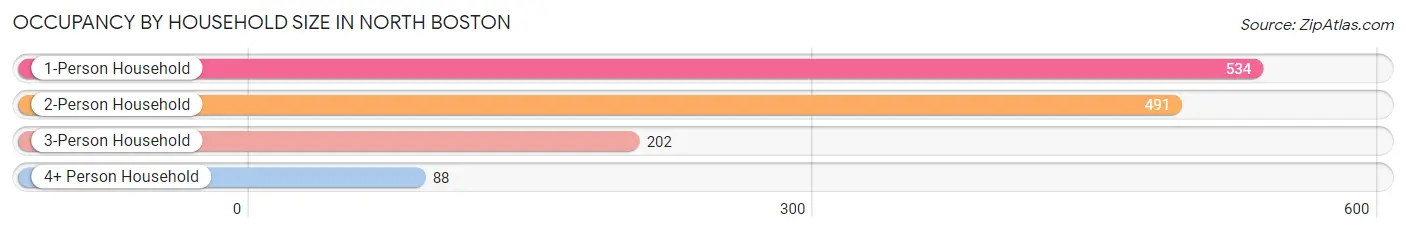
| Household Size | # Housing Units | % Housing Units |
| 1-Person Household | 534 | 40.6% |
| 2-Person Household | 491 | 37.3% |
| 3-Person Household | 202 | 15.4% |
| 4+ Person Household | 88 | 6.7% |
| Total Housing Units | 1,315 | 100.0% |
Occupancy by Ownership by Household Size in North Boston
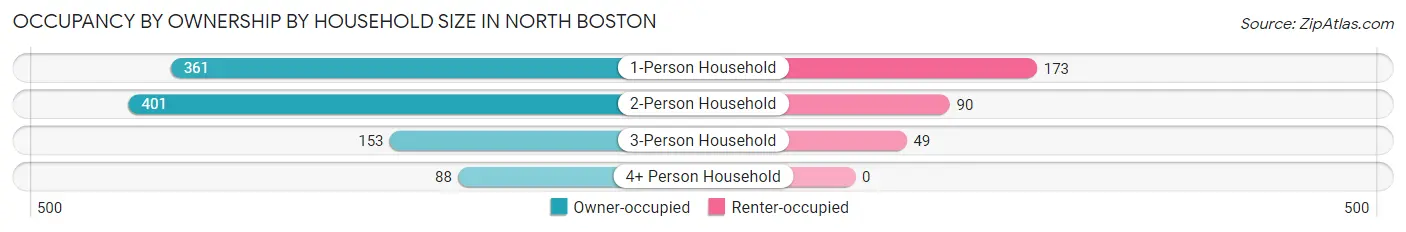
| Household Size | Owner-occupied | Renter-occupied |
| 1-Person Household | 361 (67.6%) | 173 (32.4%) |
| 2-Person Household | 401 (81.7%) | 90 (18.3%) |
| 3-Person Household | 153 (75.7%) | 49 (24.3%) |
| 4+ Person Household | 88 (100.0%) | 0 (0.0%) |
| Total Housing Units | 1,003 (76.3%) | 312 (23.7%) |
Occupancy by Educational Attainment in North Boston
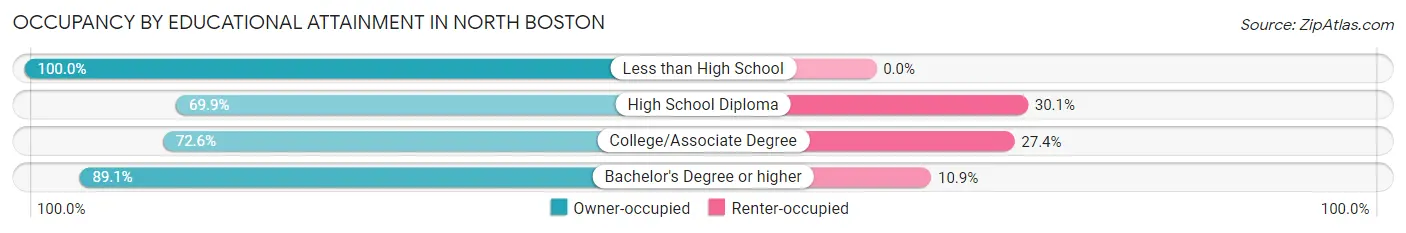
| Household Size | Owner-occupied | Renter-occupied |
| Less than High School | 38 (100.0%) | 0 (0.0%) |
| High School Diploma | 242 (69.9%) | 104 (30.1%) |
| College/Associate Degree | 469 (72.6%) | 177 (27.4%) |
| Bachelor's Degree or higher | 254 (89.1%) | 31 (10.9%) |
Occupancy by Age of Householder in North Boston
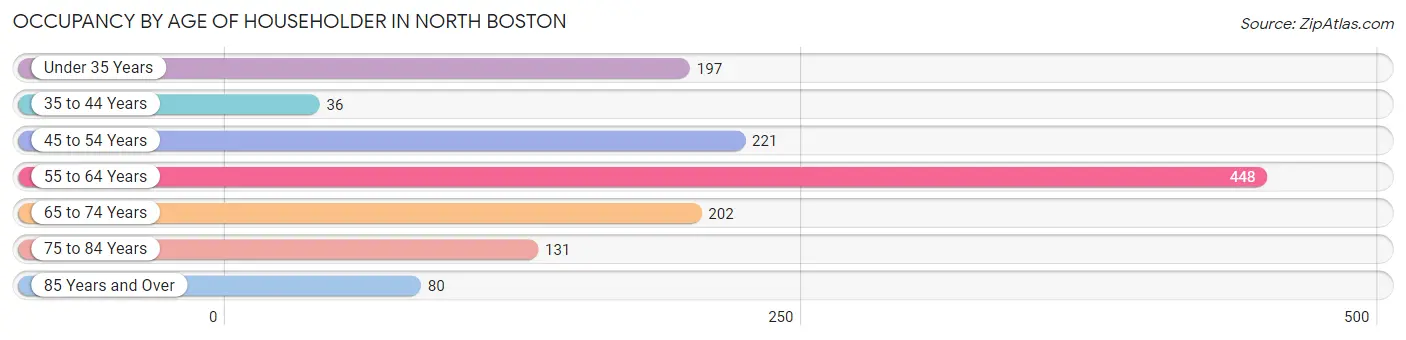
| Age Bracket | # Households | % Households |
| Under 35 Years | 197 | 15.0% |
| 35 to 44 Years | 36 | 2.7% |
| 45 to 54 Years | 221 | 16.8% |
| 55 to 64 Years | 448 | 34.1% |
| 65 to 74 Years | 202 | 15.4% |
| 75 to 84 Years | 131 | 10.0% |
| 85 Years and Over | 80 | 6.1% |
| Total | 1,315 | 100.0% |
Housing Finances in North Boston
Median Income by Occupancy in North Boston
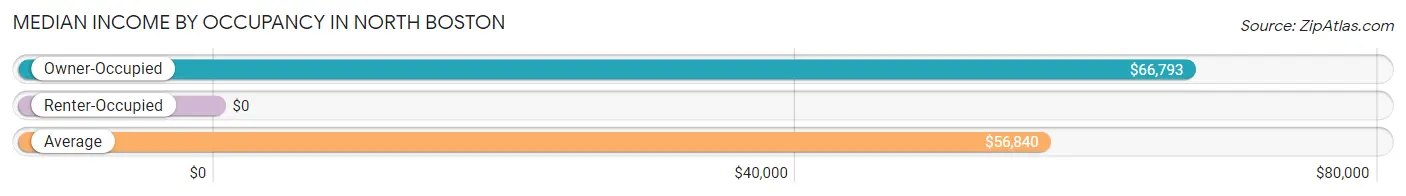
| Occupancy Type | # Households | Median Income |
| Owner-Occupied | 1,003 (76.3%) | $66,793 |
| Renter-Occupied | 312 (23.7%) | $0 |
| Average | 1,315 (100.0%) | $56,840 |
Occupancy by Householder Income Bracket in North Boston
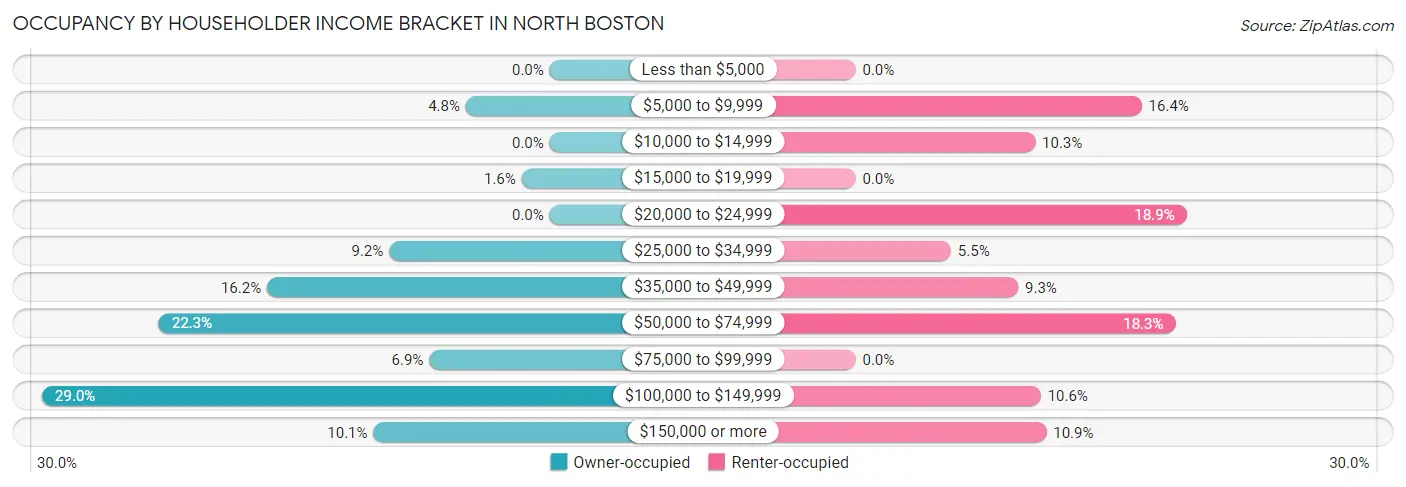
| Income Bracket | Owner-occupied | Renter-occupied |
| Less than $5,000 | 0 (0.0%) | 0 (0.0%) |
| $5,000 to $9,999 | 48 (4.8%) | 51 (16.4%) |
| $10,000 to $14,999 | 0 (0.0%) | 32 (10.3%) |
| $15,000 to $19,999 | 16 (1.6%) | 0 (0.0%) |
| $20,000 to $24,999 | 0 (0.0%) | 59 (18.9%) |
| $25,000 to $34,999 | 92 (9.2%) | 17 (5.4%) |
| $35,000 to $49,999 | 162 (16.2%) | 29 (9.3%) |
| $50,000 to $74,999 | 224 (22.3%) | 57 (18.3%) |
| $75,000 to $99,999 | 69 (6.9%) | 0 (0.0%) |
| $100,000 to $149,999 | 291 (29.0%) | 33 (10.6%) |
| $150,000 or more | 101 (10.1%) | 34 (10.9%) |
| Total | 1,003 (100.0%) | 312 (100.0%) |
Monthly Housing Cost Tiers in North Boston
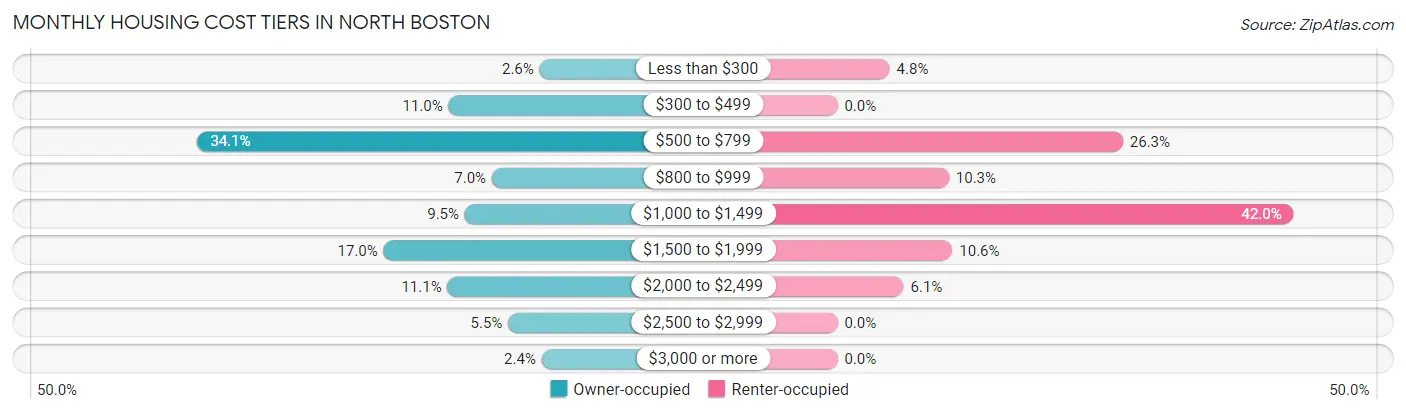
| Monthly Cost | Owner-occupied | Renter-occupied |
| Less than $300 | 26 (2.6%) | 15 (4.8%) |
| $300 to $499 | 110 (11.0%) | 0 (0.0%) |
| $500 to $799 | 342 (34.1%) | 82 (26.3%) |
| $800 to $999 | 70 (7.0%) | 32 (10.3%) |
| $1,000 to $1,499 | 95 (9.5%) | 131 (42.0%) |
| $1,500 to $1,999 | 170 (17.0%) | 33 (10.6%) |
| $2,000 to $2,499 | 111 (11.1%) | 19 (6.1%) |
| $2,500 to $2,999 | 55 (5.5%) | 0 (0.0%) |
| $3,000 or more | 24 (2.4%) | 0 (0.0%) |
| Total | 1,003 (100.0%) | 312 (100.0%) |
Physical Housing Characteristics in North Boston
Housing Structures in North Boston
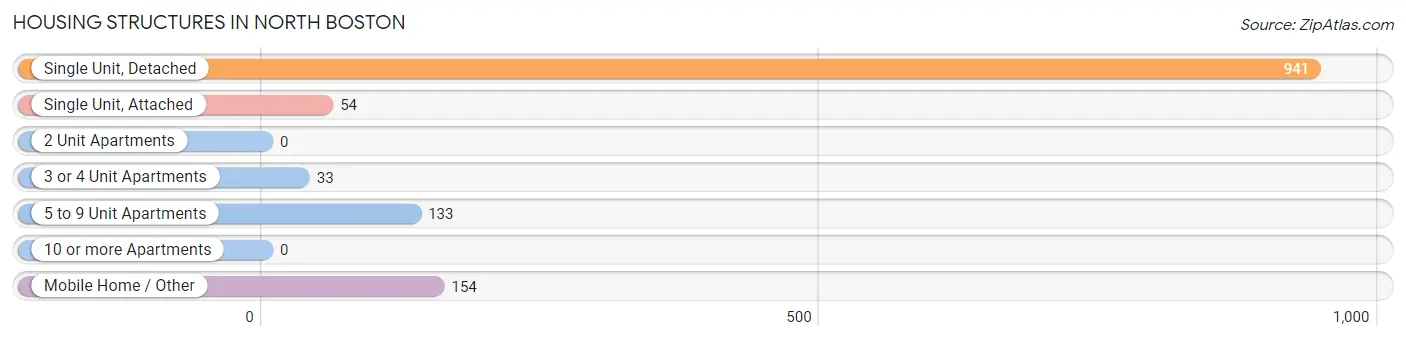
| Structure Type | # Housing Units | % Housing Units |
| Single Unit, Detached | 941 | 71.6% |
| Single Unit, Attached | 54 | 4.1% |
| 2 Unit Apartments | 0 | 0.0% |
| 3 or 4 Unit Apartments | 33 | 2.5% |
| 5 to 9 Unit Apartments | 133 | 10.1% |
| 10 or more Apartments | 0 | 0.0% |
| Mobile Home / Other | 154 | 11.7% |
| Total | 1,315 | 100.0% |
Housing Structures by Occupancy in North Boston
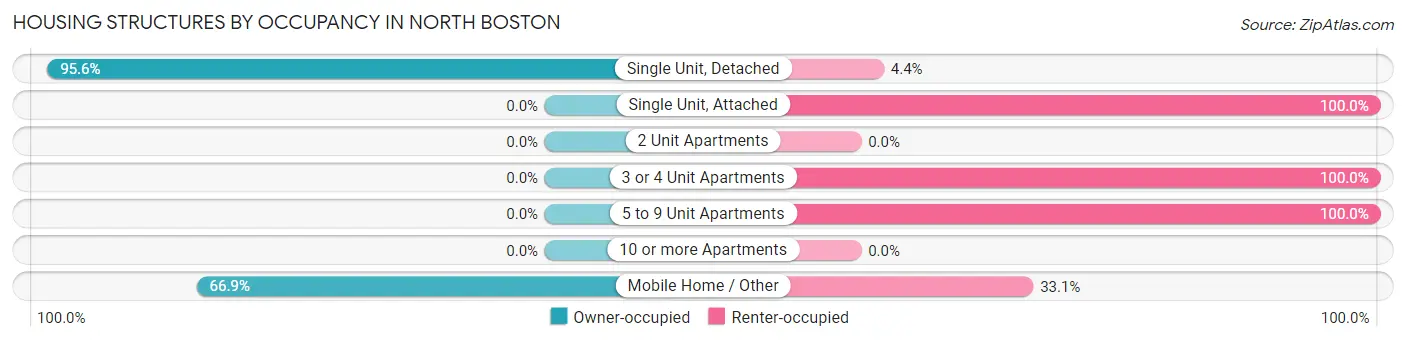
| Structure Type | Owner-occupied | Renter-occupied |
| Single Unit, Detached | 900 (95.6%) | 41 (4.4%) |
| Single Unit, Attached | 0 (0.0%) | 54 (100.0%) |
| 2 Unit Apartments | 0 (0.0%) | 0 (0.0%) |
| 3 or 4 Unit Apartments | 0 (0.0%) | 33 (100.0%) |
| 5 to 9 Unit Apartments | 0 (0.0%) | 133 (100.0%) |
| 10 or more Apartments | 0 (0.0%) | 0 (0.0%) |
| Mobile Home / Other | 103 (66.9%) | 51 (33.1%) |
| Total | 1,003 (76.3%) | 312 (23.7%) |
Housing Structures by Number of Rooms in North Boston
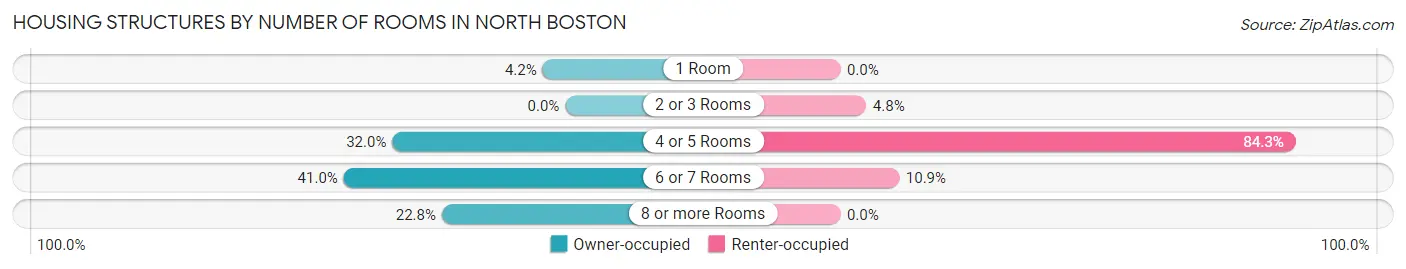
| Number of Rooms | Owner-occupied | Renter-occupied |
| 1 Room | 42 (4.2%) | 0 (0.0%) |
| 2 or 3 Rooms | 0 (0.0%) | 15 (4.8%) |
| 4 or 5 Rooms | 321 (32.0%) | 263 (84.3%) |
| 6 or 7 Rooms | 411 (41.0%) | 34 (10.9%) |
| 8 or more Rooms | 229 (22.8%) | 0 (0.0%) |
| Total | 1,003 (100.0%) | 312 (100.0%) |
Housing Structure by Heating Type in North Boston
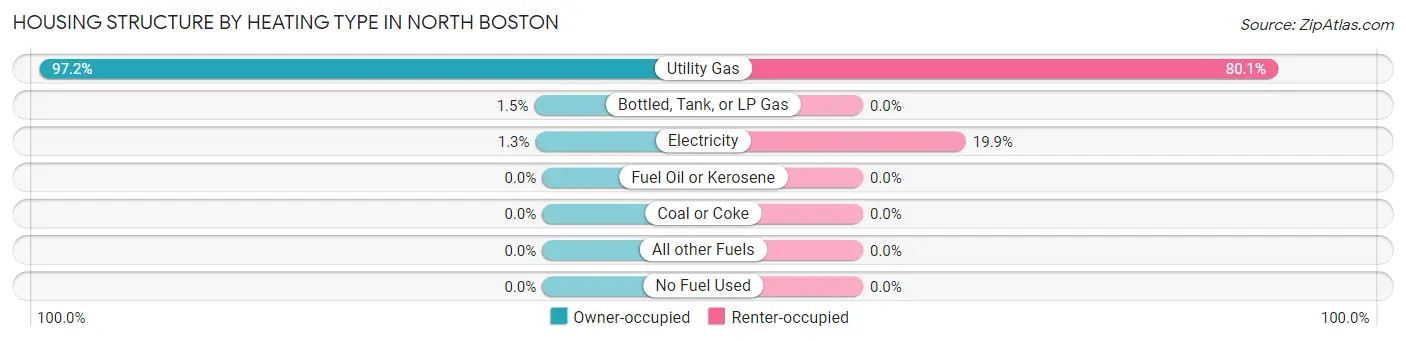
| Heating Type | Owner-occupied | Renter-occupied |
| Utility Gas | 975 (97.2%) | 250 (80.1%) |
| Bottled, Tank, or LP Gas | 15 (1.5%) | 0 (0.0%) |
| Electricity | 13 (1.3%) | 62 (19.9%) |
| Fuel Oil or Kerosene | 0 (0.0%) | 0 (0.0%) |
| Coal or Coke | 0 (0.0%) | 0 (0.0%) |
| All other Fuels | 0 (0.0%) | 0 (0.0%) |
| No Fuel Used | 0 (0.0%) | 0 (0.0%) |
| Total | 1,003 (100.0%) | 312 (100.0%) |
Household Vehicle Usage in North Boston
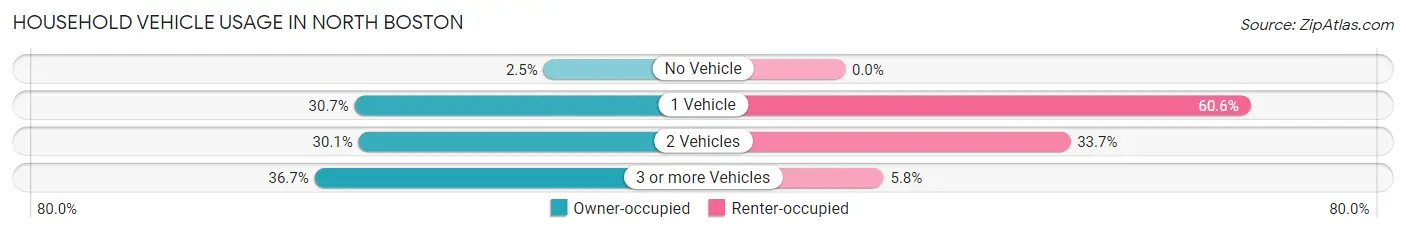
| Vehicles per Household | Owner-occupied | Renter-occupied |
| No Vehicle | 25 (2.5%) | 0 (0.0%) |
| 1 Vehicle | 308 (30.7%) | 189 (60.6%) |
| 2 Vehicles | 302 (30.1%) | 105 (33.7%) |
| 3 or more Vehicles | 368 (36.7%) | 18 (5.8%) |
| Total | 1,003 (100.0%) | 312 (100.0%) |
Real Estate & Mortgages in North Boston
Real Estate and Mortgage Overview in North Boston
| Characteristic | Without Mortgage | With Mortgage |
| Housing Units | 497 | 506 |
| Median Property Value | $147,500 | $244,400 |
| Median Household Income | $51,528 | $61 |
| Monthly Housing Costs | $574 | $24 |
| Real Estate Taxes | $3,938 | $14 |
Property Value by Mortgage Status in North Boston
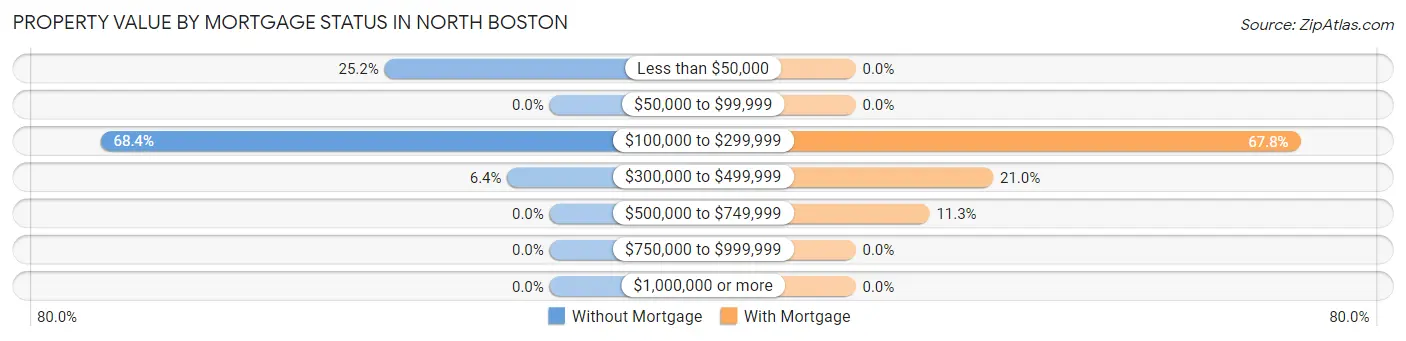
| Property Value | Without Mortgage | With Mortgage |
| Less than $50,000 | 125 (25.2%) | 0 (0.0%) |
| $50,000 to $99,999 | 0 (0.0%) | 0 (0.0%) |
| $100,000 to $299,999 | 340 (68.4%) | 343 (67.8%) |
| $300,000 to $499,999 | 32 (6.4%) | 106 (20.9%) |
| $500,000 to $749,999 | 0 (0.0%) | 57 (11.3%) |
| $750,000 to $999,999 | 0 (0.0%) | 0 (0.0%) |
| $1,000,000 or more | 0 (0.0%) | 0 (0.0%) |
| Total | 497 (100.0%) | 506 (100.0%) |
Household Income by Mortgage Status in North Boston
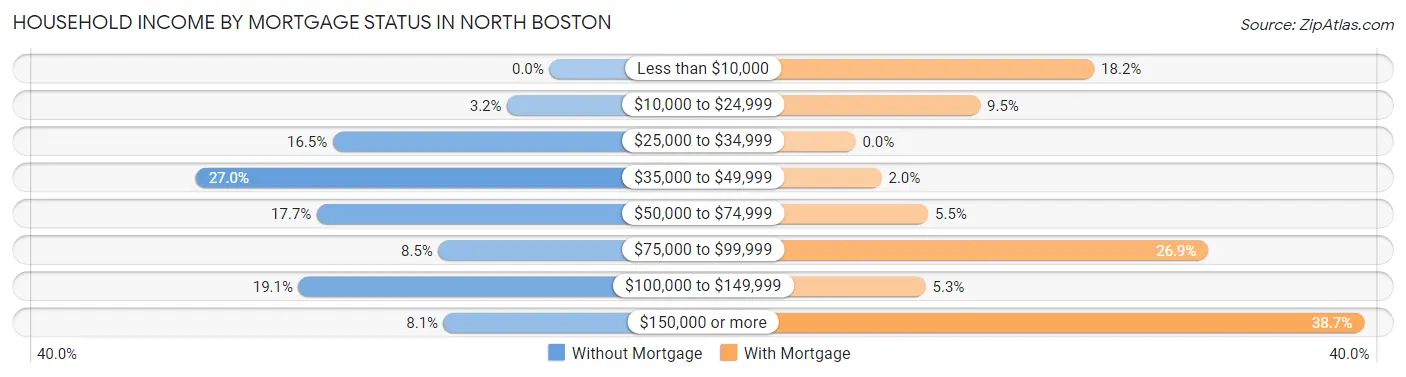
| Household Income | Without Mortgage | With Mortgage |
| Less than $10,000 | 0 (0.0%) | 92 (18.2%) |
| $10,000 to $24,999 | 16 (3.2%) | 48 (9.5%) |
| $25,000 to $34,999 | 82 (16.5%) | 0 (0.0%) |
| $35,000 to $49,999 | 134 (27.0%) | 10 (2.0%) |
| $50,000 to $74,999 | 88 (17.7%) | 28 (5.5%) |
| $75,000 to $99,999 | 42 (8.5%) | 136 (26.9%) |
| $100,000 to $149,999 | 95 (19.1%) | 27 (5.3%) |
| $150,000 or more | 40 (8.1%) | 196 (38.7%) |
| Total | 497 (100.0%) | 506 (100.0%) |
Property Value to Household Income Ratio in North Boston
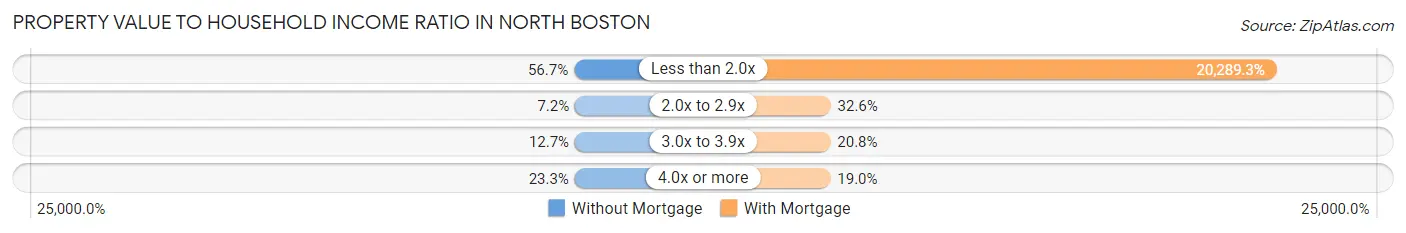
| Value-to-Income Ratio | Without Mortgage | With Mortgage |
| Less than 2.0x | 282 (56.7%) | 102,664 (20,289.3%) |
| 2.0x to 2.9x | 36 (7.2%) | 165 (32.6%) |
| 3.0x to 3.9x | 63 (12.7%) | 105 (20.7%) |
| 4.0x or more | 116 (23.3%) | 96 (19.0%) |
| Total | 497 (100.0%) | 506 (100.0%) |
Real Estate Taxes by Mortgage Status in North Boston
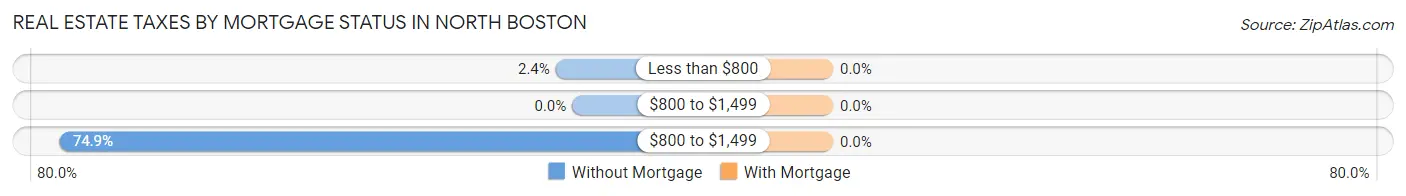
| Property Taxes | Without Mortgage | With Mortgage |
| Less than $800 | 12 (2.4%) | 0 (0.0%) |
| $800 to $1,499 | 0 (0.0%) | 0 (0.0%) |
| $800 to $1,499 | 372 (74.9%) | 0 (0.0%) |
| Total | 497 (100.0%) | 506 (100.0%) |
Health & Disability in North Boston
Health Insurance Coverage by Age in North Boston
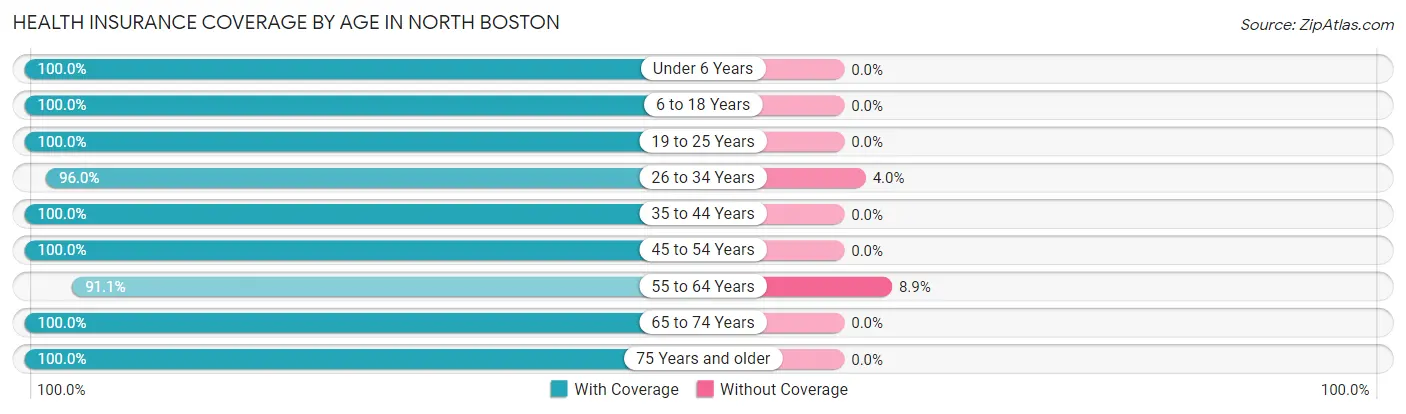
| Age Bracket | With Coverage | Without Coverage |
| Under 6 Years | 40 (100.0%) | 0 (0.0%) |
| 6 to 18 Years | 321 (100.0%) | 0 (0.0%) |
| 19 to 25 Years | 203 (100.0%) | 0 (0.0%) |
| 26 to 34 Years | 192 (96.0%) | 8 (4.0%) |
| 35 to 44 Years | 141 (100.0%) | 0 (0.0%) |
| 45 to 54 Years | 293 (100.0%) | 0 (0.0%) |
| 55 to 64 Years | 717 (91.1%) | 70 (8.9%) |
| 65 to 74 Years | 259 (100.0%) | 0 (0.0%) |
| 75 Years and older | 310 (100.0%) | 0 (0.0%) |
| Total | 2,476 (97.0%) | 78 (3.0%) |
Health Insurance Coverage by Citizenship Status in North Boston
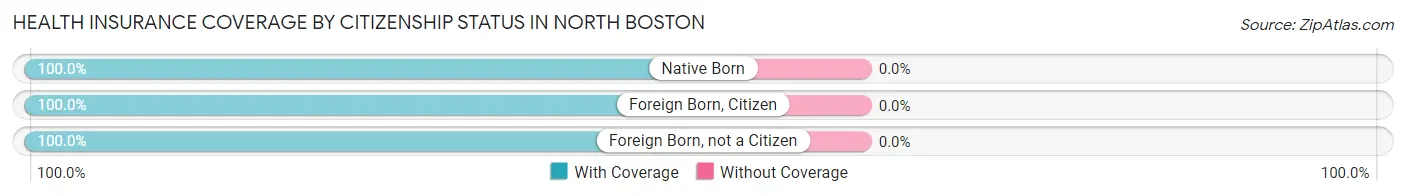
| Citizenship Status | With Coverage | Without Coverage |
| Native Born | 40 (100.0%) | 0 (0.0%) |
| Foreign Born, Citizen | 321 (100.0%) | 0 (0.0%) |
| Foreign Born, not a Citizen | 203 (100.0%) | 0 (0.0%) |
Health Insurance Coverage by Household Income in North Boston
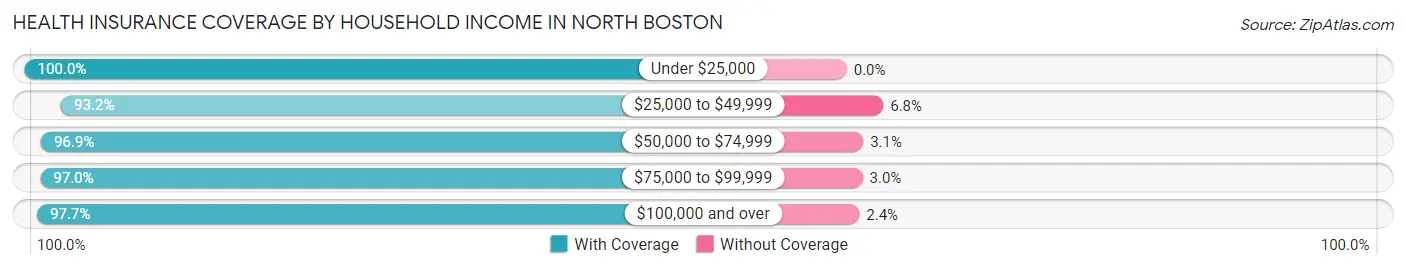
| Household Income | With Coverage | Without Coverage |
| Under $25,000 | 206 (100.0%) | 0 (0.0%) |
| $25,000 to $49,999 | 368 (93.2%) | 27 (6.8%) |
| $50,000 to $74,999 | 535 (96.9%) | 17 (3.1%) |
| $75,000 to $99,999 | 164 (97.0%) | 5 (3.0%) |
| $100,000 and over | 1,203 (97.7%) | 29 (2.4%) |
Public vs Private Health Insurance Coverage by Age in North Boston
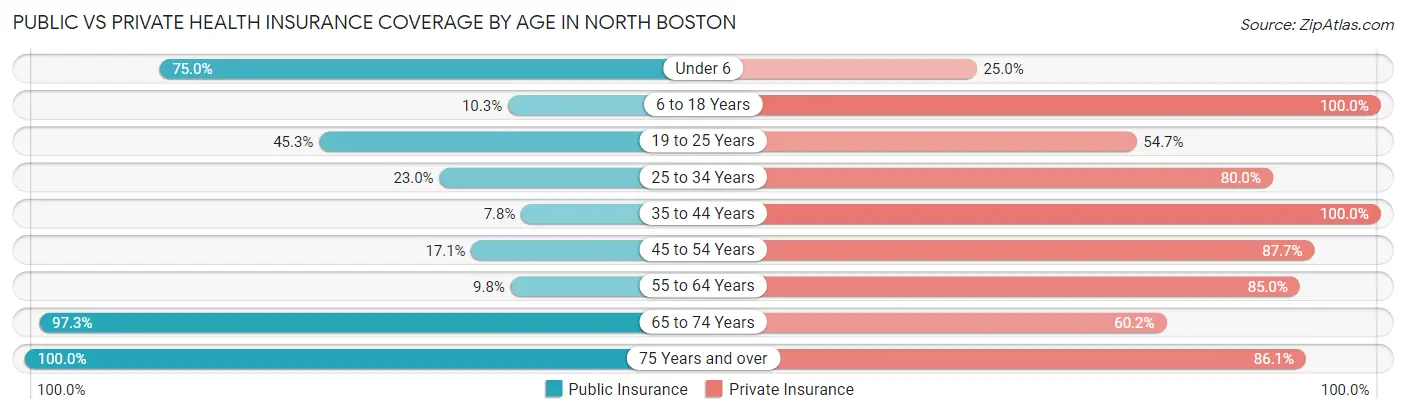
| Age Bracket | Public Insurance | Private Insurance |
| Under 6 | 30 (75.0%) | 10 (25.0%) |
| 6 to 18 Years | 33 (10.3%) | 321 (100.0%) |
| 19 to 25 Years | 92 (45.3%) | 111 (54.7%) |
| 25 to 34 Years | 46 (23.0%) | 160 (80.0%) |
| 35 to 44 Years | 11 (7.8%) | 141 (100.0%) |
| 45 to 54 Years | 50 (17.1%) | 257 (87.7%) |
| 55 to 64 Years | 77 (9.8%) | 669 (85.0%) |
| 65 to 74 Years | 252 (97.3%) | 156 (60.2%) |
| 75 Years and over | 310 (100.0%) | 267 (86.1%) |
| Total | 901 (35.3%) | 2,092 (81.9%) |
Disability Status by Sex by Age in North Boston
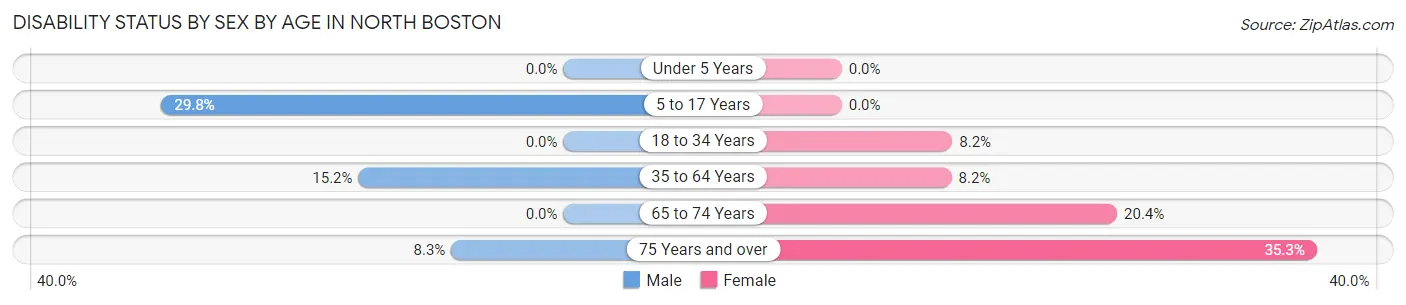
| Age Bracket | Male | Female |
| Under 5 Years | 0 (0.0%) | 0 (0.0%) |
| 5 to 17 Years | 37 (29.8%) | 0 (0.0%) |
| 18 to 34 Years | 0 (0.0%) | 17 (8.2%) |
| 35 to 64 Years | 98 (15.2%) | 47 (8.2%) |
| 65 to 74 Years | 0 (0.0%) | 28 (20.4%) |
| 75 Years and over | 10 (8.3%) | 67 (35.3%) |
Disability Class by Sex by Age in North Boston
Disability Class: Hearing Difficulty
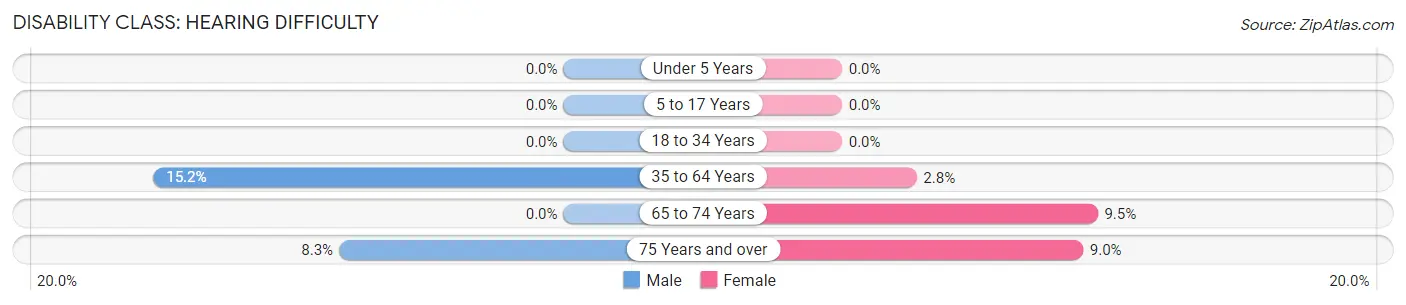
| Age Bracket | Male | Female |
| Under 5 Years | 0 (0.0%) | 0 (0.0%) |
| 5 to 17 Years | 0 (0.0%) | 0 (0.0%) |
| 18 to 34 Years | 0 (0.0%) | 0 (0.0%) |
| 35 to 64 Years | 98 (15.2%) | 16 (2.8%) |
| 65 to 74 Years | 0 (0.0%) | 13 (9.5%) |
| 75 Years and over | 10 (8.3%) | 17 (8.9%) |
Disability Class: Vision Difficulty
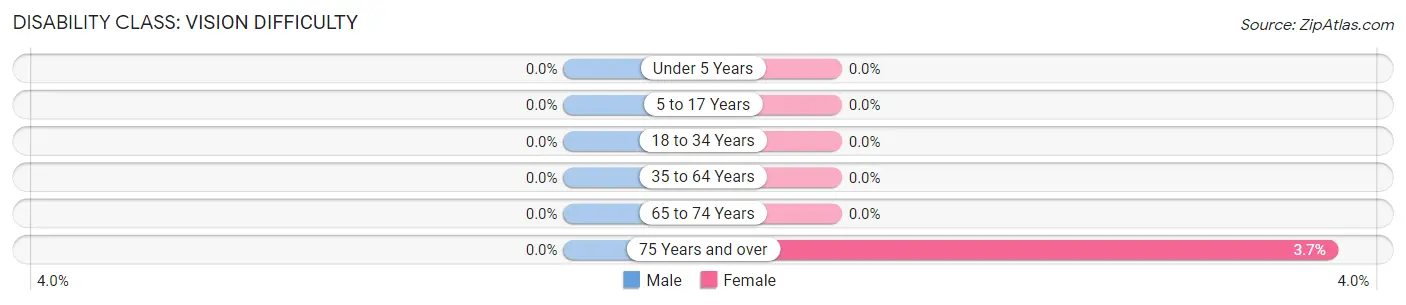
| Age Bracket | Male | Female |
| Under 5 Years | 0 (0.0%) | 0 (0.0%) |
| 5 to 17 Years | 0 (0.0%) | 0 (0.0%) |
| 18 to 34 Years | 0 (0.0%) | 0 (0.0%) |
| 35 to 64 Years | 0 (0.0%) | 0 (0.0%) |
| 65 to 74 Years | 0 (0.0%) | 0 (0.0%) |
| 75 Years and over | 0 (0.0%) | 7 (3.7%) |
Disability Class: Cognitive Difficulty
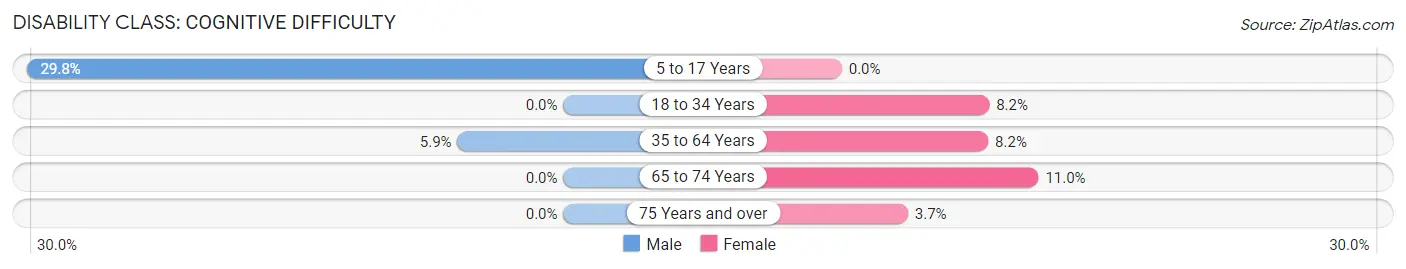
| Age Bracket | Male | Female |
| 5 to 17 Years | 37 (29.8%) | 0 (0.0%) |
| 18 to 34 Years | 0 (0.0%) | 17 (8.2%) |
| 35 to 64 Years | 38 (5.9%) | 47 (8.2%) |
| 65 to 74 Years | 0 (0.0%) | 15 (11.0%) |
| 75 Years and over | 0 (0.0%) | 7 (3.7%) |
Disability Class: Ambulatory Difficulty
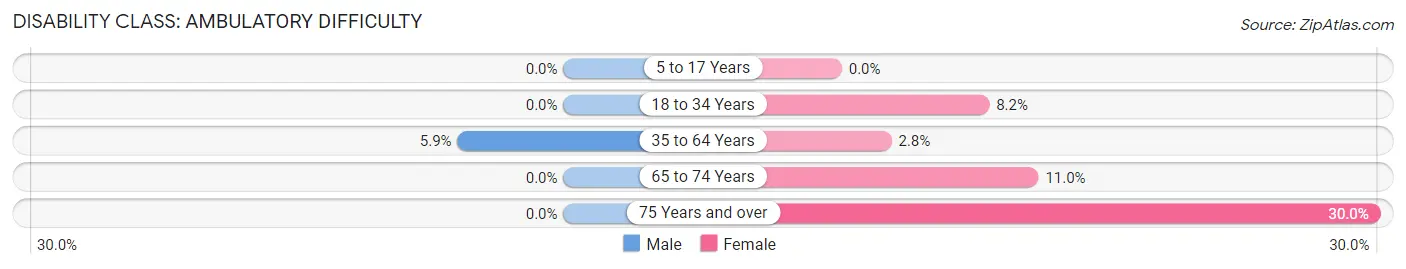
| Age Bracket | Male | Female |
| 5 to 17 Years | 0 (0.0%) | 0 (0.0%) |
| 18 to 34 Years | 0 (0.0%) | 17 (8.2%) |
| 35 to 64 Years | 38 (5.9%) | 16 (2.8%) |
| 65 to 74 Years | 0 (0.0%) | 15 (11.0%) |
| 75 Years and over | 0 (0.0%) | 57 (30.0%) |
Disability Class: Self-Care Difficulty
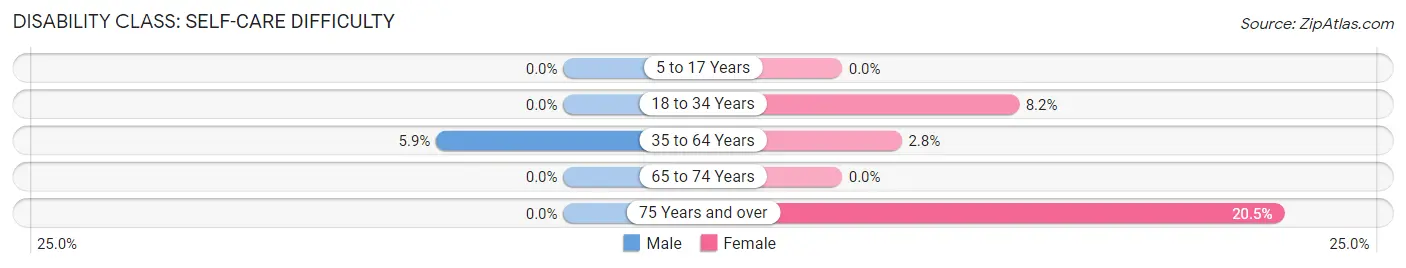
| Age Bracket | Male | Female |
| 5 to 17 Years | 0 (0.0%) | 0 (0.0%) |
| 18 to 34 Years | 0 (0.0%) | 17 (8.2%) |
| 35 to 64 Years | 38 (5.9%) | 16 (2.8%) |
| 65 to 74 Years | 0 (0.0%) | 0 (0.0%) |
| 75 Years and over | 0 (0.0%) | 39 (20.5%) |
Technology Access in North Boston
Computing Device Access in North Boston
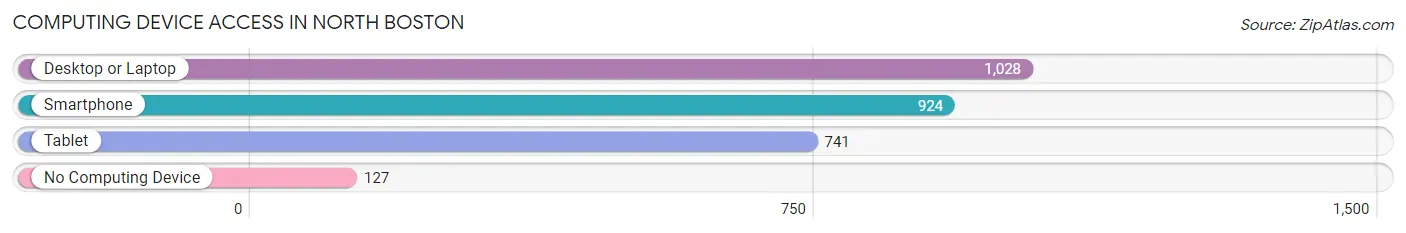
| Device Type | # Households | % Households |
| Desktop or Laptop | 1,028 | 78.2% |
| Smartphone | 924 | 70.3% |
| Tablet | 741 | 56.4% |
| No Computing Device | 127 | 9.7% |
| Total | 1,315 | 100.0% |
Internet Access in North Boston
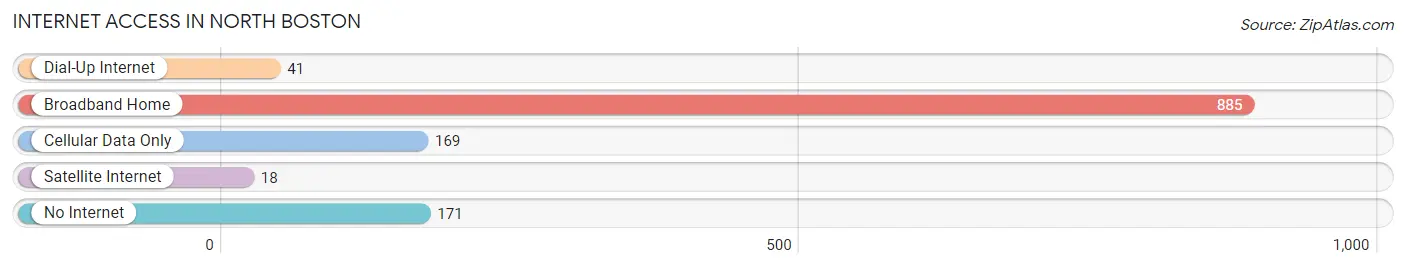
| Internet Type | # Households | % Households |
| Dial-Up Internet | 41 | 3.1% |
| Broadband Home | 885 | 67.3% |
| Cellular Data Only | 169 | 12.9% |
| Satellite Internet | 18 | 1.4% |
| No Internet | 171 | 13.0% |
| Total | 1,315 | 100.0% |
North Boston Summary
Boston, New York is a small town located in the northern part of the state of New York. It is situated in the foothills of the Adirondack Mountains and is part of the larger metropolitan area of Buffalo-Niagara Falls. The town has a population of approximately 1,500 people and is located in Niagara County.
History
The area that is now North Boston was first settled in the late 1700s by a group of settlers from Massachusetts. The town was originally known as “Boston Corners” and was part of the Town of Cambria. In 1808, the Town of North Boston was officially established and the name was changed to North Boston. The town was named after the city of Boston, Massachusetts, which was the hometown of many of the settlers.
The town grew slowly over the years and by the mid-1800s, it had become a thriving agricultural community. The town was known for its dairy farms and its production of cheese. In the late 1800s, the town began to experience a period of industrialization and the population began to grow. By the early 1900s, the town had become a center for manufacturing and industry.
Geography
North Boston is located in the northern part of Niagara County, New York. It is situated in the foothills of the Adirondack Mountains and is part of the larger metropolitan area of Buffalo-Niagara Falls. The town is bordered by the towns of Cambria, Lockport, and Pendleton. The town is located approximately 25 miles north of Buffalo and is about an hour’s drive from the Canadian border.
The town is situated on the Niagara River and is home to several small lakes and ponds. The town is also home to several parks and recreational areas, including the Niagara Falls State Park and the Niagara Gorge.
Economy
The economy of North Boston is largely based on agriculture and manufacturing. The town is home to several dairy farms and cheese factories, as well as a number of other small businesses. The town is also home to several small manufacturing companies, including a paper mill and a plastics factory.
The town is also home to several tourist attractions, including the Niagara Falls State Park and the Niagara Gorge. The town is also home to several wineries and vineyards, as well as a number of restaurants and shops.
Demographics
As of the 2010 census, the population of North Boston was 1,500 people. The racial makeup of the town was 97.3% White, 0.7% African American, 0.3% Native American, 0.3% Asian, and 1.3% from two or more races. The median household income was $45,000 and the median family income was $50,000.
The town is home to a number of churches, including the First Baptist Church of North Boston, the North Boston United Methodist Church, and the North Boston Presbyterian Church. The town is also home to a number of schools, including the North Boston Central School District and the Niagara County Community College.
Conclusion
North Boston, New York is a small town located in the northern part of the state of New York. It is situated in the foothills of the Adirondack Mountains and is part of the larger metropolitan area of Buffalo-Niagara Falls. The town has a population of approximately 1,500 people and is located in Niagara County. The town’s economy is largely based on agriculture and manufacturing, and it is home to several tourist attractions, including the Niagara Falls State Park and the Niagara Gorge. The town is also home to a number of churches, schools, and other businesses.
Common Questions
What is Per Capita Income in North Boston?
Per Capita income in North Boston is $39,925.
What is the Median Family Income in North Boston?
Median Family Income in North Boston is $104,098.
What is the Median Household income in North Boston?
Median Household Income in North Boston is $56,840.
What is Income or Wage Gap in North Boston?
Income or Wage Gap in North Boston is 30.7%.
Women in North Boston earn 69.3 cents for every dollar earned by a man.
What is Inequality or Gini Index in North Boston?
Inequality or Gini Index in North Boston is 0.38.
What is the Total Population of North Boston?
Total Population of North Boston is 2,554.
What is the Total Male Population of North Boston?
Total Male Population of North Boston is 1,282.
What is the Total Female Population of North Boston?
Total Female Population of North Boston is 1,272.
What is the Ratio of Males per 100 Females in North Boston?
There are 100.79 Males per 100 Females in North Boston.
What is the Ratio of Females per 100 Males in North Boston?
There are 99.22 Females per 100 Males in North Boston.
What is the Median Population Age in North Boston?
Median Population Age in North Boston is 56.3 Years.
What is the Average Family Size in North Boston
Average Family Size in North Boston is 2.6 People.
What is the Average Household Size in North Boston
Average Household Size in North Boston is 1.9 People.
How Large is the Labor Force in North Boston?
There are 1,455 People in the Labor Forcein in North Boston.
What is the Percentage of People in the Labor Force in North Boston?
60.1% of People are in the Labor Force in North Boston.
What is the Unemployment Rate in North Boston?
Unemployment Rate in North Boston is 9.3%.