Cities with the Highest Percentage of Latvian Population in New York
RELATED REPORTS & OPTIONS
Latvian
New York
Compare Cities
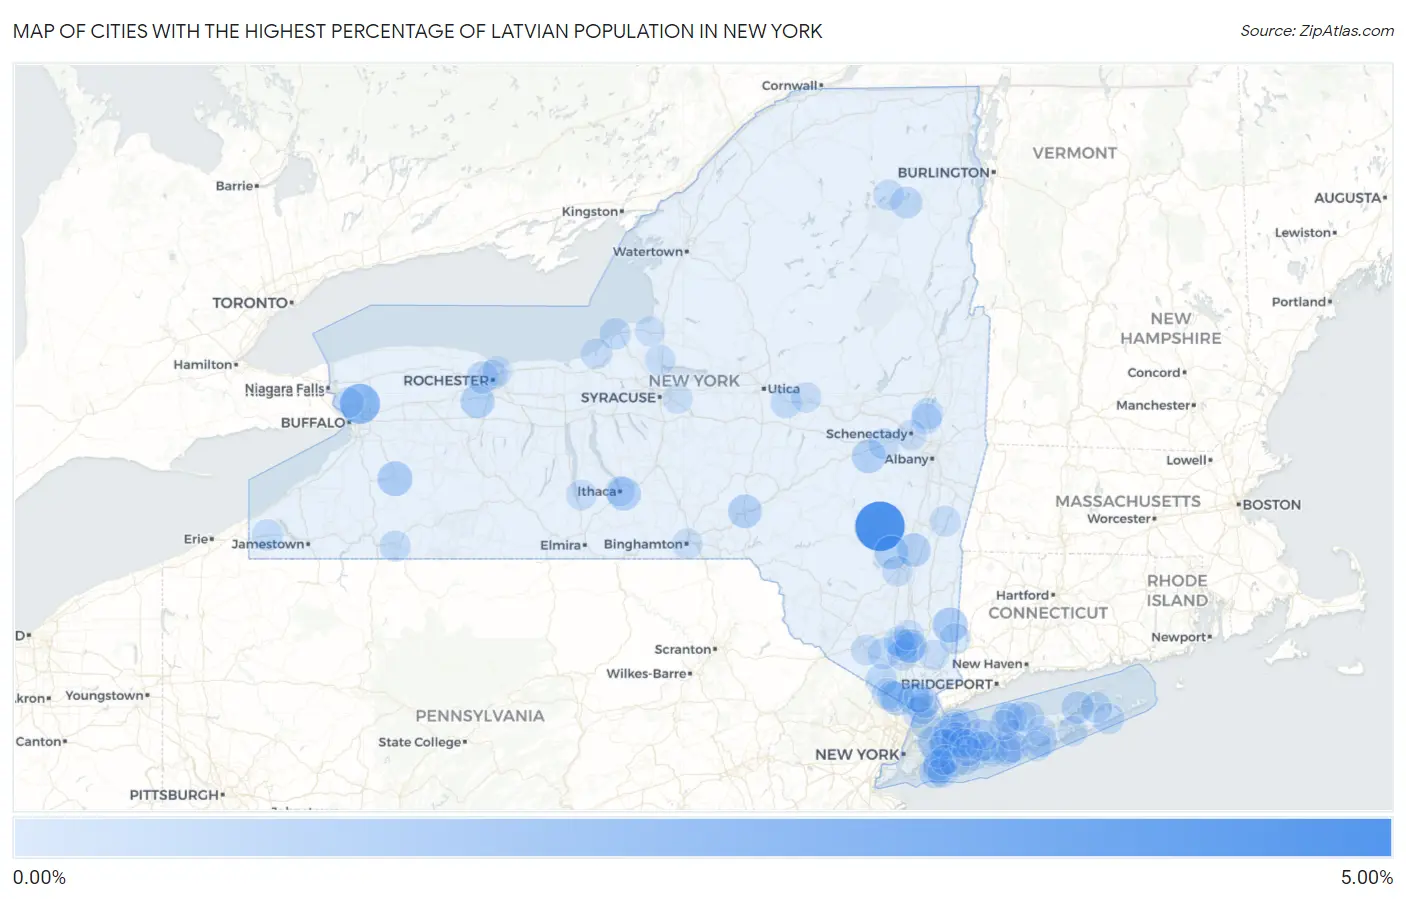
Map of Cities with the Highest Percentage of Latvian Population in New York
0.00%
5.00%
Cities with the Highest Percentage of Latvian Population in New York
| City | Latvian | vs State | vs National | |
| 1. | Hunter | 4.67% | 0.044%(+4.62)#1 | 0.026%(+4.64)#12 |
| 2. | Loudonville | 2.67% | 0.044%(+2.62)#2 | 0.026%(+2.64)#26 |
| 3. | University At Buffalo | 2.36% | 0.044%(+2.32)#3 | 0.026%(+2.33)#29 |
| 4. | Pawling | 1.19% | 0.044%(+1.14)#4 | 0.026%(+1.16)#69 |
| 5. | Yorkshire | 1.14% | 0.044%(+1.09)#5 | 0.026%(+1.11)#75 |
| 6. | Scottsville | 0.97% | 0.044%(+0.923)#6 | 0.026%(+0.941)#92 |
| 7. | Schoharie | 0.94% | 0.044%(+0.898)#7 | 0.026%(+0.916)#95 |
| 8. | Woodstock | 0.90% | 0.044%(+0.861)#8 | 0.026%(+0.879)#101 |
| 9. | Nelsonville | 0.89% | 0.044%(+0.847)#9 | 0.026%(+0.865)#106 |
| 10. | East Ithaca | 0.89% | 0.044%(+0.846)#10 | 0.026%(+0.864)#107 |
| 11. | Sidney | 0.88% | 0.044%(+0.836)#11 | 0.026%(+0.854)#111 |
| 12. | Tivoli | 0.87% | 0.044%(+0.829)#12 | 0.026%(+0.847)#113 |
| 13. | Chestnut Ridge | 0.84% | 0.044%(+0.798)#13 | 0.026%(+0.816)#116 |
| 14. | South Nyack | 0.66% | 0.044%(+0.612)#14 | 0.026%(+0.630)#158 |
| 15. | Hewlett Neck | 0.62% | 0.044%(+0.580)#15 | 0.026%(+0.598)#168 |
| 16. | Great Neck Estates | 0.61% | 0.044%(+0.569)#16 | 0.026%(+0.587)#173 |
| 17. | North Gates | 0.57% | 0.044%(+0.528)#17 | 0.026%(+0.546)#189 |
| 18. | Bayville | 0.55% | 0.044%(+0.503)#18 | 0.026%(+0.521)#200 |
| 19. | Cutchogue | 0.54% | 0.044%(+0.494)#19 | 0.026%(+0.512)#203 |
| 20. | Atlantic Beach | 0.45% | 0.044%(+0.411)#20 | 0.026%(+0.429)#239 |
| 21. | Lake Placid | 0.44% | 0.044%(+0.395)#21 | 0.026%(+0.413)#251 |
| 22. | Tuxedo Park | 0.43% | 0.044%(+0.385)#22 | 0.026%(+0.403)#256 |
| 23. | South Blooming Grove | 0.41% | 0.044%(+0.371)#23 | 0.026%(+0.389)#269 |
| 24. | Center Moriches | 0.41% | 0.044%(+0.362)#24 | 0.026%(+0.380)#276 |
| 25. | Suny Oswego | 0.39% | 0.044%(+0.346)#25 | 0.026%(+0.364)#287 |
| 26. | Ilion | 0.38% | 0.044%(+0.333)#26 | 0.026%(+0.351)#300 |
| 27. | Round Lake | 0.36% | 0.044%(+0.321)#27 | 0.026%(+0.339)#310 |
| 28. | Sherman | 0.35% | 0.044%(+0.309)#28 | 0.026%(+0.327)#322 |
| 29. | Hastings On Hudson | 0.34% | 0.044%(+0.299)#29 | 0.026%(+0.317)#333 |
| 30. | East Setauket | 0.34% | 0.044%(+0.298)#30 | 0.026%(+0.316)#334 |
| 31. | Shoreham | 0.34% | 0.044%(+0.295)#31 | 0.026%(+0.313)#338 |
| 32. | Port Jefferson | 0.34% | 0.044%(+0.294)#32 | 0.026%(+0.312)#339 |
| 33. | North Haven | 0.33% | 0.044%(+0.285)#33 | 0.026%(+0.303)#348 |
| 34. | Cornwall On Hudson | 0.33% | 0.044%(+0.285)#34 | 0.026%(+0.303)#349 |
| 35. | Suffern | 0.33% | 0.044%(+0.282)#35 | 0.026%(+0.300)#352 |
| 36. | North Lindenhurst | 0.32% | 0.044%(+0.279)#36 | 0.026%(+0.297)#357 |
| 37. | Airmont | 0.32% | 0.044%(+0.276)#37 | 0.026%(+0.294)#361 |
| 38. | East Hampton | 0.31% | 0.044%(+0.271)#38 | 0.026%(+0.289)#370 |
| 39. | Albertson | 0.31% | 0.044%(+0.270)#39 | 0.026%(+0.288)#371 |
| 40. | West Point | 0.31% | 0.044%(+0.270)#40 | 0.026%(+0.288)#372 |
| 41. | North Bay Shore | 0.31% | 0.044%(+0.266)#41 | 0.026%(+0.284)#376 |
| 42. | Delanson | 0.30% | 0.044%(+0.260)#42 | 0.026%(+0.278)#386 |
| 43. | Pelham | 0.30% | 0.044%(+0.259)#43 | 0.026%(+0.277)#389 |
| 44. | Putnam Lake | 0.29% | 0.044%(+0.244)#44 | 0.026%(+0.262)#411 |
| 45. | St Bonaventure | 0.29% | 0.044%(+0.243)#45 | 0.026%(+0.261)#415 |
| 46. | Mill Neck | 0.27% | 0.044%(+0.227)#46 | 0.026%(+0.245)#437 |
| 47. | Sayville | 0.27% | 0.044%(+0.223)#47 | 0.026%(+0.241)#444 |
| 48. | Hewlett | 0.26% | 0.044%(+0.220)#48 | 0.026%(+0.238)#449 |
| 49. | Fair Haven | 0.26% | 0.044%(+0.217)#49 | 0.026%(+0.235)#454 |
| 50. | Philmont | 0.26% | 0.044%(+0.213)#50 | 0.026%(+0.231)#466 |
| 51. | Saranac Lake | 0.26% | 0.044%(+0.212)#51 | 0.026%(+0.230)#467 |
| 52. | Glen Head | 0.25% | 0.044%(+0.206)#52 | 0.026%(+0.224)#481 |
| 53. | Goshen | 0.24% | 0.044%(+0.200)#53 | 0.026%(+0.218)#495 |
| 54. | Burdett | 0.24% | 0.044%(+0.199)#54 | 0.026%(+0.216)#502 |
| 55. | Central Square | 0.24% | 0.044%(+0.197)#55 | 0.026%(+0.215)#504 |
| 56. | Hurley | 0.24% | 0.044%(+0.194)#56 | 0.026%(+0.212)#512 |
| 57. | Highland-On-The-Lake | 0.24% | 0.044%(+0.193)#57 | 0.026%(+0.211)#516 |
| 58. | Mahopac | 0.23% | 0.044%(+0.184)#58 | 0.026%(+0.202)#542 |
| 59. | Lloyd Harbor | 0.22% | 0.044%(+0.180)#59 | 0.026%(+0.198)#548 |
| 60. | Ardsley | 0.22% | 0.044%(+0.176)#60 | 0.026%(+0.194)#553 |
| 61. | Country Knolls | 0.21% | 0.044%(+0.163)#61 | 0.026%(+0.181)#578 |
| 62. | Jericho | 0.20% | 0.044%(+0.159)#62 | 0.026%(+0.177)#586 |
| 63. | Schenectady | 0.20% | 0.044%(+0.156)#63 | 0.026%(+0.174)#596 |
| 64. | West Sayville | 0.20% | 0.044%(+0.155)#64 | 0.026%(+0.173)#598 |
| 65. | Islip | 0.20% | 0.044%(+0.153)#65 | 0.026%(+0.171)#605 |
| 66. | Tonawanda | 0.18% | 0.044%(+0.140)#66 | 0.026%(+0.158)#637 |
| 67. | Floral Park | 0.18% | 0.044%(+0.139)#67 | 0.026%(+0.157)#639 |
| 68. | Poquott | 0.18% | 0.044%(+0.137)#68 | 0.026%(+0.155)#646 |
| 69. | Vails Gate | 0.17% | 0.044%(+0.130)#69 | 0.026%(+0.148)#667 |
| 70. | Elmsford | 0.17% | 0.044%(+0.130)#70 | 0.026%(+0.148)#668 |
| 71. | Muttontown | 0.17% | 0.044%(+0.128)#71 | 0.026%(+0.146)#675 |
| 72. | Massapequa | 0.17% | 0.044%(+0.126)#72 | 0.026%(+0.144)#680 |
| 73. | Commack | 0.17% | 0.044%(+0.124)#73 | 0.026%(+0.142)#683 |
| 74. | Roessleville | 0.16% | 0.044%(+0.120)#74 | 0.026%(+0.138)#695 |
| 75. | Cold Spring | 0.16% | 0.044%(+0.119)#75 | 0.026%(+0.137)#704 |
| 76. | Beacon | 0.16% | 0.044%(+0.115)#76 | 0.026%(+0.133)#713 |
| 77. | Little Falls | 0.15% | 0.044%(+0.109)#77 | 0.026%(+0.127)#734 |
| 78. | Blue Point | 0.15% | 0.044%(+0.108)#78 | 0.026%(+0.126)#738 |
| 79. | Long Beach | 0.15% | 0.044%(+0.103)#79 | 0.026%(+0.121)#755 |
| 80. | Roslyn Heights | 0.14% | 0.044%(+0.101)#80 | 0.026%(+0.119)#759 |
| 81. | Binghamton | 0.14% | 0.044%(+0.099)#81 | 0.026%(+0.117)#766 |
| 82. | Farmingville | 0.14% | 0.044%(+0.098)#82 | 0.026%(+0.116)#771 |
| 83. | Melville | 0.13% | 0.044%(+0.091)#83 | 0.026%(+0.109)#798 |
| 84. | Elwood | 0.13% | 0.044%(+0.082)#84 | 0.026%(+0.100)#827 |
| 85. | Sound Beach | 0.13% | 0.044%(+0.082)#85 | 0.026%(+0.100)#828 |
| 86. | Rochester | 0.13% | 0.044%(+0.082)#86 | 0.026%(+0.099)#831 |
| 87. | Deer Park | 0.12% | 0.044%(+0.081)#87 | 0.026%(+0.099)#833 |
| 88. | Merrick | 0.12% | 0.044%(+0.075)#88 | 0.026%(+0.093)#856 |
| 89. | Manorville | 0.12% | 0.044%(+0.075)#89 | 0.026%(+0.093)#863 |
| 90. | Rockville Centre | 0.11% | 0.044%(+0.065)#90 | 0.026%(+0.083)#899 |
| 91. | Ithaca | 0.11% | 0.044%(+0.065)#91 | 0.026%(+0.083)#902 |
| 92. | Mastic Beach | 0.11% | 0.044%(+0.061)#92 | 0.026%(+0.079)#917 |
| 93. | Irondequoit | 0.10% | 0.044%(+0.061)#93 | 0.026%(+0.079)#919 |
| 94. | Mexico | 0.10% | 0.044%(+0.060)#94 | 0.026%(+0.078)#923 |
| 95. | Plainview | 0.10% | 0.044%(+0.058)#95 | 0.026%(+0.076)#932 |
| 96. | Hampton Bays | 0.10% | 0.044%(+0.057)#96 | 0.026%(+0.075)#937 |
| 97. | Sleepy Hollow | 0.096% | 0.044%(+0.053)#97 | 0.026%(+0.071)#958 |
| 98. | Stony Brook | 0.096% | 0.044%(+0.052)#98 | 0.026%(+0.070)#959 |
| 99. | Farmingdale | 0.095% | 0.044%(+0.051)#99 | 0.026%(+0.069)#968 |
| 100. | Fayetteville | 0.094% | 0.044%(+0.051)#100 | 0.026%(+0.068)#973 |
Common Questions
What are the Top 10 Cities with the Highest Percentage of Latvian Population in New York?
Top 10 Cities with the Highest Percentage of Latvian Population in New York are:
#1
4.67%
#2
2.36%
#3
1.19%
#4
1.14%
#5
0.97%
#6
0.94%
#7
0.90%
#8
0.89%
#9
0.89%
#10
0.88%
What city has the Highest Percentage of Latvian Population in New York?
Hunter has the Highest Percentage of Latvian Population in New York with 4.67%.
What is the Percentage of Latvian Population in the State of New York?
Percentage of Latvian Population in New York is 0.044%.
What is the Percentage of Latvian Population in the United States?
Percentage of Latvian Population in the United States is 0.026%.