Cities with the Highest Percentage of German Population in New York
RELATED REPORTS & OPTIONS
German
New York
Compare Cities
Map of Cities with the Highest Percentage of German Population in New York
0.00%
80.00%
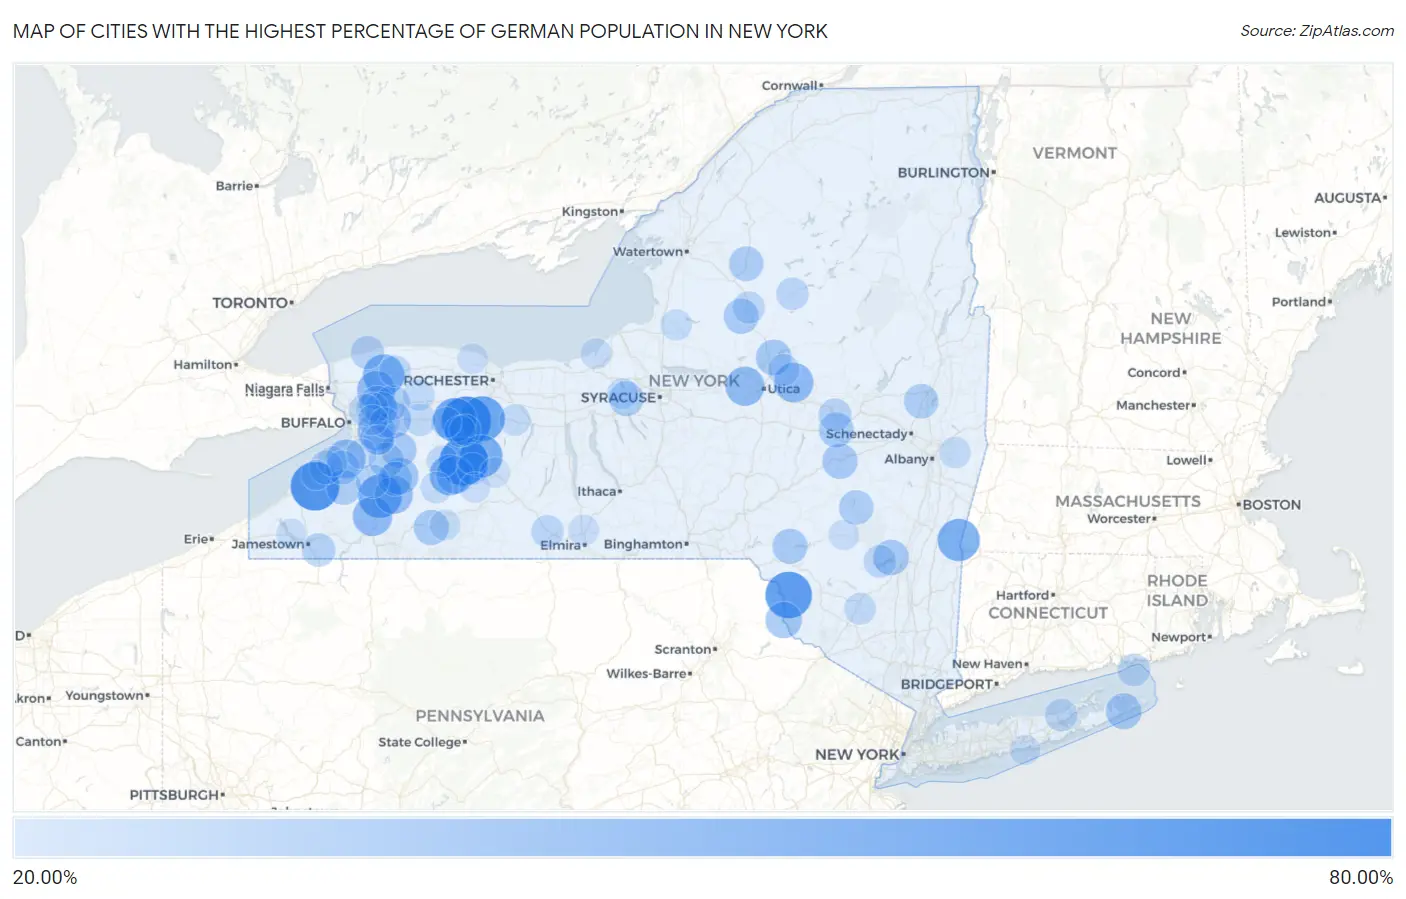
Cities with the Highest Percentage of German Population in New York
| City | German | vs State | vs National | |
| 1. | Fowlerville | 65.92% | 8.82% (+57.1)#1 | 12.66% (+53.3)#382 |
| 2. | Forestville | 64.10% | 8.82% (+55.3)#2 | 12.66% (+51.4)#435 |
| 3. | Tuscarora | 64.07% | 8.82% (+55.2)#3 | 12.66% (+51.4)#437 |
| 4. | Cementon | 61.54% | 8.82% (+52.7)#4 | 12.66% (+48.9)#542 |
| 5. | Hortonville | 60.28% | 8.82% (+51.5)#5 | 12.66% (+47.6)#599 |
| 6. | East Avon | 57.04% | 8.82% (+48.2)#6 | 12.66% (+44.4)#746 |
| 7. | Linwood | 54.84% | 8.82% (+46.0)#7 | 12.66% (+42.2)#878 |
| 8. | West Valley | 54.14% | 8.82% (+45.3)#8 | 12.66% (+41.5)#913 |
| 9. | Scottsburg | 52.81% | 8.82% (+44.0)#9 | 12.66% (+40.1)#1,014 |
| 10. | Copake Falls | 51.96% | 8.82% (+43.1)#10 | 12.66% (+39.3)#1,090 |
| 11. | Gasport | 50.36% | 8.82% (+41.5)#11 | 12.66% (+37.7)#1,254 |
| 12. | Eagle Bay | 50.00% | 8.82% (+41.2)#12 | 12.66% (+37.3)#1,307 |
| 13. | Hunt | 49.19% | 8.82% (+40.4)#13 | 12.66% (+36.5)#1,398 |
| 14. | Bridgeville | 49.11% | 8.82% (+40.3)#14 | 12.66% (+36.4)#1,411 |
| 15. | Ellicottville | 46.79% | 8.82% (+38.0)#15 | 12.66% (+34.1)#1,740 |
| 16. | Middleville | 46.62% | 8.82% (+37.8)#16 | 12.66% (+34.0)#1,770 |
| 17. | Fly Creek | 46.08% | 8.82% (+37.3)#17 | 12.66% (+33.4)#1,857 |
| 18. | Westmoreland | 46.05% | 8.82% (+37.2)#18 | 12.66% (+33.4)#1,862 |
| 19. | Eden | 45.45% | 8.82% (+36.6)#19 | 12.66% (+32.8)#1,959 |
| 20. | Rapids | 44.64% | 8.82% (+35.8)#20 | 12.66% (+32.0)#2,096 |
| 21. | Machias | 44.12% | 8.82% (+35.3)#21 | 12.66% (+31.5)#2,185 |
| 22. | Elma Center | 43.77% | 8.82% (+34.9)#22 | 12.66% (+31.1)#2,240 |
| 23. | Dalton | 43.23% | 8.82% (+34.4)#23 | 12.66% (+30.6)#2,367 |
| 24. | Arcade | 42.00% | 8.82% (+33.2)#24 | 12.66% (+29.3)#2,600 |
| 25. | Alden | 41.86% | 8.82% (+33.0)#25 | 12.66% (+29.2)#2,630 |
| 26. | Narrowsburg | 41.01% | 8.82% (+32.2)#26 | 12.66% (+28.3)#2,819 |
| 27. | Clarence Center | 40.32% | 8.82% (+31.5)#27 | 12.66% (+27.7)#2,960 |
| 28. | Napeague | 40.26% | 8.82% (+31.4)#28 | 12.66% (+27.6)#2,973 |
| 29. | Prospect | 40.00% | 8.82% (+31.2)#29 | 12.66% (+27.3)#3,017 |
| 30. | West Hurley | 39.37% | 8.82% (+30.5)#30 | 12.66% (+26.7)#3,157 |
| 31. | Richmondville | 39.27% | 8.82% (+30.4)#31 | 12.66% (+26.6)#3,176 |
| 32. | Strykersville | 39.20% | 8.82% (+30.4)#32 | 12.66% (+26.5)#3,190 |
| 33. | Friendship | 39.02% | 8.82% (+30.2)#33 | 12.66% (+26.4)#3,232 |
| 34. | Constableville | 38.76% | 8.82% (+29.9)#34 | 12.66% (+26.1)#3,294 |
| 35. | Downsville | 38.73% | 8.82% (+29.9)#35 | 12.66% (+26.1)#3,309 |
| 36. | Ames | 38.55% | 8.82% (+29.7)#36 | 12.66% (+25.9)#3,359 |
| 37. | Gowanda | 38.46% | 8.82% (+29.6)#37 | 12.66% (+25.8)#3,383 |
| 38. | Elbridge | 38.08% | 8.82% (+29.3)#38 | 12.66% (+25.4)#3,490 |
| 39. | Holland | 38.01% | 8.82% (+29.2)#39 | 12.66% (+25.4)#3,505 |
| 40. | Croghan | 37.97% | 8.82% (+29.2)#40 | 12.66% (+25.3)#3,517 |
| 41. | North Ballston Spa | 37.80% | 8.82% (+29.0)#41 | 12.66% (+25.1)#3,546 |
| 42. | Prattsville | 37.76% | 8.82% (+28.9)#42 | 12.66% (+25.1)#3,562 |
| 43. | Akron | 37.75% | 8.82% (+28.9)#43 | 12.66% (+25.1)#3,563 |
| 44. | Yorkshire | 37.37% | 8.82% (+28.5)#44 | 12.66% (+24.7)#3,661 |
| 45. | Billington Heights | 37.20% | 8.82% (+28.4)#45 | 12.66% (+24.5)#3,705 |
| 46. | North Collins | 36.63% | 8.82% (+27.8)#46 | 12.66% (+24.0)#3,859 |
| 47. | Farnham | 36.08% | 8.82% (+27.3)#47 | 12.66% (+23.4)#4,002 |
| 48. | Springville | 35.80% | 8.82% (+27.0)#48 | 12.66% (+23.1)#4,071 |
| 49. | Frewsburg | 35.59% | 8.82% (+26.8)#49 | 12.66% (+22.9)#4,127 |
| 50. | Clarence | 35.51% | 8.82% (+26.7)#50 | 12.66% (+22.9)#4,149 |
| 51. | Olcott | 35.25% | 8.82% (+26.4)#51 | 12.66% (+22.6)#4,231 |
| 52. | Nelliston | 34.92% | 8.82% (+26.1)#52 | 12.66% (+22.3)#4,317 |
| 53. | Round Top | 34.84% | 8.82% (+26.0)#53 | 12.66% (+22.2)#4,336 |
| 54. | Shokan | 34.23% | 8.82% (+25.4)#54 | 12.66% (+21.6)#4,535 |
| 55. | Northville | 34.12% | 8.82% (+25.3)#55 | 12.66% (+21.5)#4,588 |
| 56. | East Frankfort | 34.07% | 8.82% (+25.2)#56 | 12.66% (+21.4)#4,609 |
| 57. | Coopers Plains | 34.03% | 8.82% (+25.2)#57 | 12.66% (+21.4)#4,622 |
| 58. | Fishers Island | 33.96% | 8.82% (+25.1)#58 | 12.66% (+21.3)#4,636 |
| 59. | Harris Hill | 33.90% | 8.82% (+25.1)#59 | 12.66% (+21.2)#4,657 |
| 60. | Old Forge | 33.86% | 8.82% (+25.0)#60 | 12.66% (+21.2)#4,673 |
| 61. | Lyons Falls | 33.53% | 8.82% (+24.7)#61 | 12.66% (+20.9)#4,768 |
| 62. | Williamsville | 33.23% | 8.82% (+24.4)#62 | 12.66% (+20.6)#4,873 |
| 63. | Copake | 33.19% | 8.82% (+24.4)#63 | 12.66% (+20.5)#4,881 |
| 64. | Sparrow Bush | 33.10% | 8.82% (+24.3)#64 | 12.66% (+20.4)#4,911 |
| 65. | Alexander | 32.94% | 8.82% (+24.1)#65 | 12.66% (+20.3)#4,959 |
| 66. | Walworth | 32.83% | 8.82% (+24.0)#66 | 12.66% (+20.2)#4,998 |
| 67. | Poland | 32.72% | 8.82% (+23.9)#67 | 12.66% (+20.1)#5,039 |
| 68. | Castile | 32.70% | 8.82% (+23.9)#68 | 12.66% (+20.0)#5,050 |
| 69. | Cragsmoor | 32.63% | 8.82% (+23.8)#69 | 12.66% (+20.0)#5,077 |
| 70. | Byersville | 32.61% | 8.82% (+23.8)#70 | 12.66% (+19.9)#5,085 |
| 71. | Middleport | 32.61% | 8.82% (+23.8)#71 | 12.66% (+19.9)#5,086 |
| 72. | Poestenkill | 32.23% | 8.82% (+23.4)#72 | 12.66% (+19.6)#5,235 |
| 73. | Fillmore | 32.21% | 8.82% (+23.4)#73 | 12.66% (+19.5)#5,244 |
| 74. | Kysorville | 32.20% | 8.82% (+23.4)#74 | 12.66% (+19.5)#5,249 |
| 75. | Oakfield | 32.14% | 8.82% (+23.3)#75 | 12.66% (+19.5)#5,269 |
| 76. | Bloomfield | 31.94% | 8.82% (+23.1)#76 | 12.66% (+19.3)#5,351 |
| 77. | Greigsville | 31.93% | 8.82% (+23.1)#77 | 12.66% (+19.3)#5,360 |
| 78. | East Durham | 31.75% | 8.82% (+22.9)#78 | 12.66% (+19.1)#5,422 |
| 79. | Altmar | 31.61% | 8.82% (+22.8)#79 | 12.66% (+19.0)#5,461 |
| 80. | West Kill | 31.48% | 8.82% (+22.7)#80 | 12.66% (+18.8)#5,516 |
| 81. | Brooktondale | 31.48% | 8.82% (+22.7)#81 | 12.66% (+18.8)#5,520 |
| 82. | Piffard | 31.45% | 8.82% (+22.6)#82 | 12.66% (+18.8)#5,530 |
| 83. | Jordan | 31.28% | 8.82% (+22.5)#83 | 12.66% (+18.6)#5,577 |
| 84. | Horseheads North | 31.03% | 8.82% (+22.2)#84 | 12.66% (+18.4)#5,668 |
| 85. | Fair Haven | 31.02% | 8.82% (+22.2)#85 | 12.66% (+18.4)#5,672 |
| 86. | Belmont | 30.87% | 8.82% (+22.0)#86 | 12.66% (+18.2)#5,736 |
| 87. | Pavilion | 30.63% | 8.82% (+21.8)#87 | 12.66% (+18.0)#5,820 |
| 88. | Canaseraga | 30.63% | 8.82% (+21.8)#88 | 12.66% (+18.0)#5,822 |
| 89. | Fleischmanns | 30.38% | 8.82% (+21.6)#89 | 12.66% (+17.7)#5,911 |
| 90. | Hilton | 30.38% | 8.82% (+21.6)#90 | 12.66% (+17.7)#5,918 |
| 91. | East Aurora | 30.32% | 8.82% (+21.5)#91 | 12.66% (+17.7)#5,936 |
| 92. | Angola | 30.32% | 8.82% (+21.5)#92 | 12.66% (+17.7)#5,937 |
| 93. | Bellport | 30.21% | 8.82% (+21.4)#93 | 12.66% (+17.5)#5,990 |
| 94. | Town Line | 30.19% | 8.82% (+21.4)#94 | 12.66% (+17.5)#5,997 |
| 95. | Bemus Point | 30.16% | 8.82% (+21.3)#95 | 12.66% (+17.5)#6,015 |
| 96. | North Boston | 30.11% | 8.82% (+21.3)#96 | 12.66% (+17.4)#6,025 |
| 97. | Highland-On-The-Lake | 30.03% | 8.82% (+21.2)#97 | 12.66% (+17.4)#6,042 |
| 98. | Lancaster | 30.02% | 8.82% (+21.2)#98 | 12.66% (+17.4)#6,047 |
| 99. | Wayland | 29.95% | 8.82% (+21.1)#99 | 12.66% (+17.3)#6,076 |
| 100. | Silver Creek | 29.78% | 8.82% (+21.0)#100 | 12.66% (+17.1)#6,151 |
Common Questions
What are the Top 10 Cities with the Highest Percentage of German Population in New York?
Top 10 Cities with the Highest Percentage of German Population in New York are:
#1
65.92%
#2
64.10%
#3
64.07%
#4
60.28%
#5
57.04%
#6
54.84%
#7
54.14%
#8
52.81%
#9
51.96%
#10
50.36%
What city has the Highest Percentage of German Population in New York?
Fowlerville has the Highest Percentage of German Population in New York with 65.92%.
What is the Percentage of German Population in the State of New York?
Percentage of German Population in New York is 8.82%.
What is the Percentage of German Population in the United States?
Percentage of German Population in the United States is 12.66%.